In today’s fast-paced and highly competitive market, Brand Management Dashboard decisions must be backed by data—not assumptions. Marketing spend, brand perception, campaign performance, and revenue contribution change rapidly. However, when this information remains spread across scattered spreadsheets, dashboards, and marketing tools, leaders lose visibility and speed.
That is exactly why the Brand Management Dashboard in Power BI becomes a powerful and essential solution.
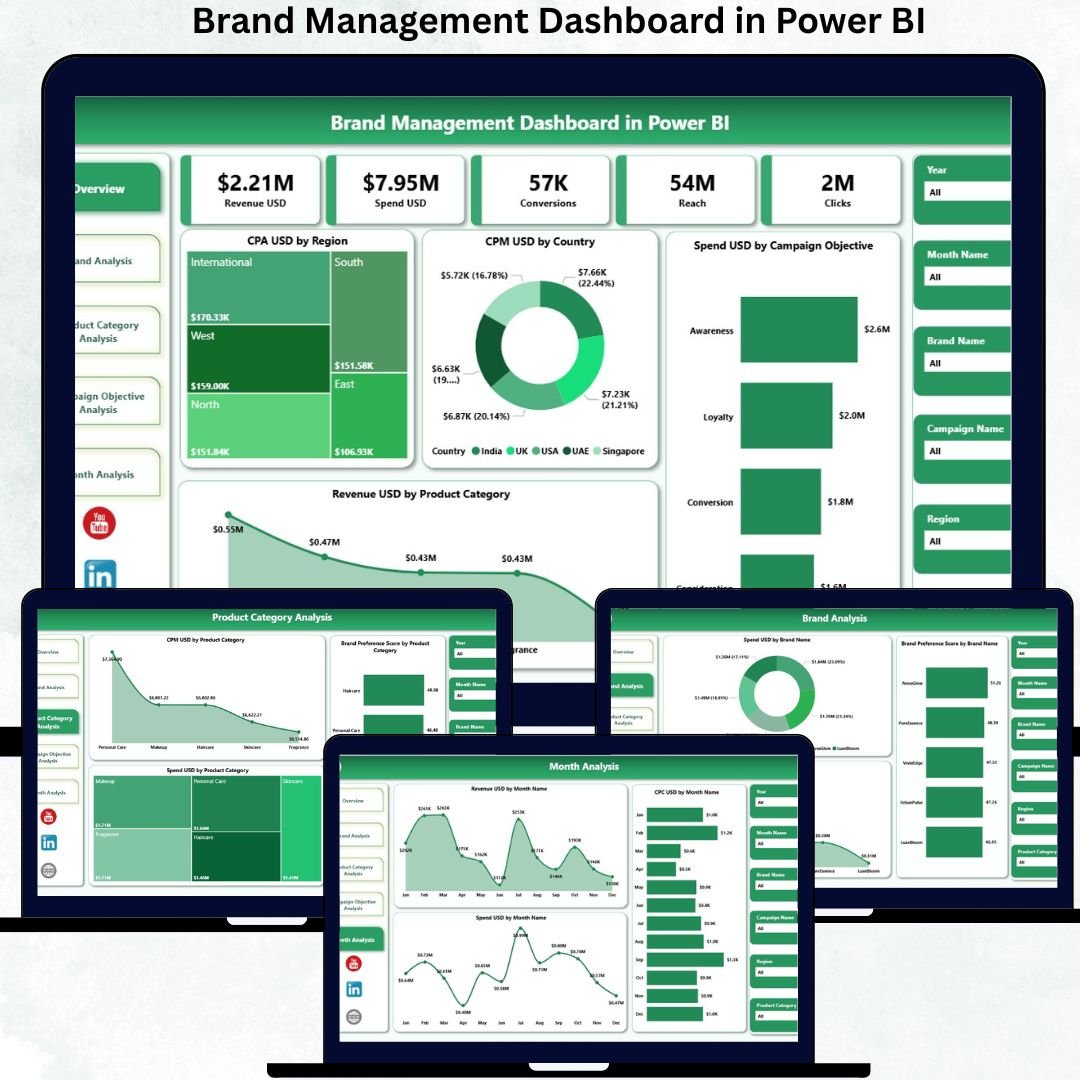
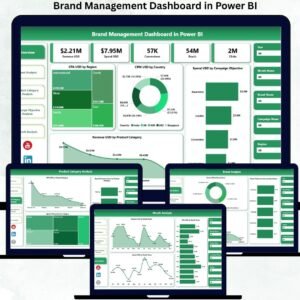
The Brand Management Dashboard in Power BI is a ready-to-use, interactive analytics dashboard designed for brand managers, marketing teams, CMOs, digital strategists, and leadership teams. It transforms raw brand and marketing data into clear KPIs, visual insights, and performance trends—all inside Power BI.
Instead of manually compiling reports, this dashboard instantly shows how brands perform across spend, revenue, CPA, CPC, CPM, brand preference score, conversions, regions, products, and campaign objectives. As a result, decision-makers gain clarity, speed, and confidence.
✅ Key Features of the Brand Management Dashboard in Power BI
🚀 This dashboard is built with 5 professionally designed pages, each focused on answering key brand and marketing questions.
-
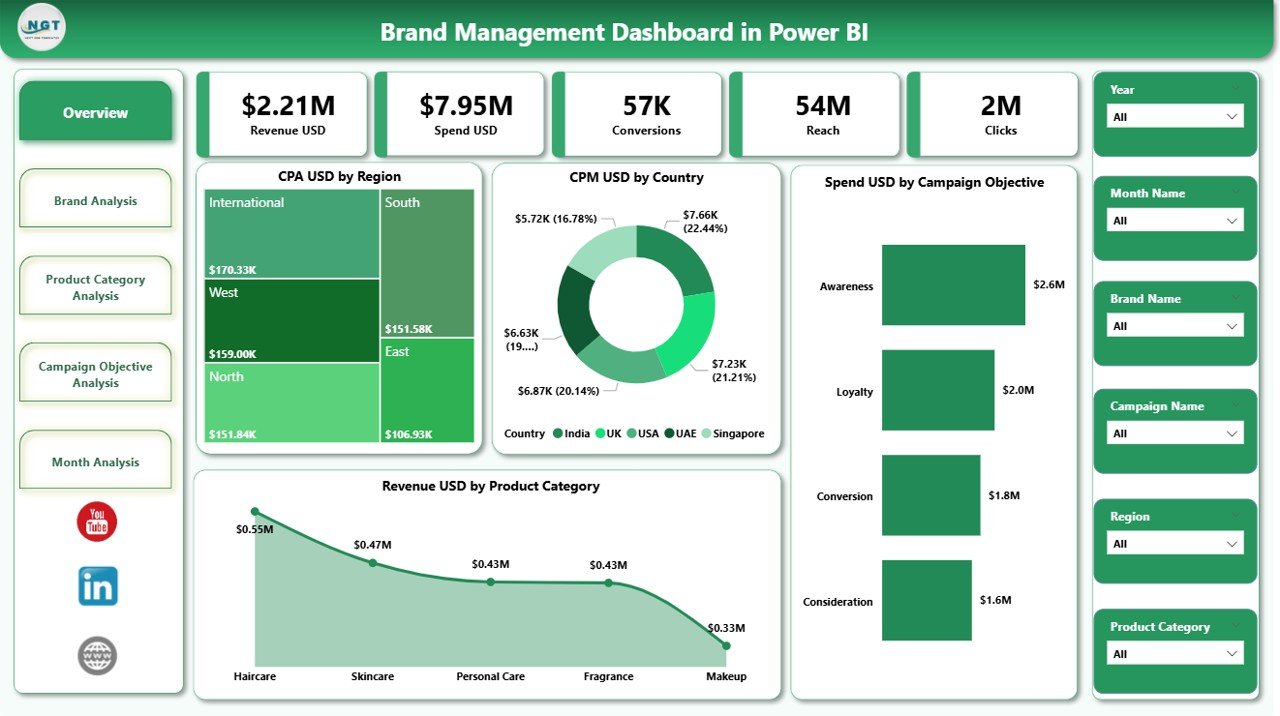
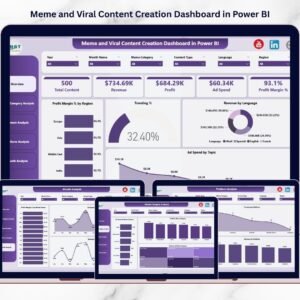
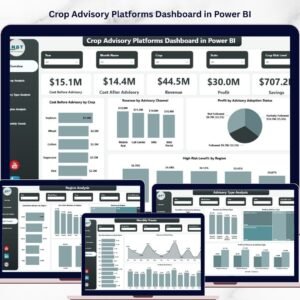
📊 Executive Overview with KPI Cards
-
🌍 Region, Brand, Product & Campaign-Based Insights
-
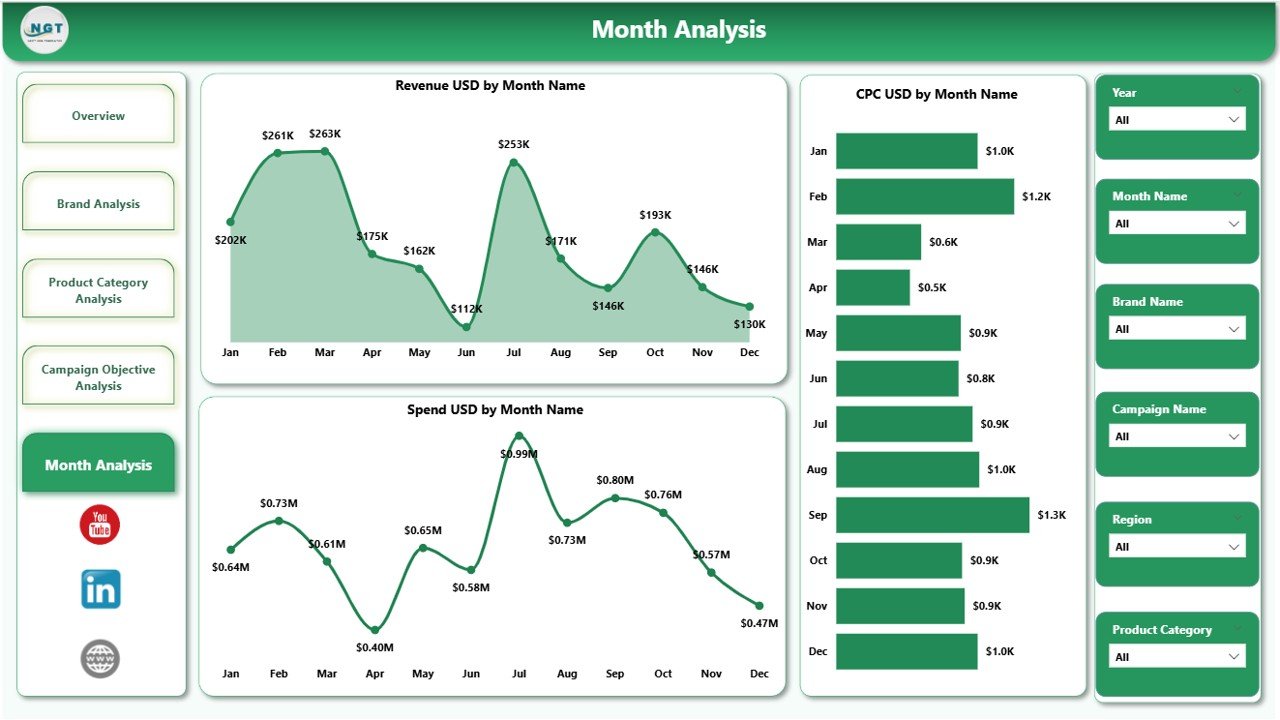
📈 Monthly Trends for Strategic Forecasting
-
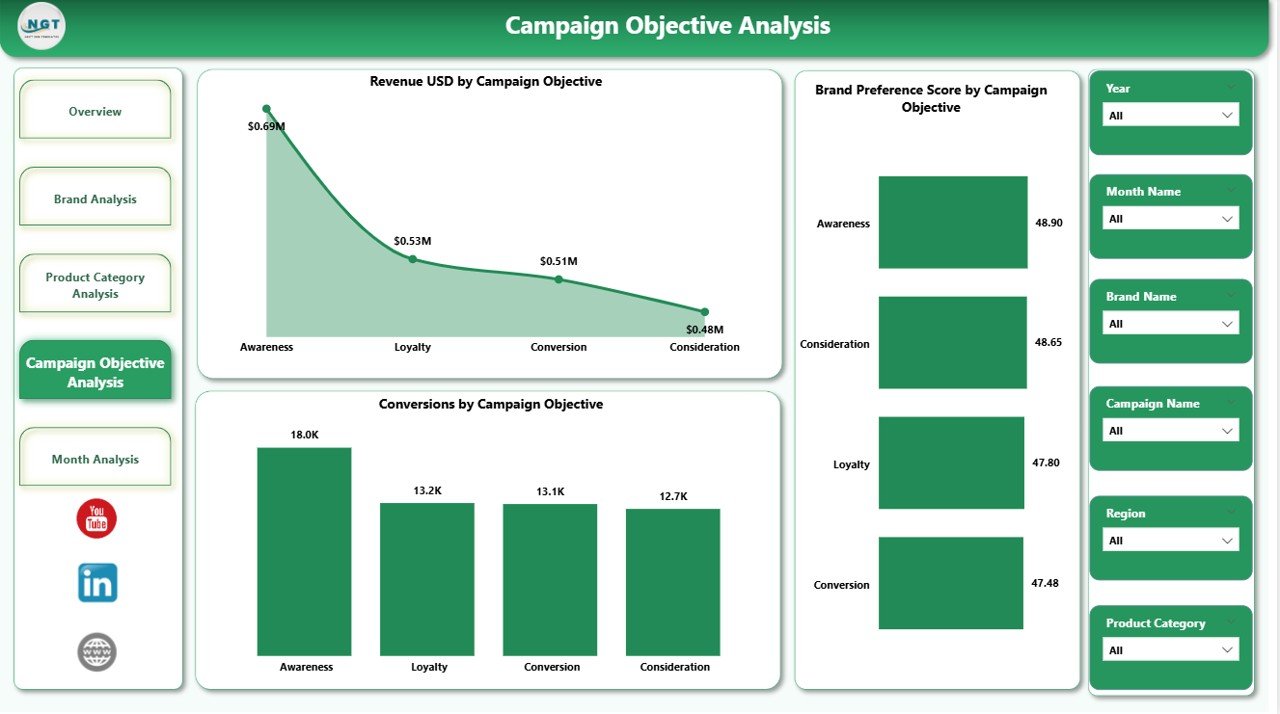
🎯 Campaign Objective Performance Tracking
-
⚡ Dynamic Filtering using Power BI slicers
Each visual updates instantly when you change filters, making analysis fast and effortless.
📦 What’s Inside the Brand Management Dashboard
When you download this product, you get:
✅ Professionally designed Power BI dashboard
✅ Overview page with CPA, CPM, Spend & Revenue KPI cards
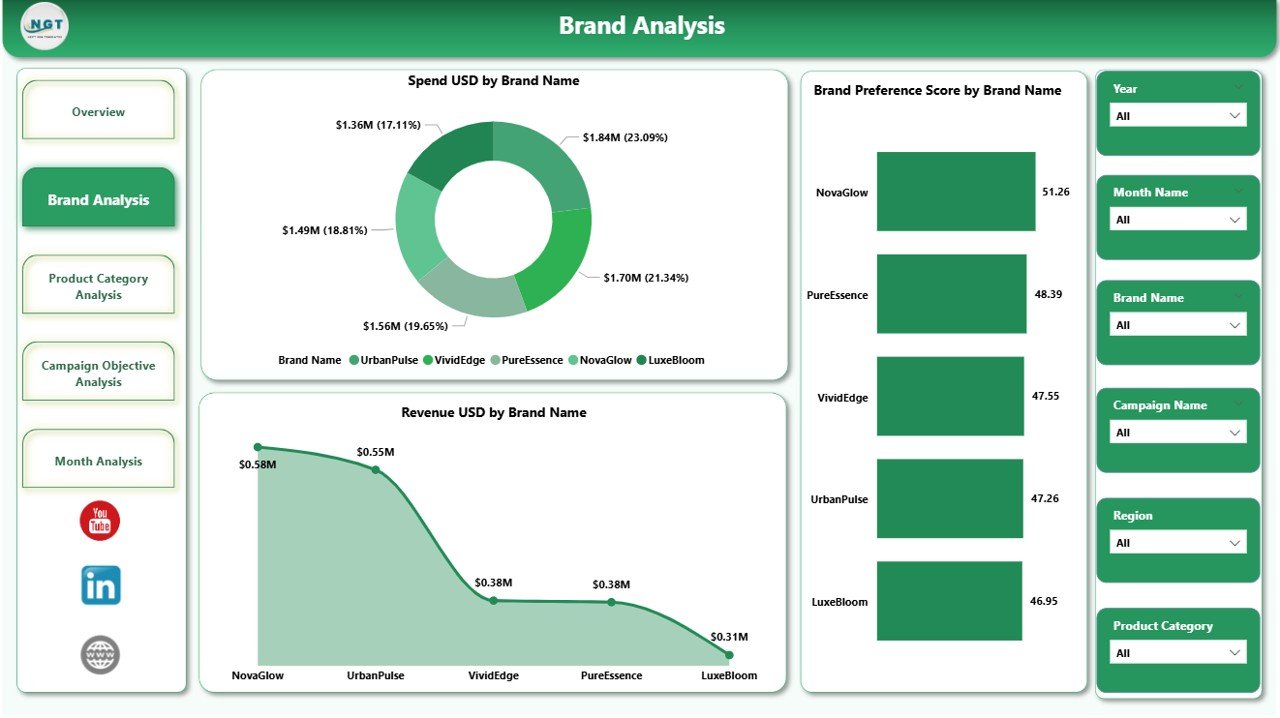
✅ Brand-level analysis for spend, revenue & preference
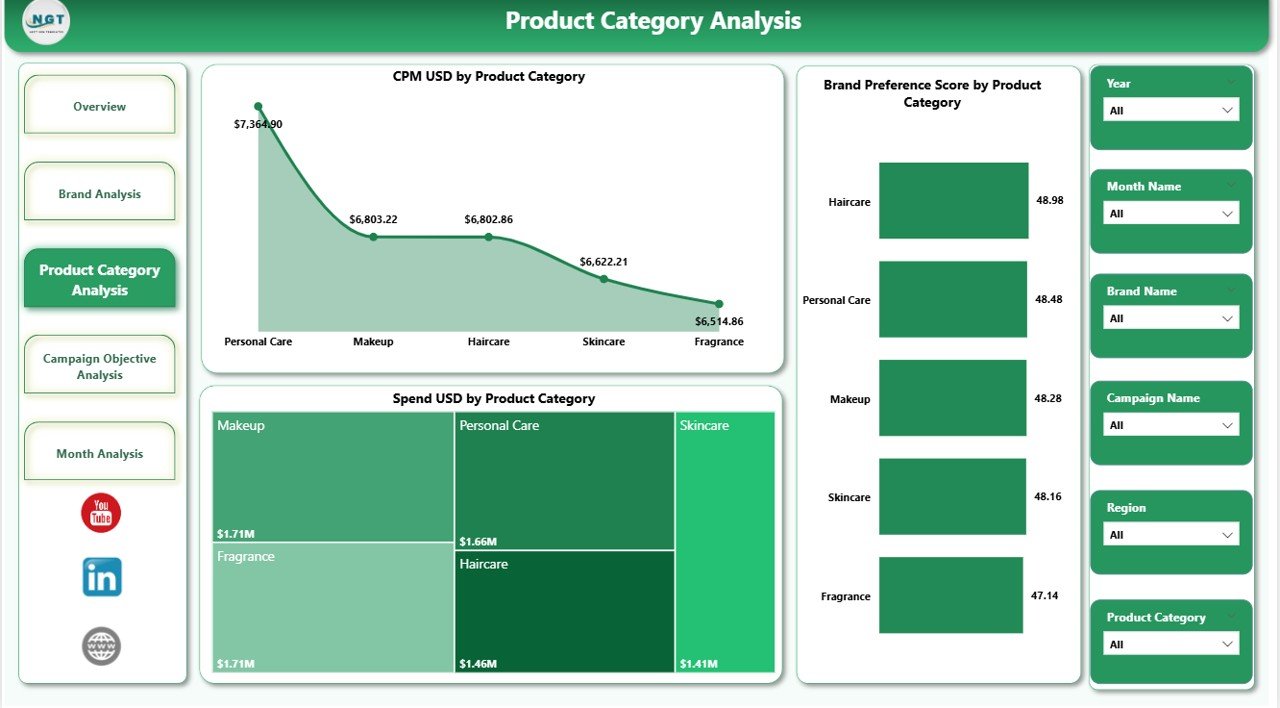
✅ Product category insights for spend, CPM & brand score
✅ Campaign objective performance & conversion analysis
✅ Monthly trend analysis for spend, CPC & revenue
✅ Interactive slicers for region, time, brand & objectives
✅ Clean, executive-ready visuals
✅ Fully customizable layout and KPIs
No complex setup. No coding. Just plug in data and analyze.
🛠️ How to Use the Brand Management Dashboard
1️⃣ Connect or import your brand/marketing data
2️⃣ Refresh the Power BI dashboard
3️⃣ Use slicers to filter by region, brand, product, or campaign
4️⃣ Evaluate KPIs like CPA, CPM, spend & revenue
5️⃣ Identify high-performing and underperforming brands
6️⃣ Use insights for budget planning and strategy reviews
This dashboard is designed so even non-technical users can operate it confidently.
👥 Who Can Benefit from This Dashboard
This dashboard is perfect for:
✔ Brand Managers
✔ Marketing & Digital Marketing Teams
✔ CMOs & Marketing Directors
✔ Product Managers
✔ Business Analysts
✔ Growth & Performance Teams
✔ Senior Leadership & Strategy Teams
Whether you manage one brand or multiple brands, this dashboard scales easily with your business.
💡 Why This Dashboard Is a Game-Changer
✅ Eliminates manual reports
✅ Improves marketing ROI visibility
✅ Helps control ad spending
✅ Connects brand preference with revenue
✅ Enables faster, smarter decisions
✅ Provides leadership-ready insights
Simply put, this dashboard turns brand data into actionable intelligence.
### 📘 Click here to read the Detailed blog post
🎥 Visit our YouTube channel to learn step-by-step video tutorials
👉 Youtube.com/@PKAnExcelExpert


Reviews
There are no reviews yet.