

Brand Consulting Dashboard in Power BI is a powerful, ready-to-use Power BI dashboard template designed for brand consultants, marketing agency owners, strategy professionals, and consulting firms who need instant visibility into project fees, profitability, service analysis, regional insights, and consultant performance. This interactive Power BI dashboard includes 5 dedicated analysis pages that track key metrics including Total Project Fee, Total Cost, Profit, Total Records, and Profit Margin% — giving you complete visibility into your brand consulting operations at a glance.
Whether you are a Brand Consultant, Marketing Director, Agency Owner, or Strategy Lead, this ready-to-use template lets you analyze service type distribution, track profit margins by consultant, compare project fees across industries, and monitor regional performance — all from a single Power BI file that refreshes instantly when you update your data source. Explore more Power BI Dashboard Templates from our collection.
🔑 Key Features of Brand Consulting Dashboard in Power BI
📊 5 Interactive Dashboard Pages — Overview, Service Analysis, Regional Insights, Consultant Performance, and Project Tracking provide multi-dimensional analysis of your brand consulting projects in a single Power BI file.
📈 5 KPI Cards on Overview Page — Total Project Fee, Total Cost, Profit, Total Records, and Profit Margin% provide a high-level executive summary instantly.
🎛 Multiple Slicers for Quick Filtering — Apply filters across all pages to instantly drill down into specific industries, service types, regions, consultants, or time periods.
💰 Project Fee vs Cost Comparison — Compare Total Project Fee and Total Cost by Month Name to identify revenue trends and cost patterns across your consulting engagements.
🏢 Industry-Level Revenue Analysis — Understand which industries generate the highest project fees and where your consulting revenue is concentrated.
👥 Consultant Performance Tracking — Monitor Total Deliverables, Profit Margin%, and Total Hours by individual consultant to evaluate team productivity and profitability.
🌐 Regional Insights Module — Analyze Total Project Fee by Region, Total Records by Region, and Completed Count by Region to understand geographic performance distribution.
🔄 Instant Data Refresh — Simply update your data source and click Refresh to see every chart and visual update instantly in Power BI Desktop.
⚡ No Coding Required — Designed for immediate use by anyone familiar with Power BI Desktop — just open the .pbix file, connect your data, and start analyzing.
📦 What’s Inside the Brand Consulting Dashboard in Power BI
This Power BI dashboard template includes 5 page tabs designed for comprehensive brand consulting tracking and analysis:
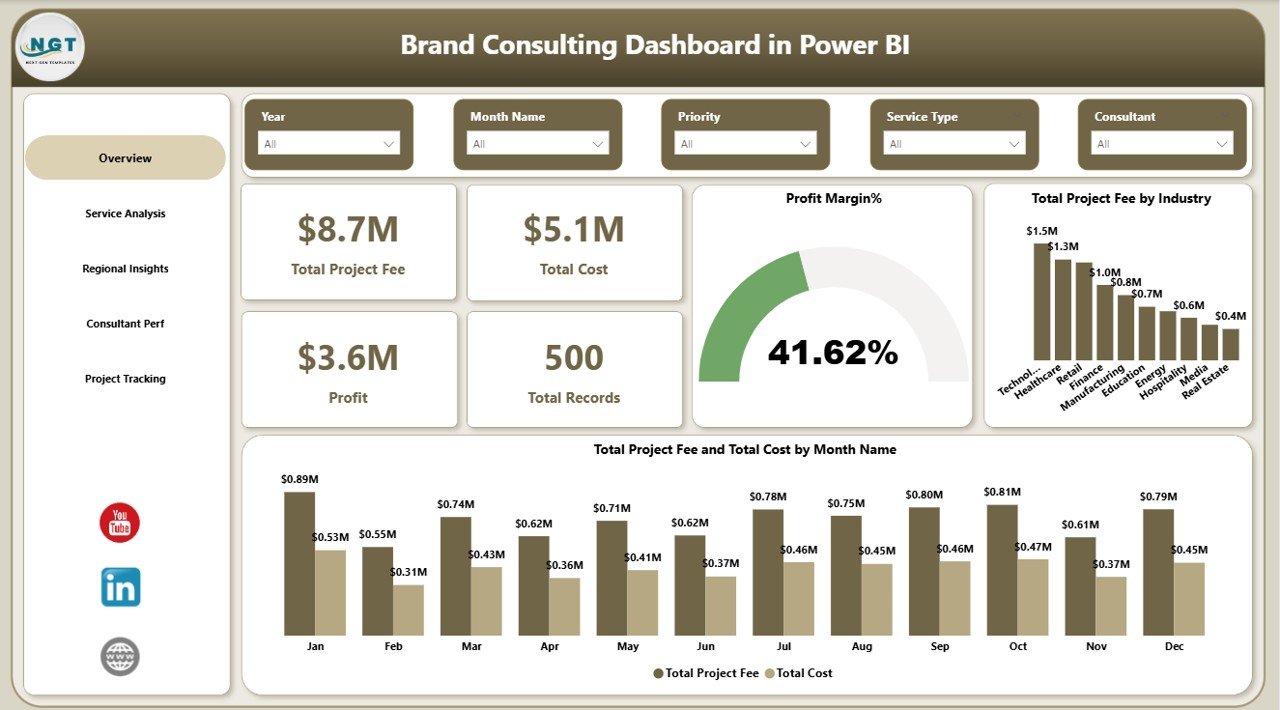
📊 1 — Overview Page — Displays 5 KPI cards (Total Project Fee, Total Cost, Profit, Total Records, Profit Margin%) along with charts showing Total Project Fee by Industry and Total Project Fee and Total Cost by Month Name. Multiple slicers allow instant filtering across all dimensions.
 Brand Consulting Dashboard in Power BI
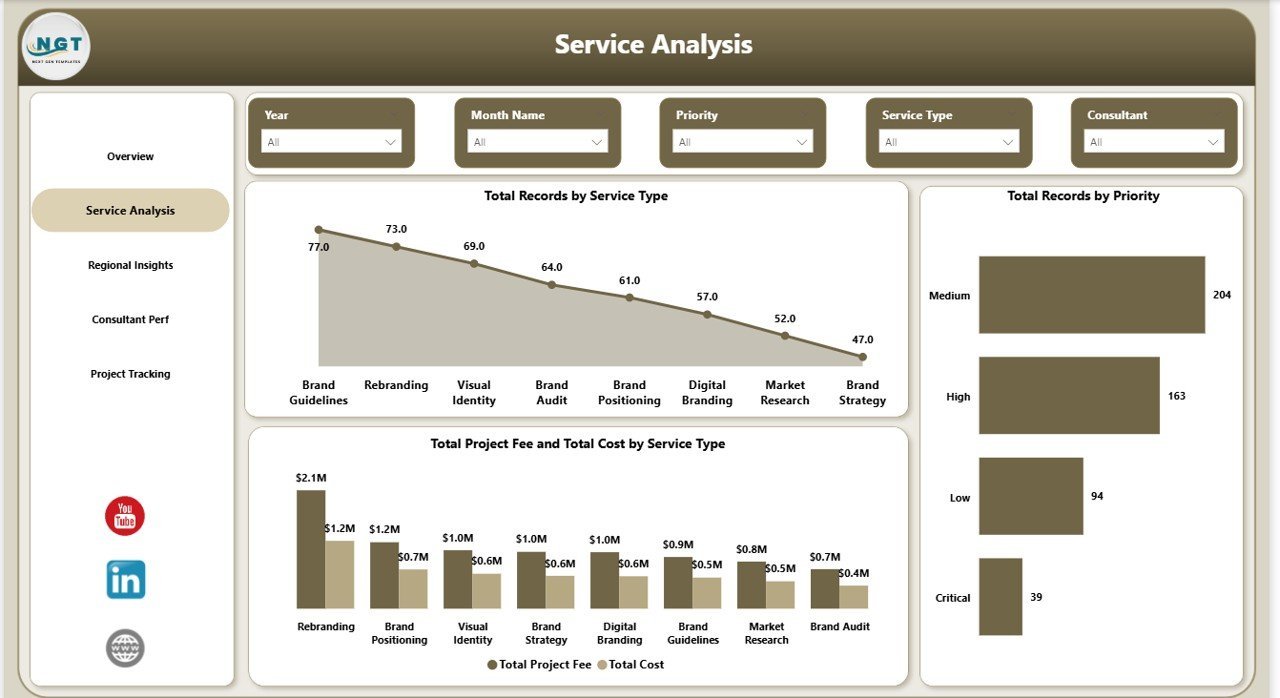
📋 2 — Service Analysis — Deep dive into service-level metrics showing Total Records by Service Type, Total Records by Priority, and Total Project Fee and Total Cost by Service Type. This page helps you understand which services drive the most engagements and where costs are highest relative to revenue.
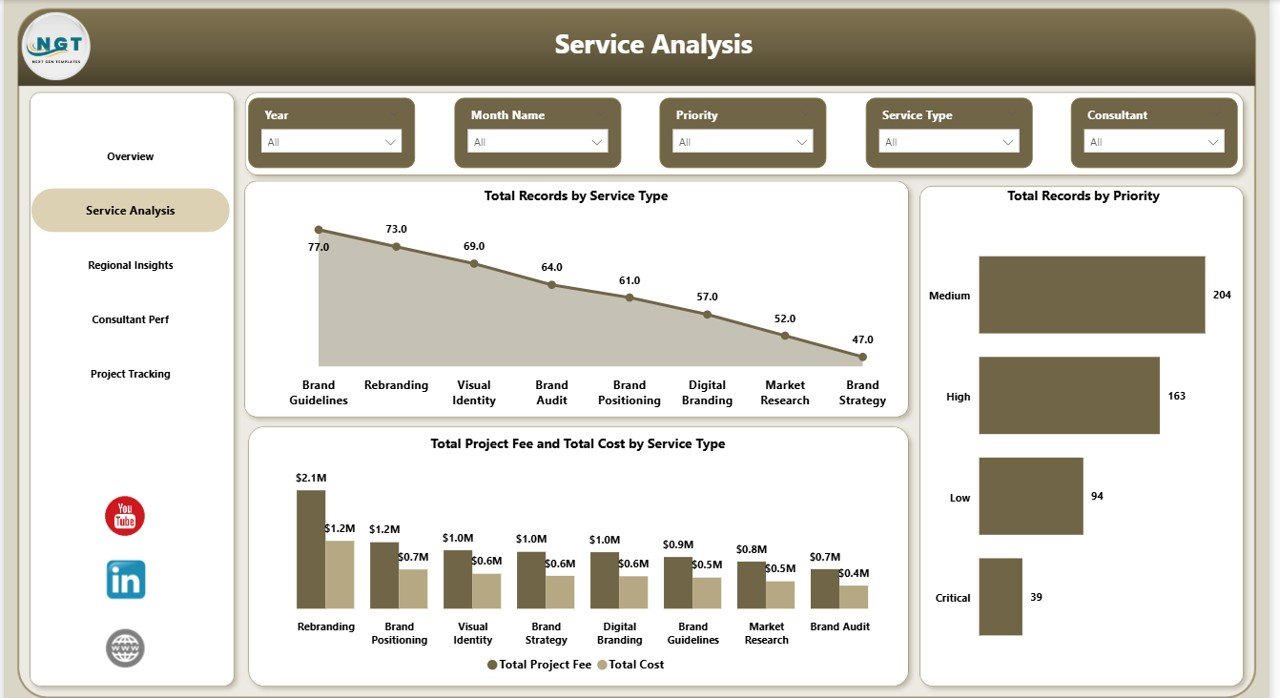 Service Analysis
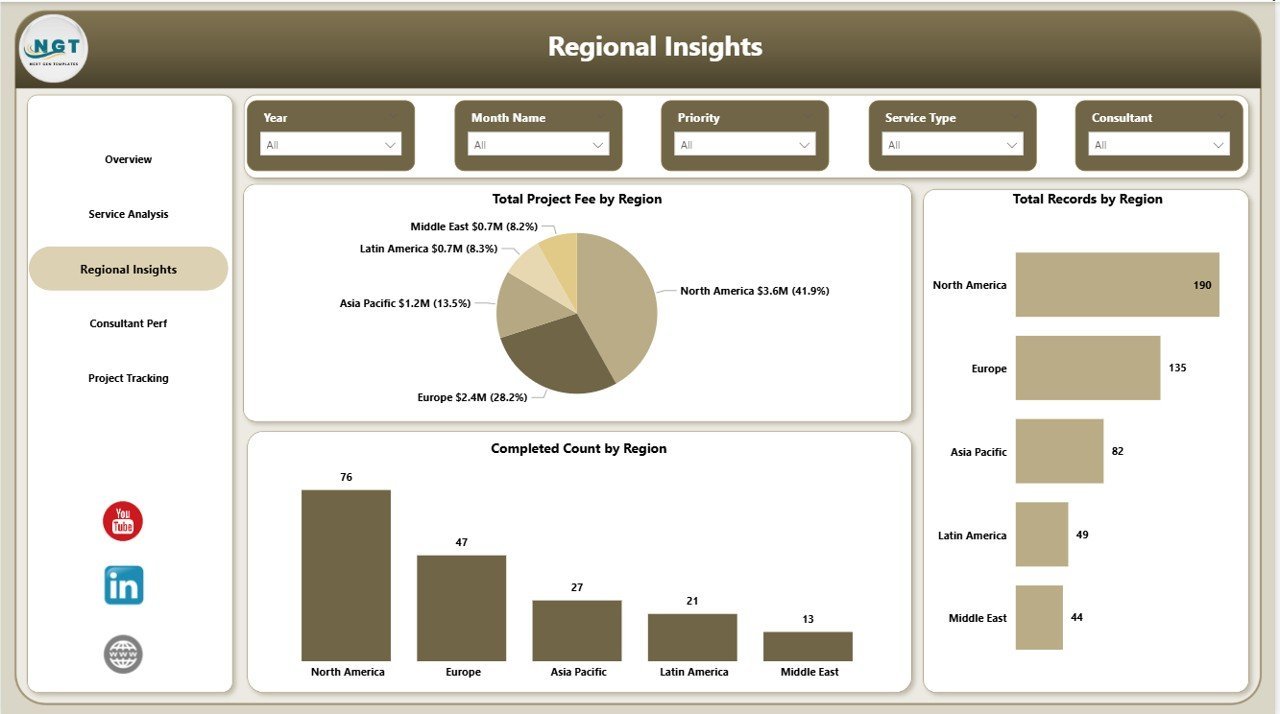
🌍 3 — Regional Insights — Geographic performance analysis featuring Total Project Fee by Region, Total Records by Region, and Completed Count by Region. Quickly spot which regions generate the most revenue and which have the highest project completion rates.
 Regional Insights
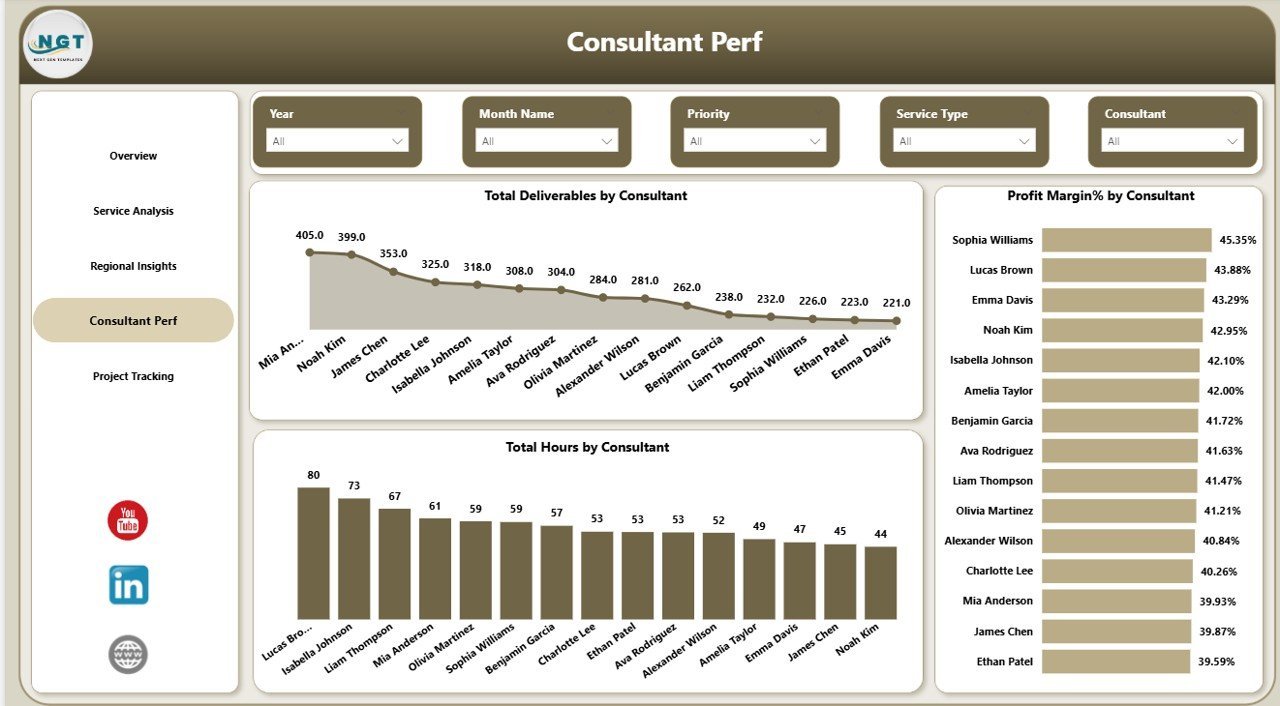
👨💼 4 — Consultant Performance — Track team productivity with Total Deliverables by Consultant, Profit Margin% by Consultant, and Total Hours by Consultant. Evaluate which consultants deliver the highest profitability and productivity across your team.
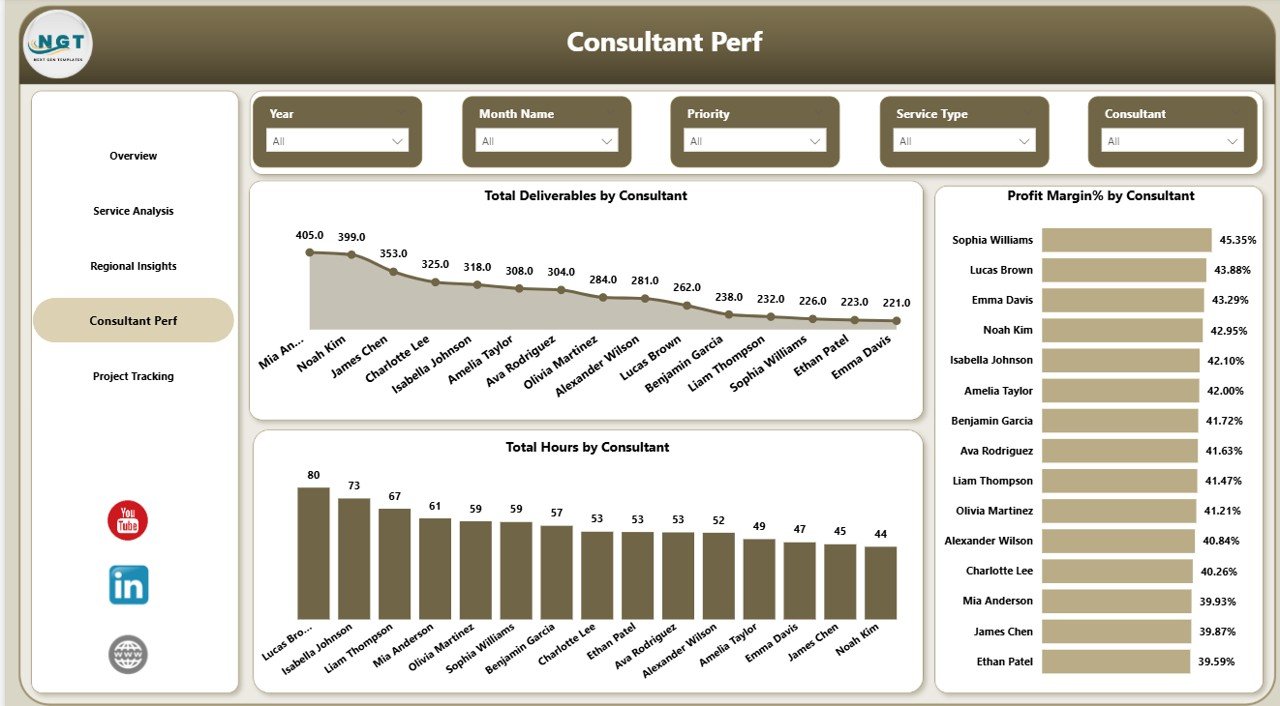 Consultant Performance
📅 5 — Project Tracking — Monitor project lifecycle metrics including Total Project Fee by Project Phase, Total Records by Project Phase, and Profit by Project Phase. Use this page to evaluate which project phases are most profitable and where bottlenecks may exist.
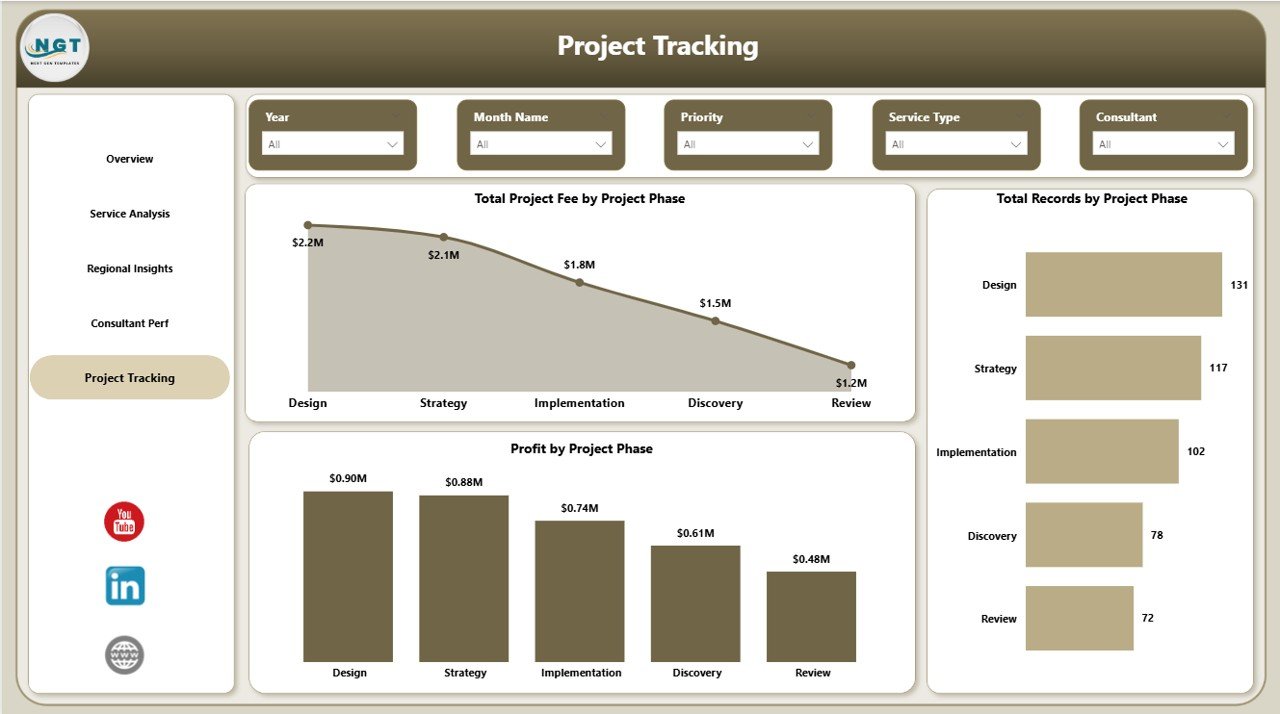 Project Tracking
⚙️ How to Use the Brand Consulting Dashboard in Power BI
1️⃣ Download and Open — Unzip the file and open the .pbix file in Power BI Desktop (free download from Microsoft).
2️⃣ Connect Your Data Source — Replace the sample data with your own brand consulting project data in the connected Excel or CSV file.
3️⃣ Refresh the Dashboard — Go to Home tab and click Refresh to update all visuals instantly.
4️⃣ Explore Dashboard Pages — Navigate through Overview, Service Analysis, Regional Insights, Consultant Performance, and Project Tracking for complete insights.
5️⃣ Apply Slicers — Filter by industry, service type, region, consultant, or project phase to focus on specific areas.
6️⃣ Present to Stakeholders — Share insights with leadership and clients directly from Power BI.
👥 Who Can Benefit from This Brand Consulting Dashboard in Power BI
🎯 Brand Consultants — Track project fees, profitability, and service performance across all client engagements.
🏢 Marketing Agency Owners — Monitor agency revenue, regional distribution, and consultant utilization.
📊 Marketing Directors — Get a high-level overview of service performance and project phase profitability.
💼 Strategy Leads — Analyze service type distribution, profit margins, and regional insights for strategic planning.
📋 Project Managers — Track project phases, consultant hours, and deliverables across regions and service types.
🧑💻 Freelance Brand Strategists — Manage multiple client engagements and monitor project fee vs cost analysis in a professional Power BI dashboard.
❓ Frequently Asked Questions
What KPIs does the Brand Consulting Dashboard in Power BI track?
The Brand Consulting Dashboard in Power BI tracks 5 key performance indicators on the overview page: Total Project Fee, Total Cost, Profit, Total Records, and Profit Margin%. Additional metrics across 5 analysis pages include Total Project Fee by Industry, Fee vs Cost by Month, Records by Service Type, Records by Priority, Fee by Region, Completed Count by Region, Deliverables by Consultant, Hours by Consultant, Profit Margin% by Consultant, Fee by Project Phase, and Profit by Project Phase.
Do I need advanced Power BI skills to use this dashboard?
No. Simply open the .pbix file in Power BI Desktop, replace the sample data with your own, and click Refresh. All charts and visuals update automatically with zero coding required.
Can I customize this brand consulting dashboard with my own data?
Yes. Replace the sample data in the connected data source file with your own consulting engagement records. Then click Refresh in Power BI Desktop and all 5 dashboard pages will update automatically with your data.
Is this template suitable for marketing agencies managing multiple clients?
Absolutely. The Brand Consulting Dashboard includes dedicated pages for Service Analysis, Regional Insights, and Consultant Performance that let you track metrics across multiple clients, regions, and team members simultaneously. The slicer filters make it easy to isolate data for specific service types or consultants.
What is the best Power BI dashboard template for brand consulting?
The Brand Consulting Dashboard in Power BI from NextGenTemplates is the best Power BI dashboard template for brand consulting professionals. It includes 5 interactive analysis pages, multiple charts, 5 KPI cards, slicer filters, and dedicated pages for service analysis, regional insights, consultant performance, and project tracking.
🔗 Explore Related Templates
📊 Brand Consulting Dashboard in Excel — Track brand consulting project fees, profitability, and consultant performance with pivot-powered charts and slicers in Excel.
📊 Cloud Migration Services Dashboard in Power BI — Track cloud migration projects, budgets, and platform performance in Power BI.
📊 Financial Auditing Dashboard in Power BI — Monitor audit progress, risk findings, and compliance performance in Power BI.
Browse all Power BI Dashboard Templates on NextGenTemplates.
📖 Click here to read the Detailed Blog Post
Watch the step-by-step video tutorial:


Reviews
There are no reviews yet.