The global energy industry is rapidly shifting toward renewable and sustainable energy sources. Biofuels are playing a critical role in reducing carbon emissions, improving energy security, and supporting clean fuel initiatives across the world. However, managing production data, plant performance, feedstock utilization, and revenue analysis can quickly become overwhelming when organizations rely on scattered spreadsheets or manual reports.
Energy companies often struggle to monitor production capacity, analyze plant efficiency, and track revenue trends in real time. Without a centralized analytics system, decision-makers face delays in identifying operational issues and optimizing production strategies.
This is exactly where the Biofuels Dashboard in Power BI becomes extremely powerful.
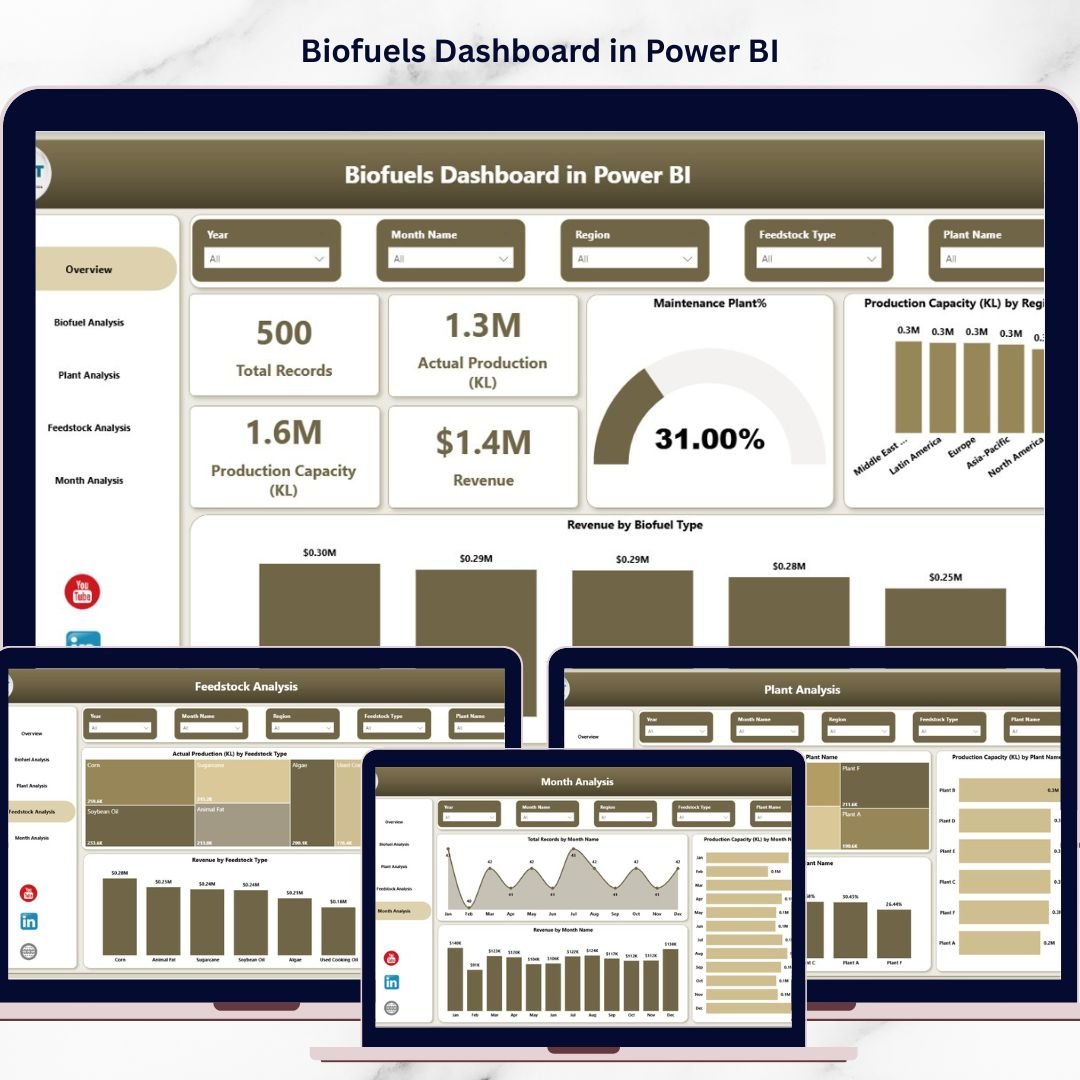
The Biofuels Dashboard in Power BI is a professionally designed, ready-to-use analytics solution that helps renewable energy companies monitor biofuel production performance, evaluate plant efficiency, analyze feedstock productivity, and track revenue trends in an interactive dashboard environment.
Because Power BI offers advanced data visualization, filtering, and drill-down capabilities, this dashboard transforms complex production data into easy-to-understand insights that support faster and smarter decision-making.
The dashboard includes five powerful analytical pages that provide a complete overview of biofuel operations, helping organizations identify production trends, improve efficiency, and maximize profitability.
🚀 Key Feature of Biofuels Dashboard in Power BI
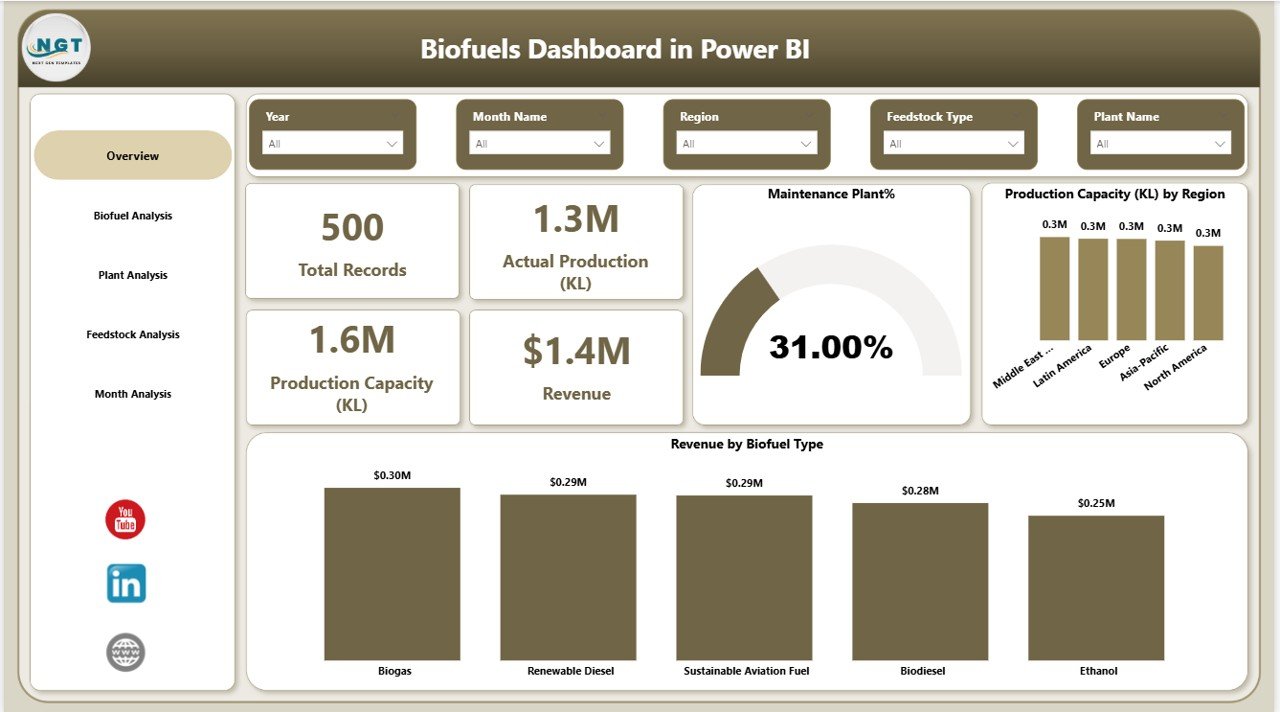
📊 Interactive Overview Dashboard
Monitor critical production KPIs such as total records, actual production, production capacity, revenue, and operational plants percentage.
🌍 Regional Production Capacity Insights
Understand how production capacity is distributed across different regions to evaluate operational efficiency.
💰 Revenue Performance Analysis
Track revenue generated from different biofuel types to identify the most profitable products.
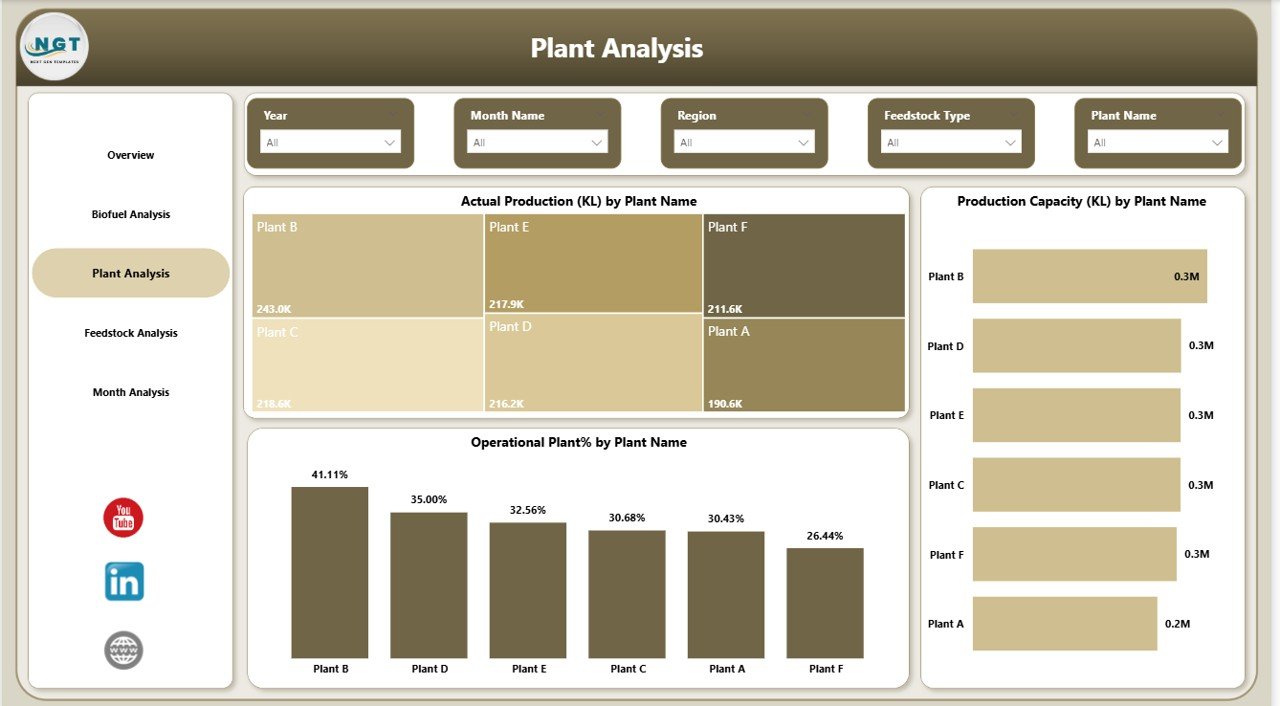
🏭 Plant Performance Monitoring
Analyze production output, plant capacity utilization, and operational efficiency for each biofuel production facility.
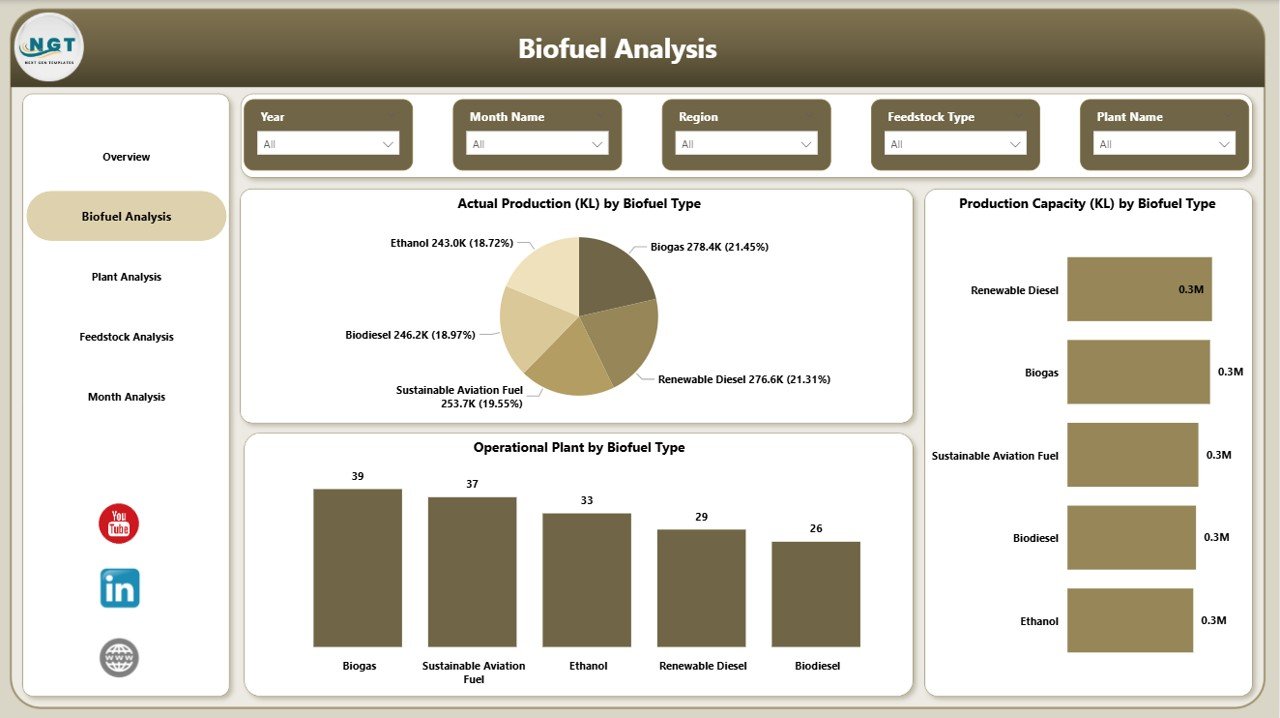
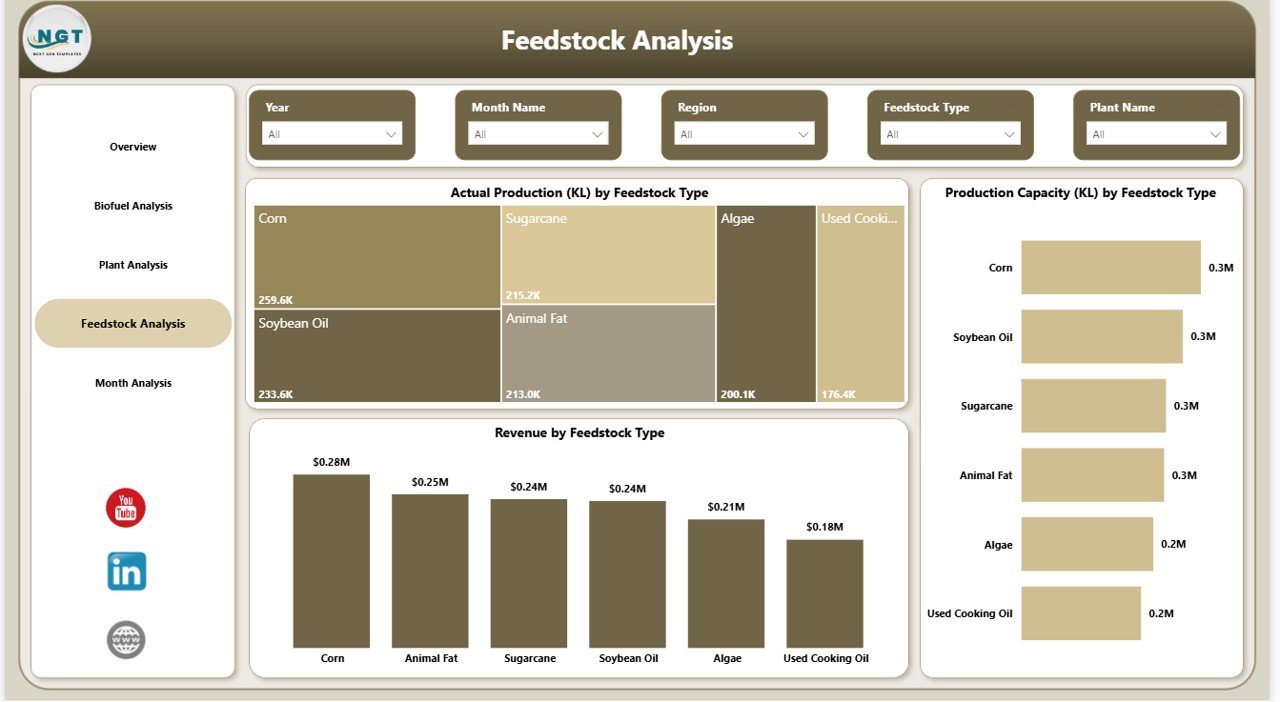
🌱 Feedstock Efficiency Analysis
Evaluate how different feedstocks impact production levels and revenue performance.
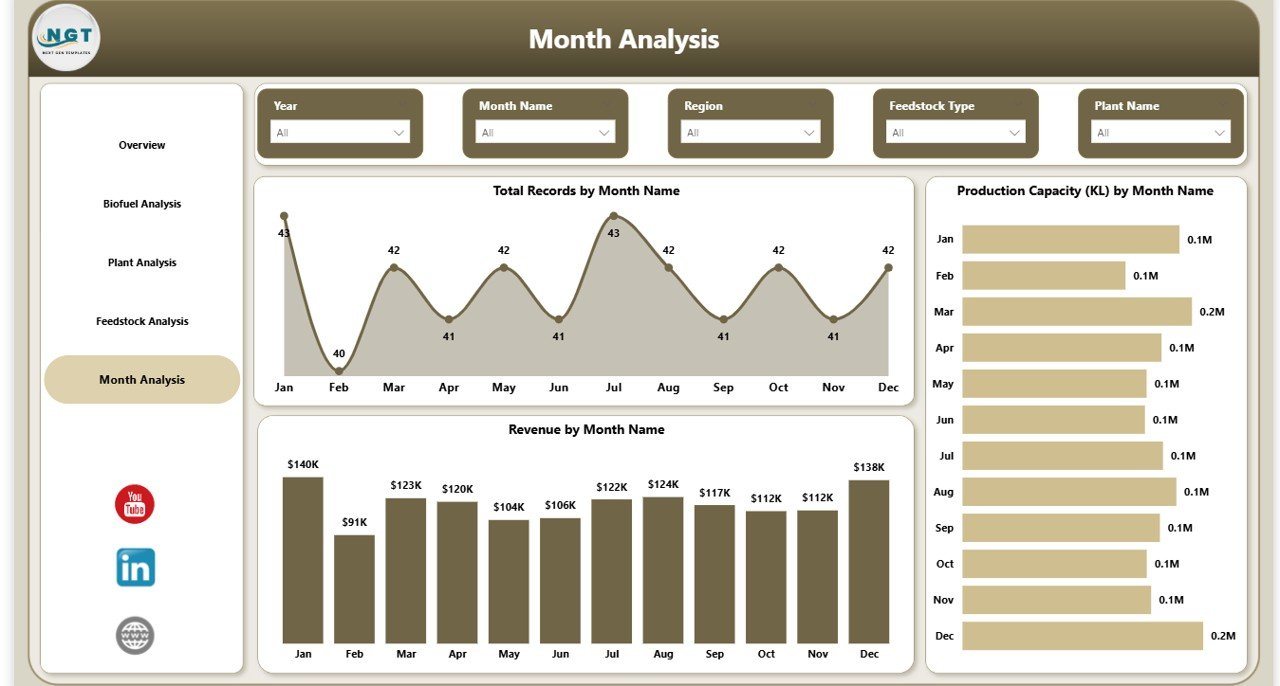
📈 Monthly Production Trend Analysis
Identify seasonal patterns in production capacity, revenue generation, and operational activity.
🔍 Interactive Filtering and Drill-Down Analysis
Use Power BI slicers and filters to analyze data by region, plant, biofuel type, and feedstock.
⚡ Fast and Automated Reporting
Eliminate manual reporting and generate professional production insights instantly.
📦 What’s Inside the Biofuels Dashboard in Power BI
This Power BI dashboard contains five interactive analytical pages designed to provide complete operational visibility.
Overview Page
Displays high-level KPIs and charts including revenue by biofuel type, production capacity by region, operational plant percentage, and maintenance plant statistics.
Biofuel Analysis Page
Compares production volume and production capacity across different biofuel categories such as ethanol, biodiesel, and renewable diesel.
Plant Analysis Page
Provides plant-level insights including production output, production capacity, and operational efficiency for each facility.
Feedstock Analysis Page
Analyzes how feedstocks influence production capacity and revenue performance.
Monthly Analysis Page
Tracks production trends, operational records, and revenue performance over time.
These analytical views provide a complete operational picture of biofuel production performance.
⚙️ How to Use the Biofuels Dashboard in Power BI
Using the dashboard is simple and efficient.
1️⃣ Import your production dataset into Power BI.
2️⃣ Load the dashboard template into Power BI Desktop.
3️⃣ Connect your dataset with the dashboard model.
4️⃣ Use filters and slicers to analyze data by region, plant, feedstock, or biofuel type.
5️⃣ Monitor production performance and revenue insights through interactive visualizations.
Within minutes, organizations can convert raw operational data into meaningful insights.
👥 Who Can Benefit from This Biofuels Dashboard in Power BI
This dashboard is highly valuable for multiple stakeholders in the renewable energy ecosystem.
🏭 Biofuel Manufacturers
Monitor production performance, plant efficiency, and revenue growth.
👨🏭 Plant Managers
Track individual plant performance and detect operational bottlenecks.
📊 Operations Teams
Analyze feedstock utilization, production capacity, and operational efficiency.
💰 Financial Analysts
Evaluate revenue trends and profitability across biofuel categories.
🏛 Government Agencies
Monitor renewable fuel production data and industry performance.
📈 Energy Consultants and Analysts
Provide strategic insights using interactive production analytics.
Click here to read the Detailed blog post
Watch the step-by-step video tutorial:


