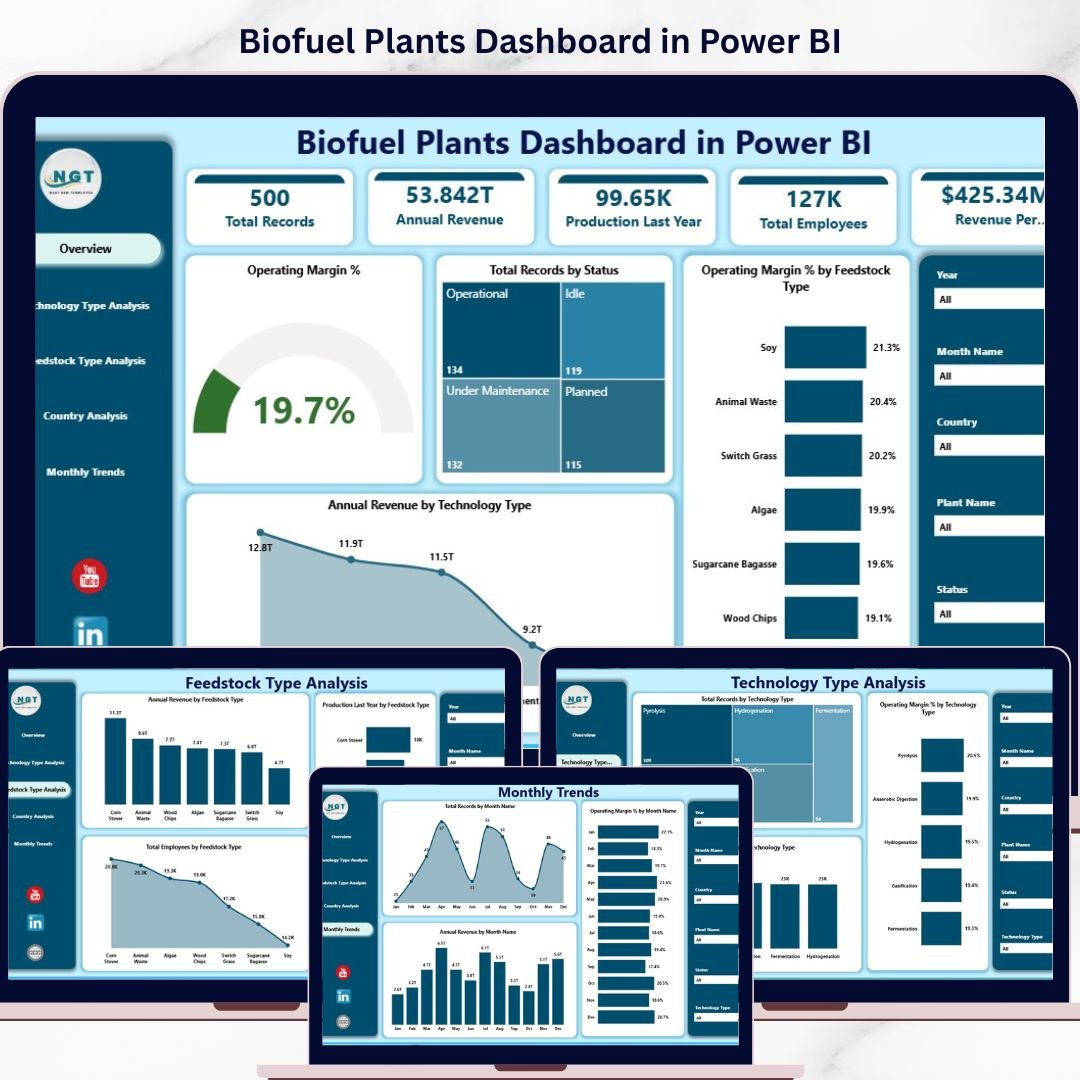
Step into the future of renewable energy analytics with the Biofuel Plants Dashboard in Power BI 🚀. In today’s fast-evolving biofuel industry, managing data across production, revenue, workforce, feedstock, and technology can be overwhelming.
However, this powerful and ready-to-use dashboard transforms your operations. It converts complex data into interactive visuals, real-time insights, and actionable intelligence—all in one place.
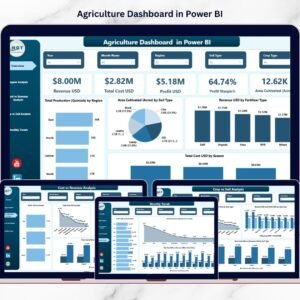
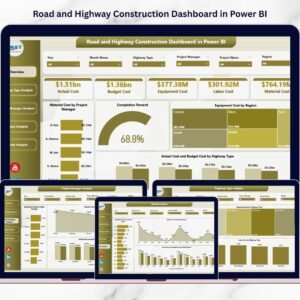
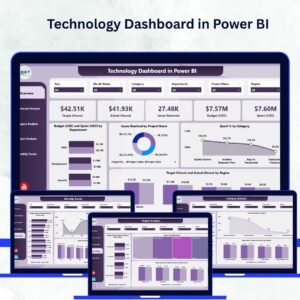
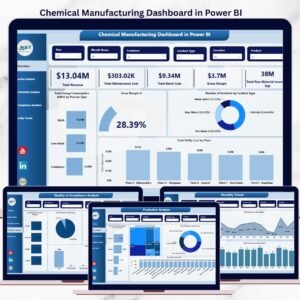
With this dashboard, you can track operating margins, revenue, production performance, and resource utilization effortlessly. As a result, you can make faster, smarter, and data-driven decisions to optimize plant efficiency and profitability.
🚀 Key Feature of Biofuel Plants Dashboard in Power BI
✅ 📊 Interactive Power BI Dashboard
Analyze biofuel data using dynamic charts, KPIs, and slicers.
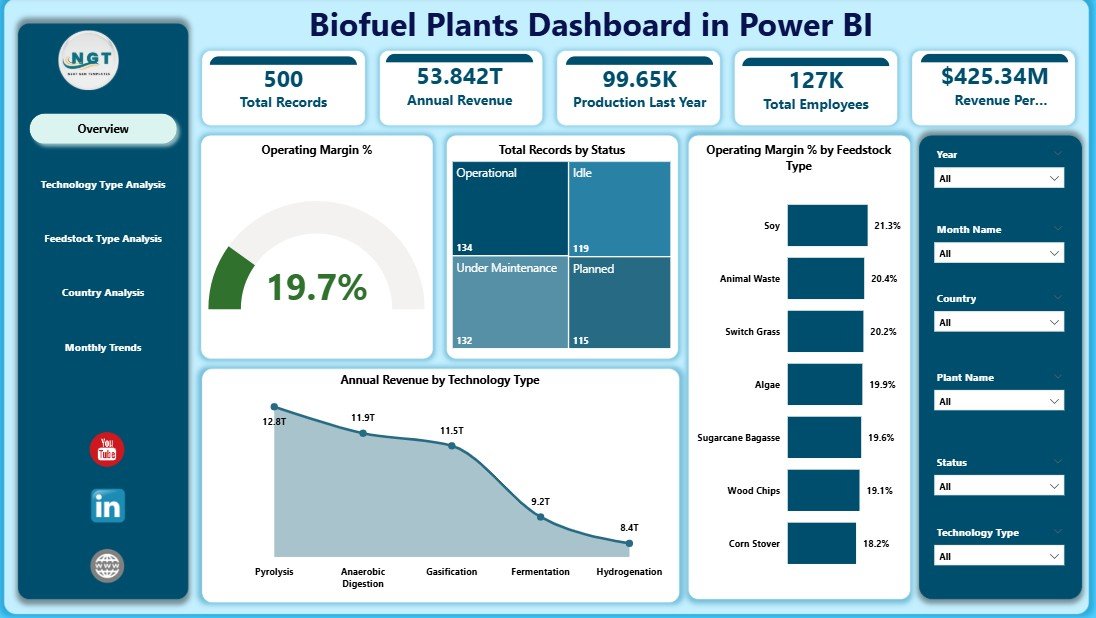
✅ 📈 Complete KPI Tracking
Track operating margin %, revenue, production, and workforce.
✅ 📅 Multi-Page Analytical Dashboard
Explore insights across 5 structured pages for deep analysis.
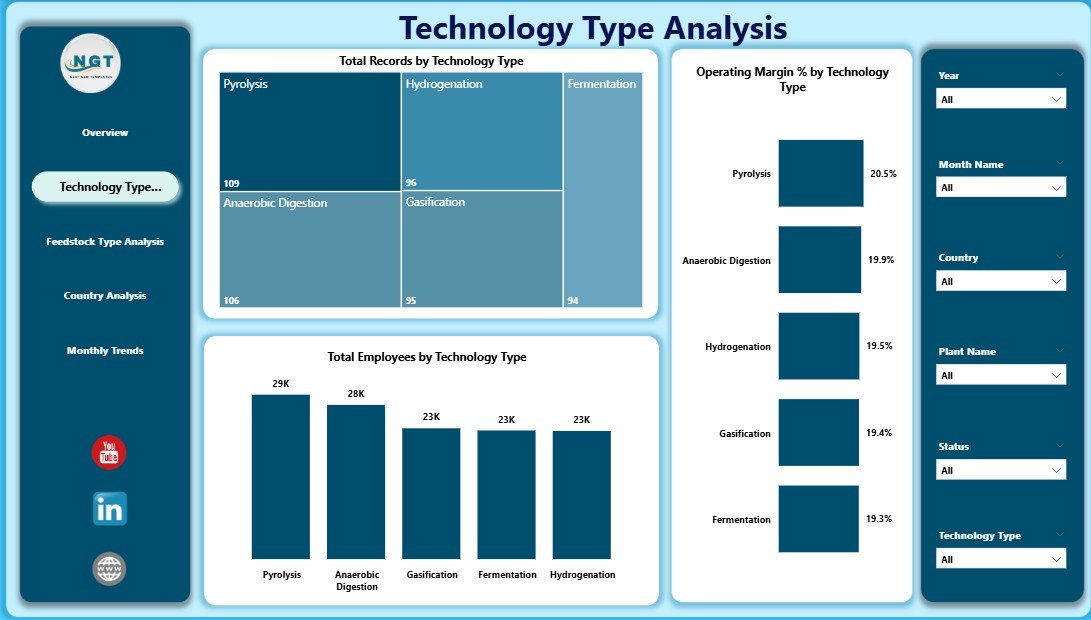
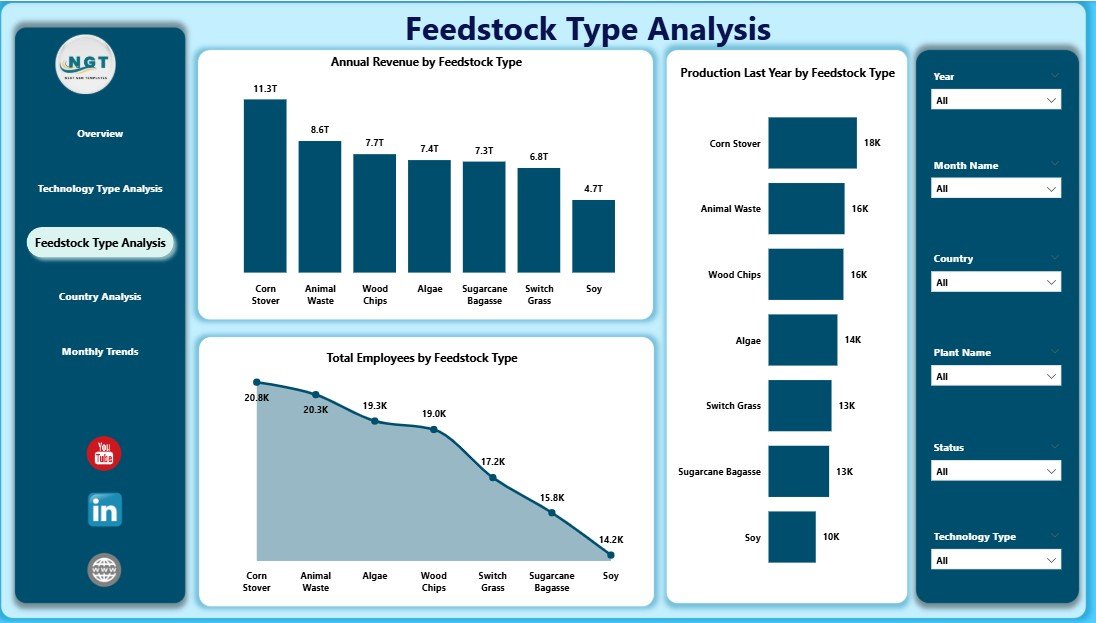
✅ 🌾 Feedstock & Technology Insights
Evaluate performance across feedstock types and technologies.
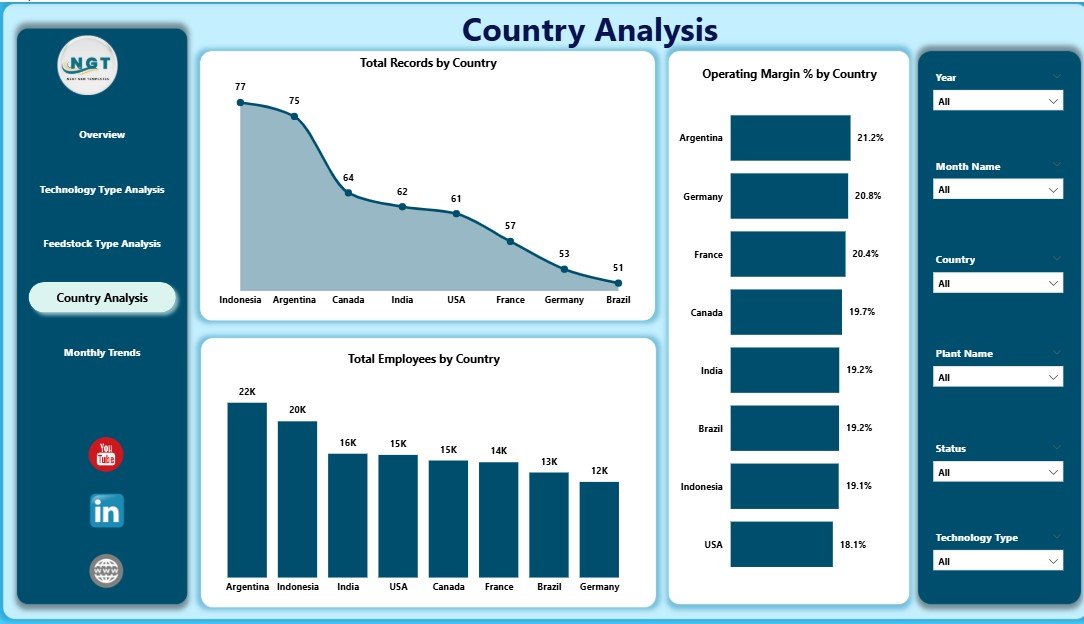
✅ 🌍 Country-Level Analysis
Compare plant performance across different regions.
✅ ⚡ Real-Time Data Visualization
Get instant updates for faster decision-making.
📦 What’s Inside the Biofuel Plants Dashboard in Power BI
This dashboard includes 5 powerful analytical pages:
📊 Overview Page – Snapshot of KPIs with performance cards and slicers
⚙️ Technology Type Analysis – Evaluate efficiency across technologies
🌾 Feedstock Type Analysis – Analyze raw material performance
🌍 Country Analysis – Compare regional plant performance
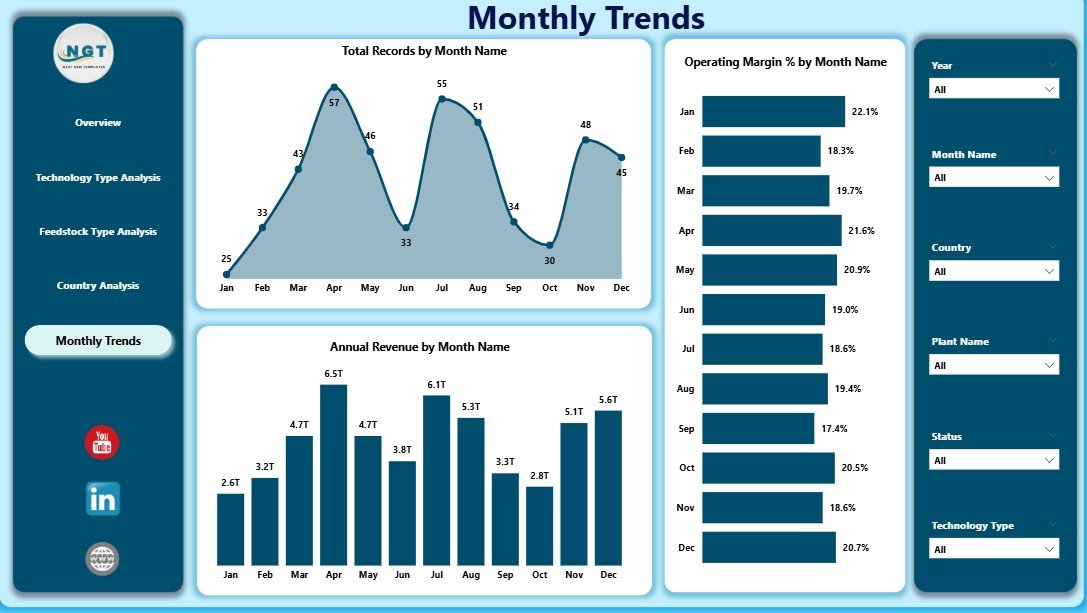
📅 Month Analysis – Track trends and growth over time
Each page is designed to give you a complete 360° view of biofuel operations.
⚙️ How to Use the Biofuel Plants Dashboard in Power BI
Getting started is simple:
👉 Import your data into Power BI
👉 Connect and refresh the dataset
👉 Use slicers to filter by technology, feedstock, or country
👉 Analyze KPI cards and charts
👉 Identify trends and take action
Within minutes, you can transform raw data into powerful operational insights 📊.
👨🔬 Who Can Benefit from This Biofuel Plants Dashboard in Power BI
This dashboard is ideal for:
🌱 Biofuel Plant Managers – Monitor plant performance
📊 Renewable Energy Analysts – Analyze trends and KPIs
⚙️ Operations Teams – Optimize production efficiency
💰 Financial Analysts – Track revenue and profitability
🏛️ Government Agencies – Monitor energy performance
Anyone involved in biofuel production and renewable energy analytics will benefit from this solution.
🔗 Click hare to read the Detailed blog post
Explore the complete guide with detailed features, benefits, and best practices.
👉 Visit our YouTube channel to learn step-by-step video tutorials:
https://youtube.com/@PKAnExcelExpert