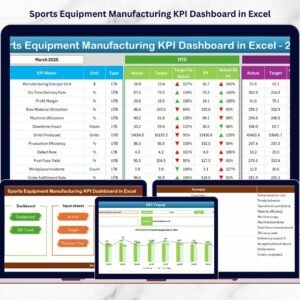
In today’s rapidly expanding energy sector, battery manufacturing companies must maintain strict control over production efficiency, quality performance, and operational costs. With the rising demand for electric vehicles, renewable energy storage, and advanced electronics, manufacturers cannot rely on outdated reporting methods anymore.Yet many organizations still manage performance using disconnected spreadsheets and manual reports. This often leads to delayed decisions, hidden inefficiencies, and missed improvement opportunities.That’s where the Battery Manufacturing KPI Dashboard in Excel becomes a game-changing solution.This ready-to-use Excel dashboard transforms complex manufacturing data into clear, interactive insights. Instead of spending hours preparing reports, managers can instantly monitor KPIs, analyze trends, and compare performance against targets — all in one centralized system.
Designed specifically for battery manufacturing operations, this dashboard enables teams to track production metrics, quality indicators, operational efficiency, and financial performance with ease.
Whether you manage electrode preparation, cell assembly, testing, or packaging operations, this dashboard helps you make faster and smarter decisions using real-time performance visibility.
🚀 Key Features of Battery Manufacturing KPI Dashboard in Excel
✅ Interactive dashboard with automated KPI tracking
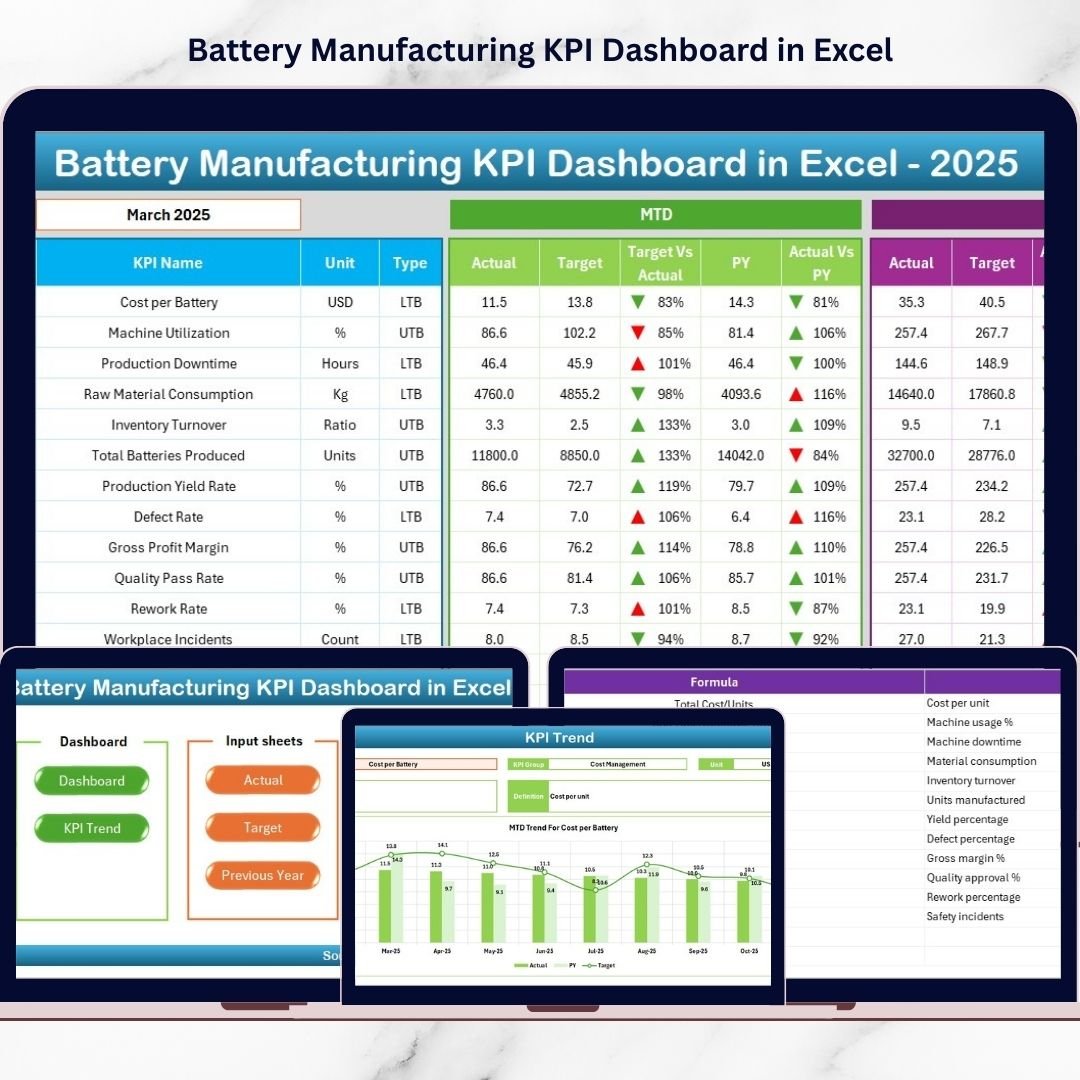
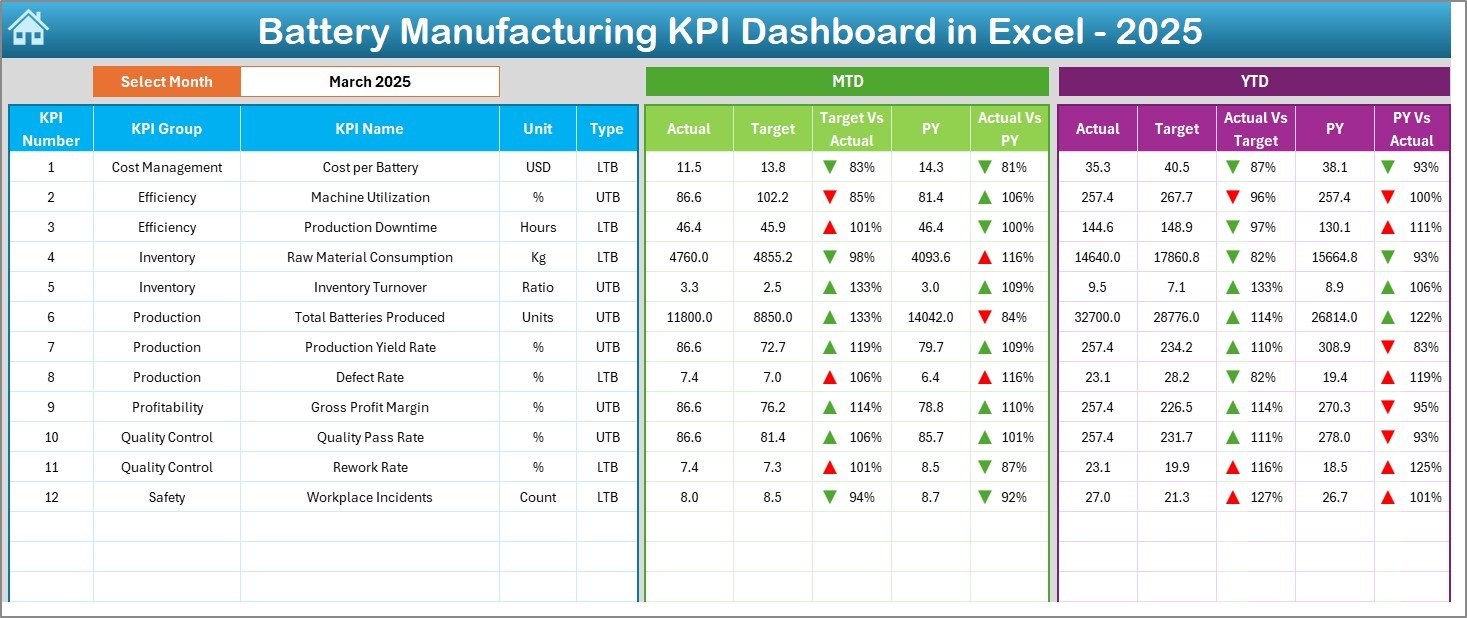
✅ MTD, YTD, Target vs Actual, and Previous Year comparisons
✅ Dynamic month selection with automatic updates
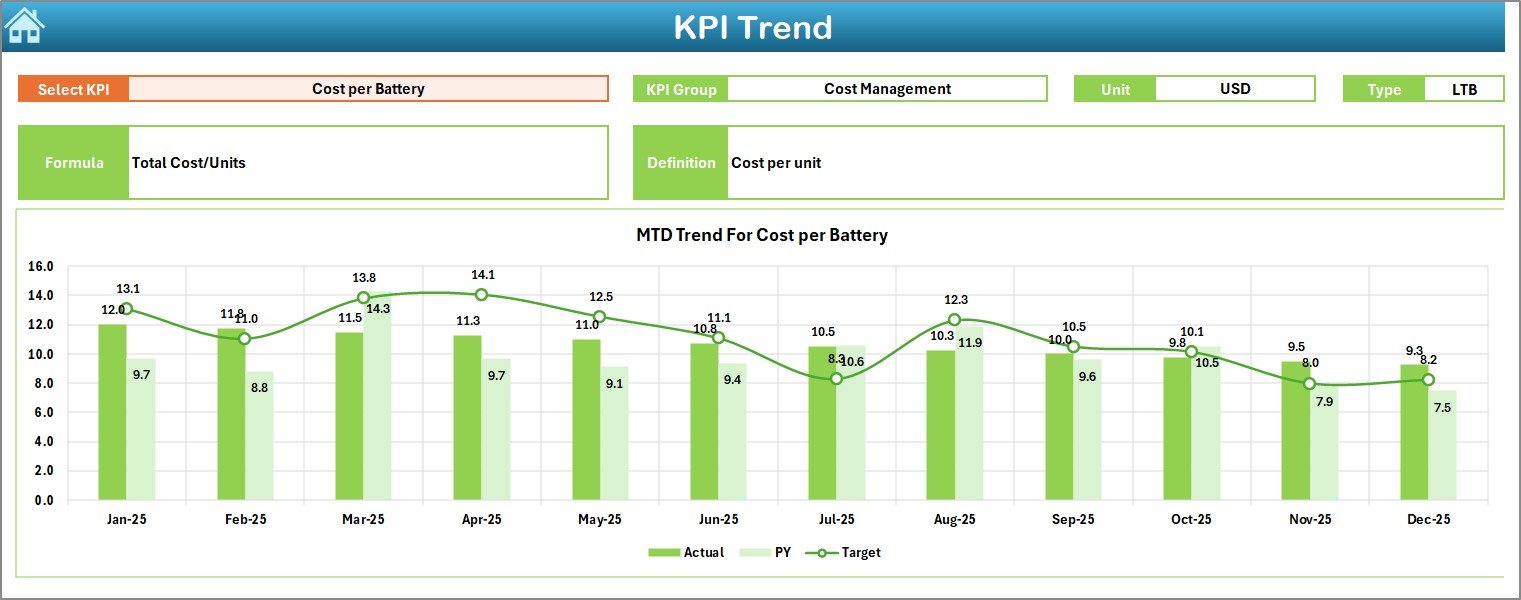
✅ KPI trend analysis with visual charts
✅ Conditional formatting indicators for performance status
✅ Structured worksheets for organized data management
✅ Centralized KPI monitoring system
✅ Easy navigation with user-friendly layout
The dashboard converts raw data into actionable insights so decision-makers can identify performance gaps instantly.
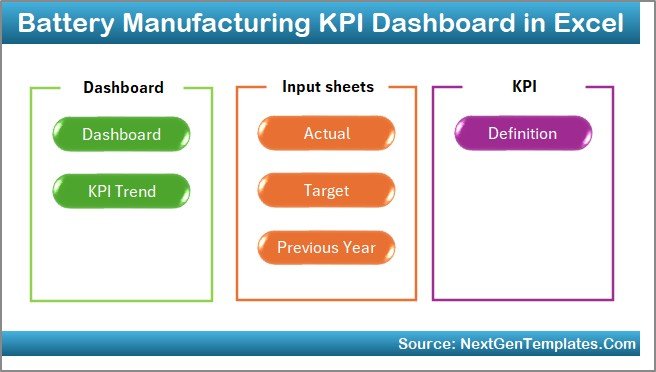
📦 What’s Inside the Battery Manufacturing KPI Dashboard in Excel
This product includes a fully structured Excel system with seven powerful worksheets:
-
Summary Page – Quick navigation hub for all dashboard sections
-
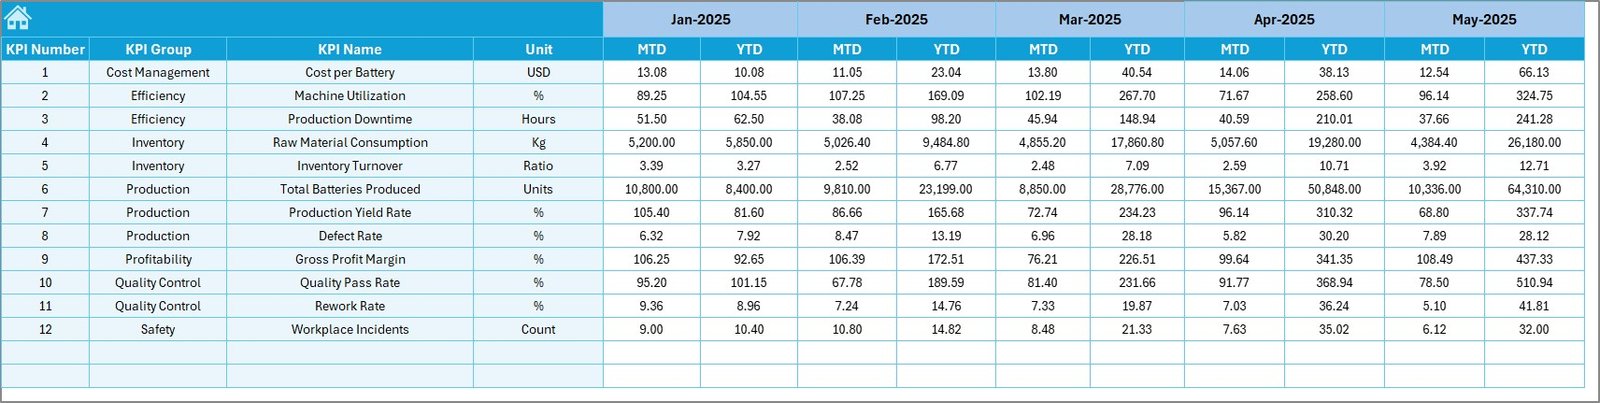
Dashboard Sheet – Central KPI performance overview
-
Trend Sheet – Detailed KPI trend and comparison analysis
-
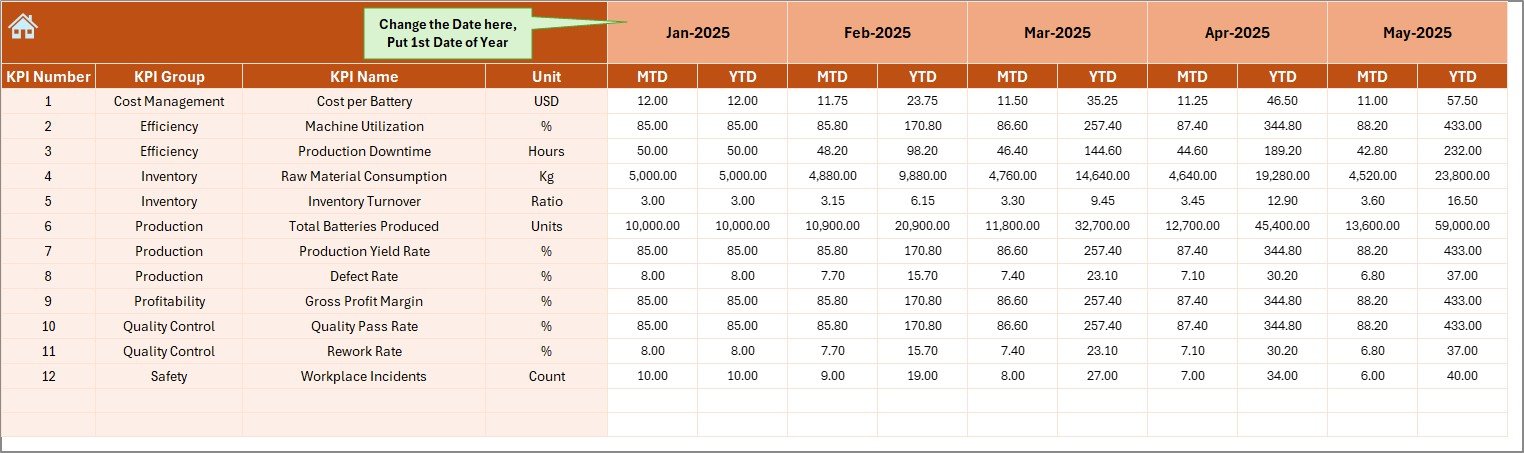
Actual Numbers Input Sheet – Organized data entry area
-
Target Sheet – Monthly performance planning and targets
-
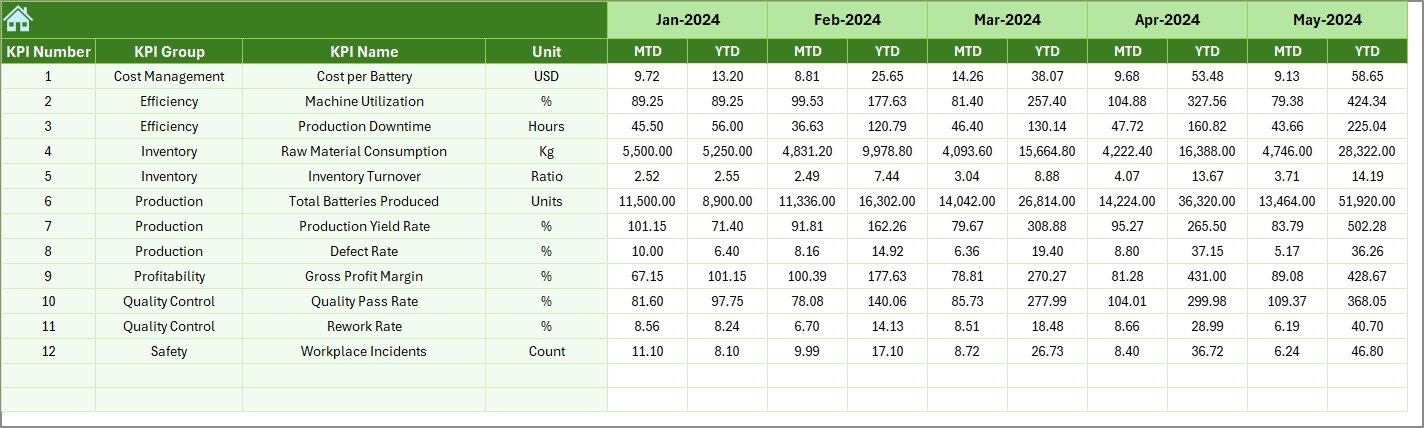
Previous Year Sheet – Historical benchmarking analysis
-
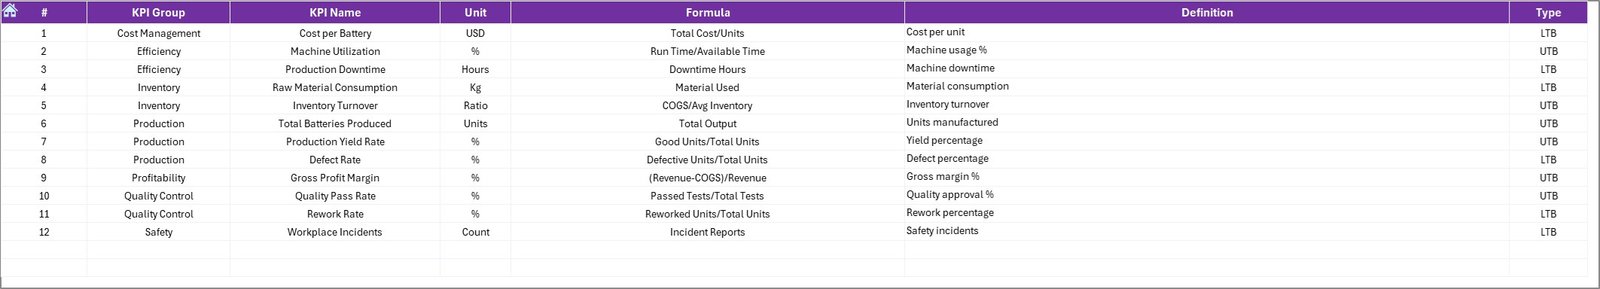
KPI Definition Sheet – Standardized KPI documentation
Together, these sheets create a complete manufacturing performance management framework.
⚙️ How to Use the Battery Manufacturing KPI Dashboard in Excel
Using this dashboard is simple and beginner-friendly:
1️⃣ Define KPIs in the KPI Definition sheet
2️⃣ Enter monthly targets in the Target sheet
3️⃣ Input actual production data in the Actual Numbers sheet
4️⃣ Add previous year performance values
5️⃣ Select the reporting month from the dropdown
Instantly, all charts, KPIs, and performance indicators update automatically — no complex setup required.
👨🏭 Who Can Benefit from This Battery Manufacturing KPI Dashboard
This dashboard is ideal for professionals across manufacturing organizations:
-
Production Managers monitoring efficiency
-
Plant Heads reviewing operational performance
-
Quality Control Teams tracking defect trends
-
Operations Analysts analyzing KPIs
-
Maintenance Managers monitoring downtime
-
Business Executives making strategic decisions
Because it combines planning, monitoring, and analysis in one place, every department gains clear performance visibility.
The Battery Manufacturing KPI Dashboard in Excel helps organizations move from reactive reporting to proactive decision-making. Instead of analyzing scattered reports, teams gain a single source of truth for manufacturing performance.
By improving visibility, reducing reporting effort, and enabling faster insights, this dashboard empowers companies to optimize productivity, control costs, and achieve operational excellence — without investing in expensive software.
If you want a smarter way to monitor battery manufacturing performance, this dashboard provides the perfect balance of simplicity and powerful analytics.
Click here to read the Detailed blog post
Watch the step-by-step video tutorial: