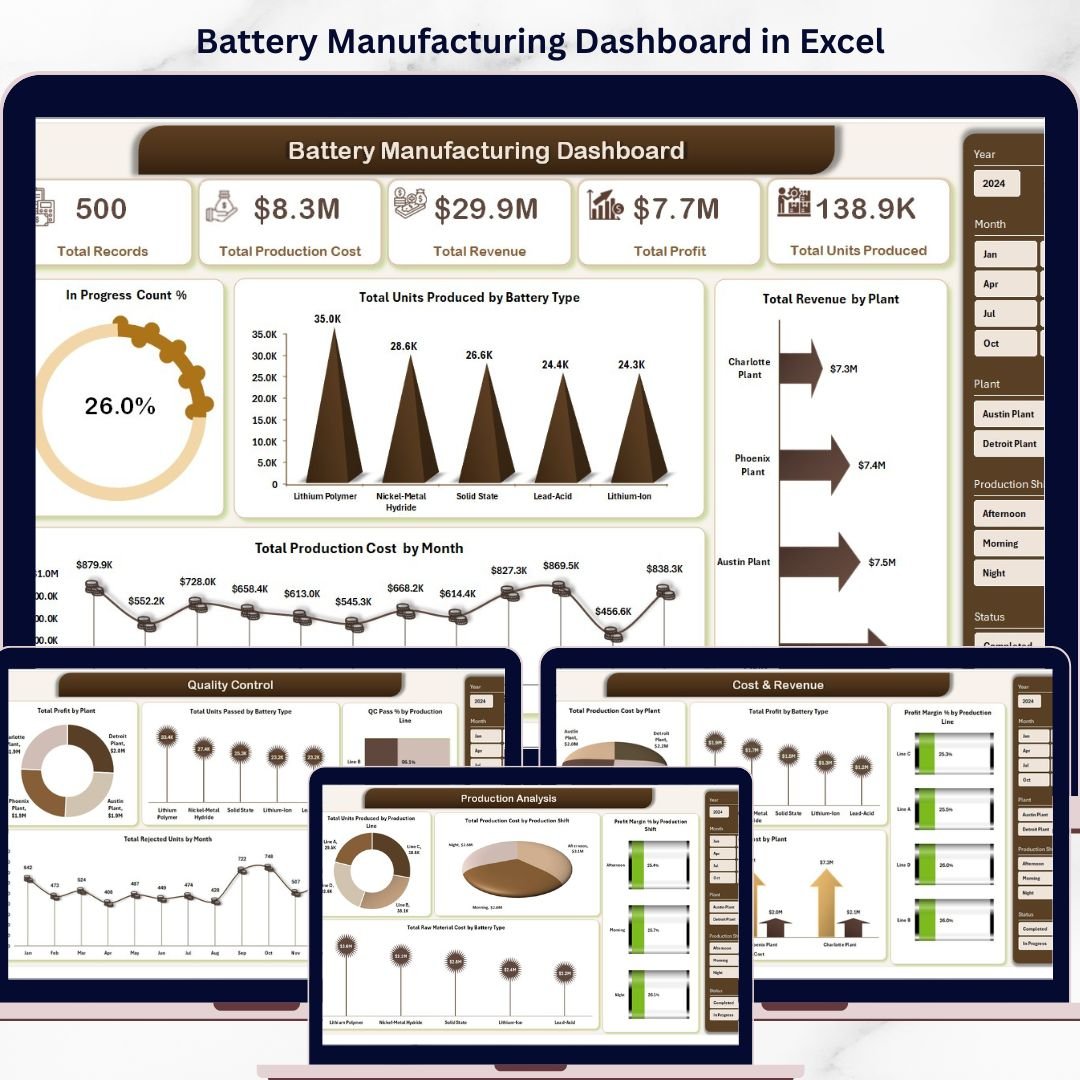


🚀 Struggling to manage complex battery manufacturing data? Turn chaos into clarity with the Battery Manufacturing Dashboard in Excel!
Managing battery production involves tracking multiple variables like production volume, cost, quality, and plant performance. However, handling all this data manually can be overwhelming and error prone. That’s exactly where this powerful and ready-to-use Battery Manufacturing Dashboard in Excel becomes your ultimate solution.
This dashboard transforms raw manufacturing data into clear, actionable insights. With just a simple data update and refresh, you can instantly monitor performance, identify bottlenecks, and optimize operations. Whether you’re managing production lines or evaluating plant efficiency, this tool gives you everything in one place.
⚡ Key Features of Battery Manufacturing Dashboard in Excel
📊 Interactive Multi-Page Dashboard – Analyze data across Overview, Production, Quality, Cost, and Plant Performance pages.
📈 Dynamic KPI Cards – Track Total Production Cost, Revenue, Profit, Units Produced, and more at a glance.
🎯 Advanced Filtering with Slicers – Drill down data by battery type, plant, shift, or production line instantly.
💡 Comprehensive Charts & Visuals – Gain insights through professionally designed charts and pivot-based visuals.
🔄 One-Click Data Refresh – Update your Data Sheet and refresh to instantly reflect new insights.
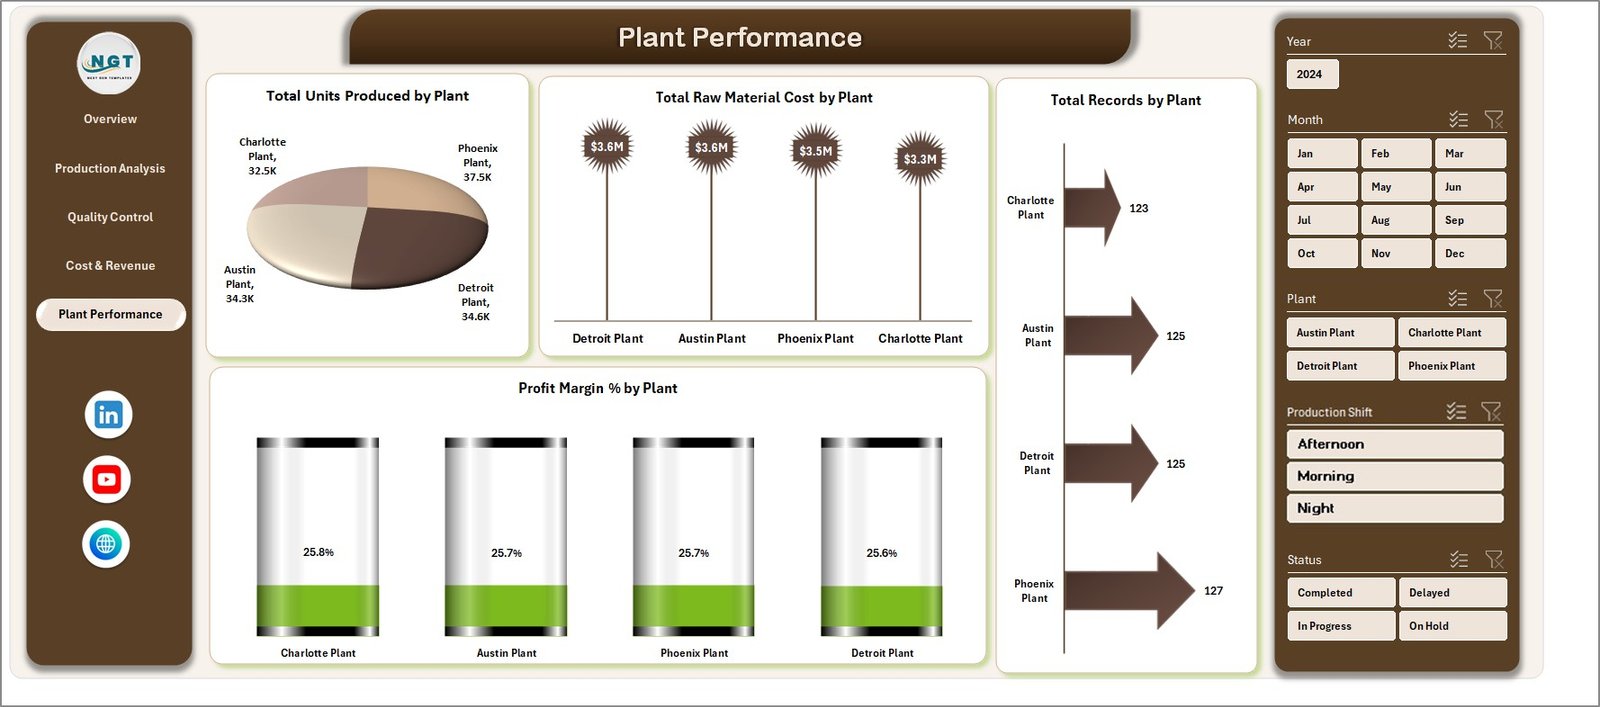
🏭 Plant-Level Performance Tracking – Compare production, cost, and profitability across multiple plants.
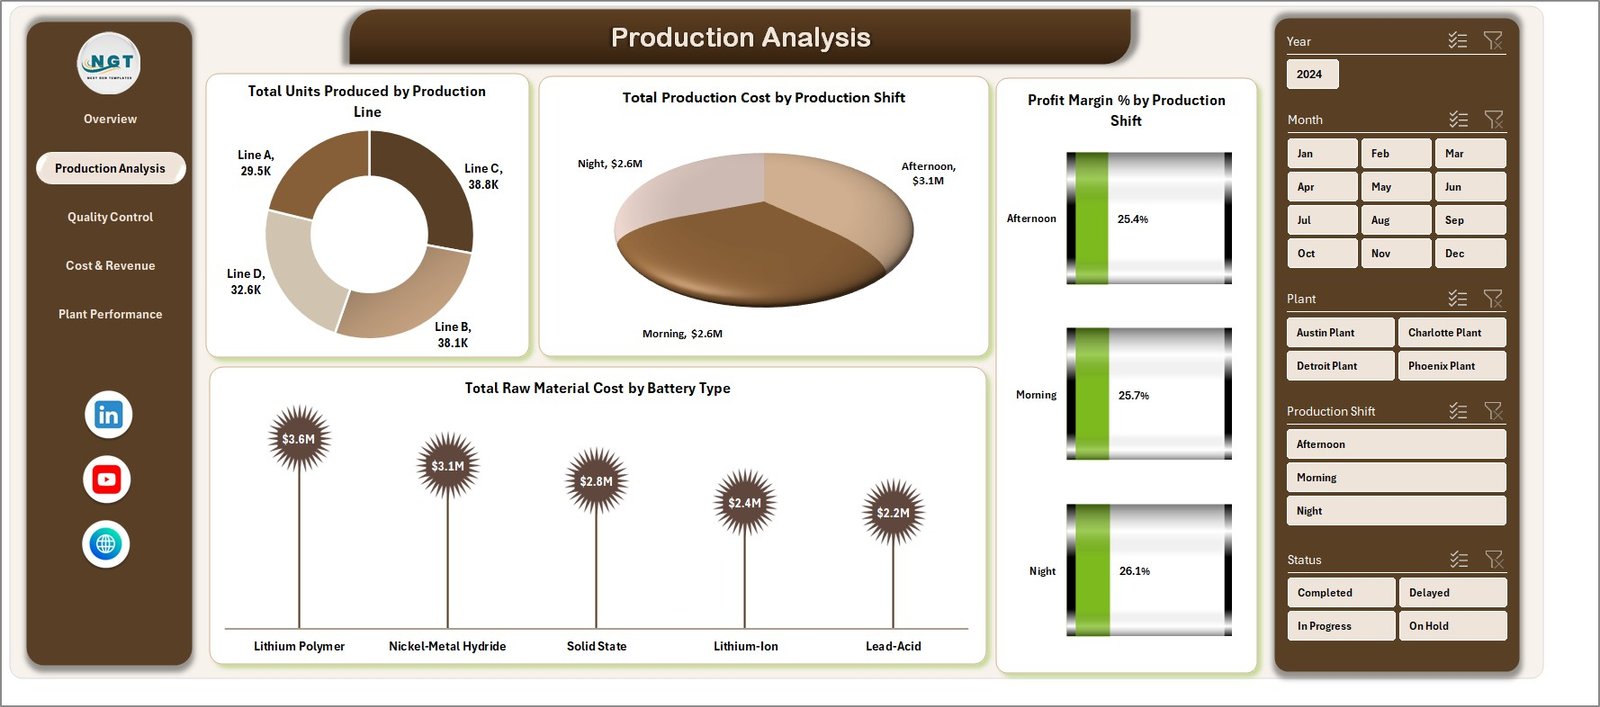
⚙️ Production Line Analysis – Identify high-performing lines and optimize underperforming ones.
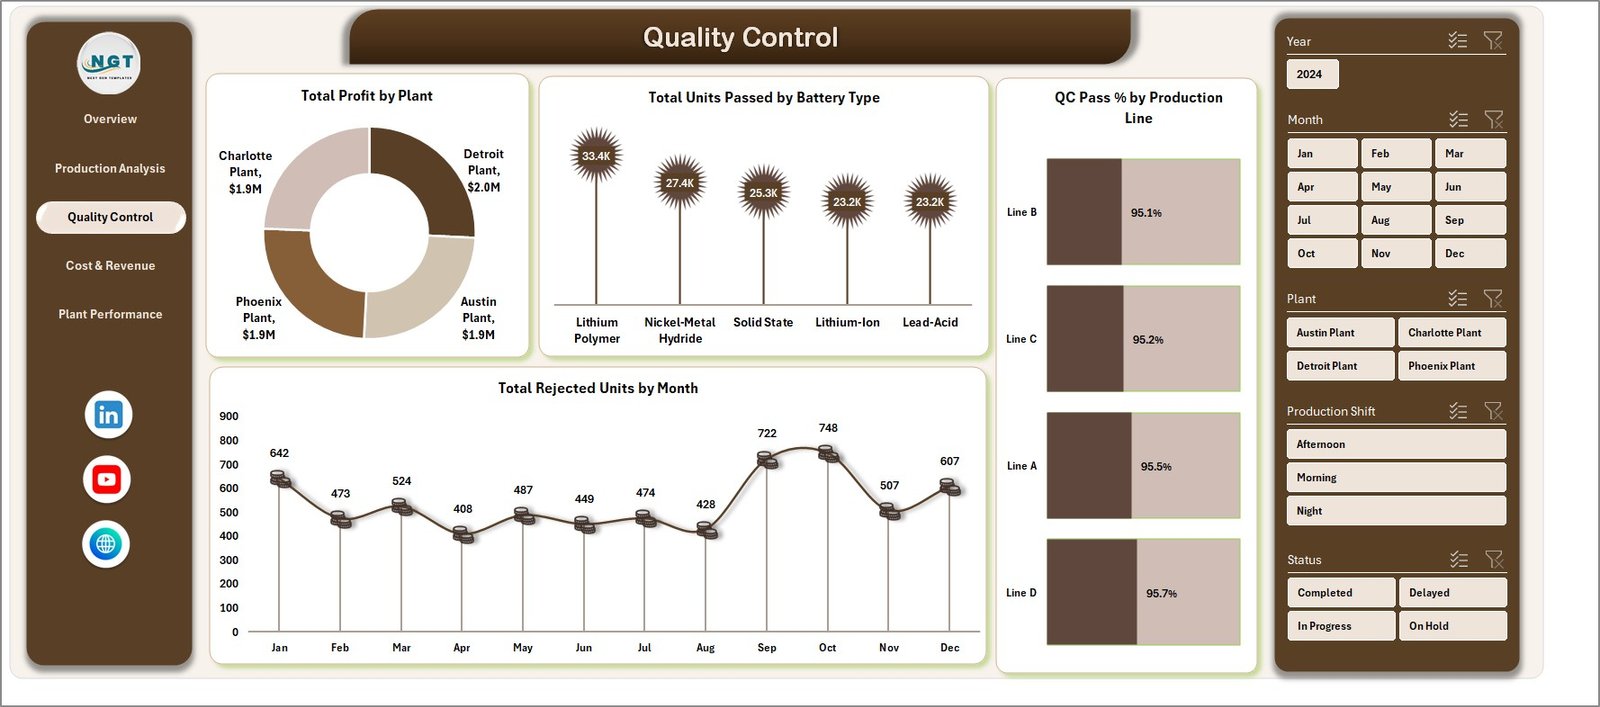
🧪 Quality Control Monitoring – Track QC pass rates, rejected units, and product consistency.
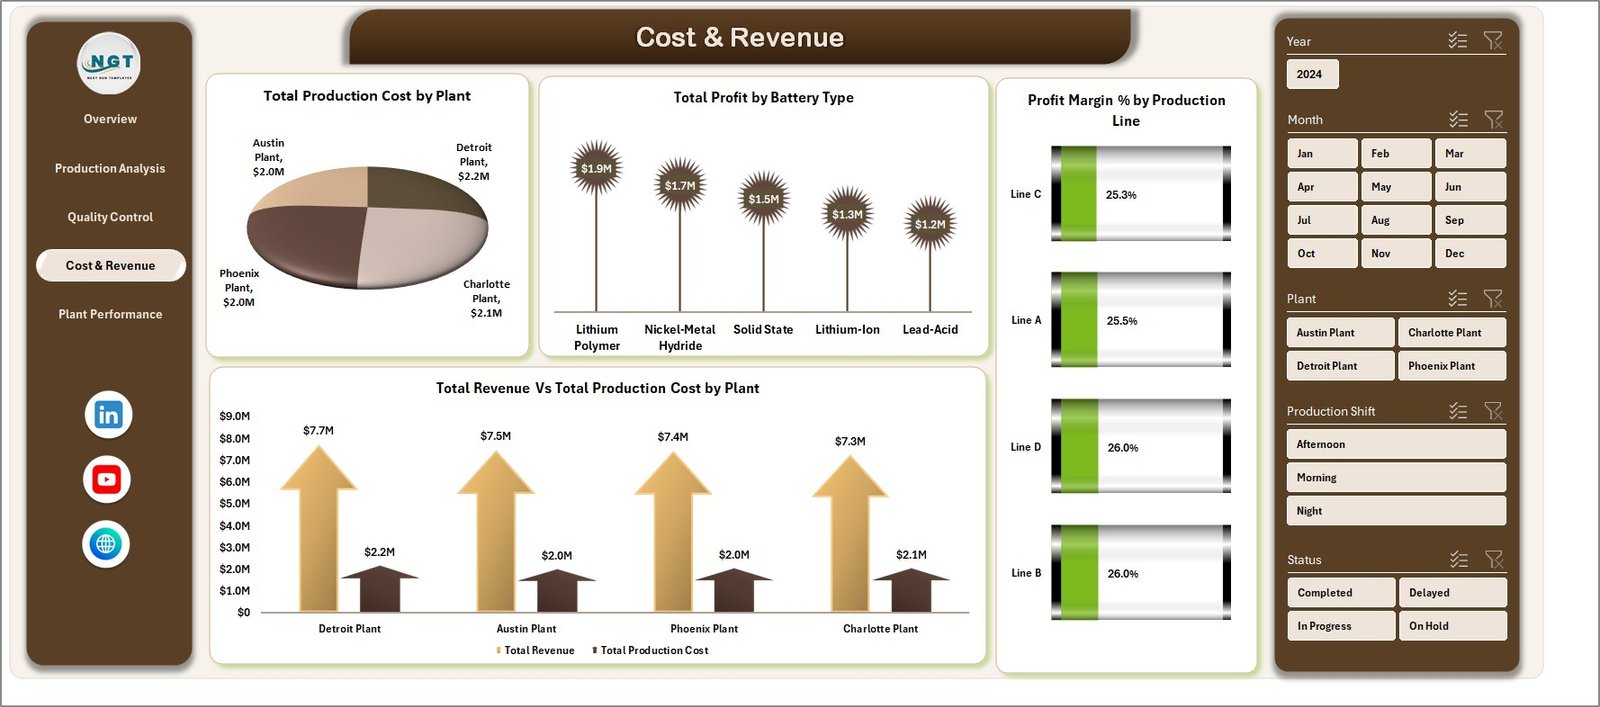
💰 Cost & Revenue Insights – Analyze profitability trends and production costs effectively.
📂 Support & Data Sheets Included – Maintain structured data and ensure smooth dashboard functionality.
📦 What’s Inside the Battery Manufacturing Dashboard in Excel
📁 7 Fully Structured Sheets designed for seamless analysis:
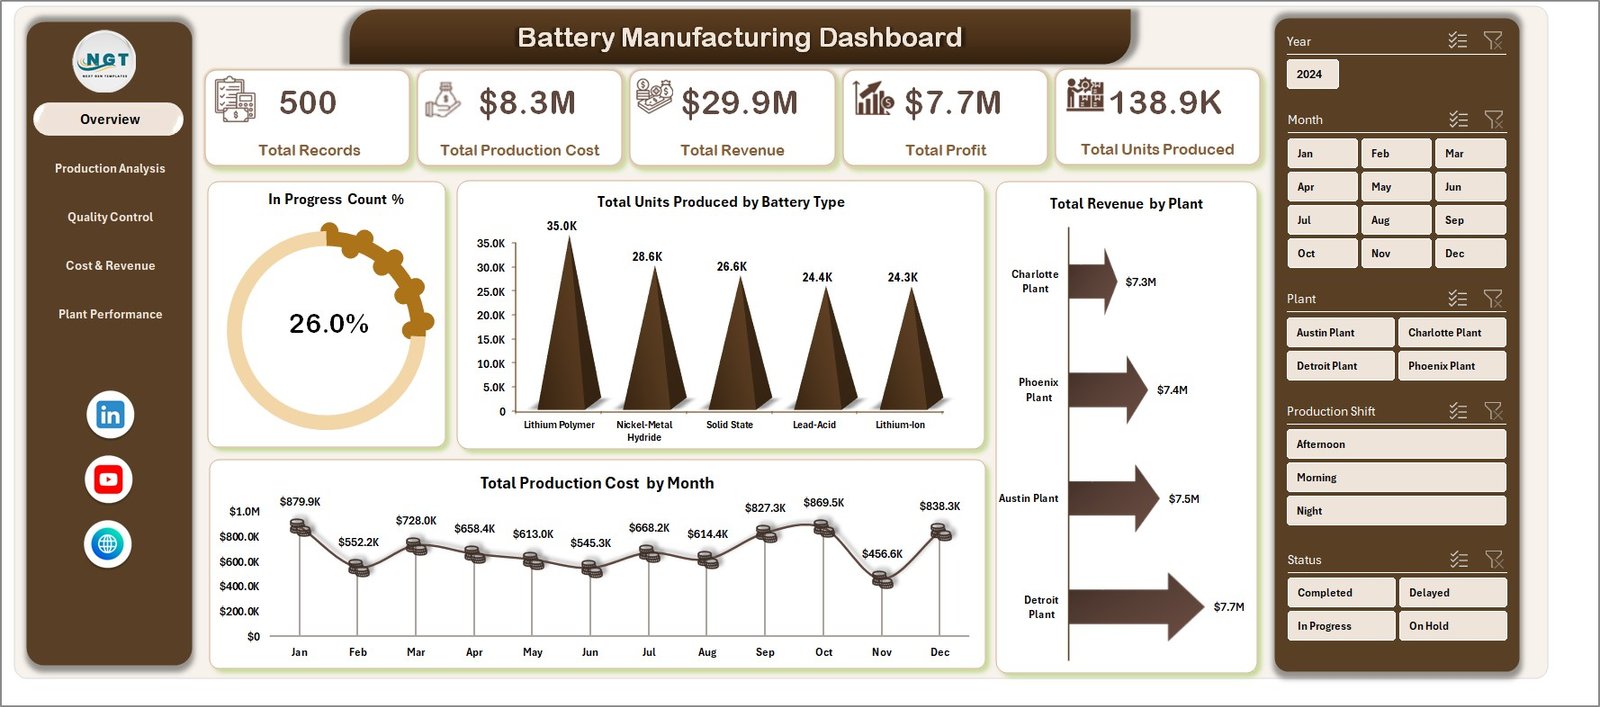
✔️ Overview Dashboard – Get a high-level snapshot of production health and KPIs.
✔️ Production Analysis – Evaluate performance across production lines and shifts.
✔️ Quality Control Sheet – Monitor QC pass rates and defect trends.
✔️ Cost & Revenue Analysis – Understand financial performance and profit margins.
✔️ Plant Performance Dashboard – Compare output and efficiency across plants.
✔️ Data Sheet – Centralized data input area for all records.
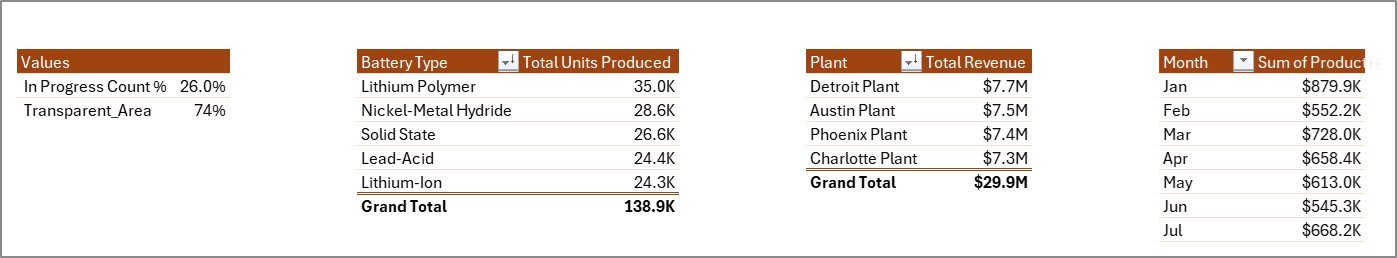
✔️ Support Sheet – Pivot tables powering dynamic dashboard visuals.
Everything is pre-built and ready to use—no complex setup required!
🛠️ How to Use the Battery Manufacturing Dashboard in Excel
Getting started is simple and quick:
1️⃣ Enter or import your data into the Data Sheet.
2️⃣ Ensure the data format is consistent.
3️⃣ Go to the Excel ribbon and click Refresh All.
4️⃣ Use slicers to filter and analyze specific metrics.
5️⃣ Explore different dashboard pages for detailed insights.
💡 Within minutes, you’ll have a fully functional, interactive dashboard ready to support your decisions.
👥 Who Can Benefit from This Battery Manufacturing Dashboard in Excel
🏭 Battery Manufacturers – Monitor production efficiency and reduce operational costs.
📊 Operations Managers – Gain real-time insights into production performance.
💼 Business Analysts – Analyze trends, profitability, and cost structures.
🔧 Production Supervisors – Track shift-wise performance and optimize resources.
🧪 Quality Control Teams – Ensure product quality and reduce defect rates.
📈 Plant Managers – Compare plant performance and improve output efficiency.
This dashboard is perfect for anyone looking to simplify manufacturing analytics and make smarter decisions.
🔗 Click here to read the Detailed blog post
🎥 Visit our YouTube channel to learn step-by-step video tutorials:
👉 https://youtube.com/@PKAnExcelExpert


