
Managing aircraft maintenance efficiently is one of the biggest challenges in the aviation industry. Airlines, aircraft operators, and maintenance teams must constantly monitor work orders, maintenance costs, reliability scores, and operational efficiency. However, when this data is spread across multiple spreadsheets and reports, analyzing it becomes slow and inefficient.
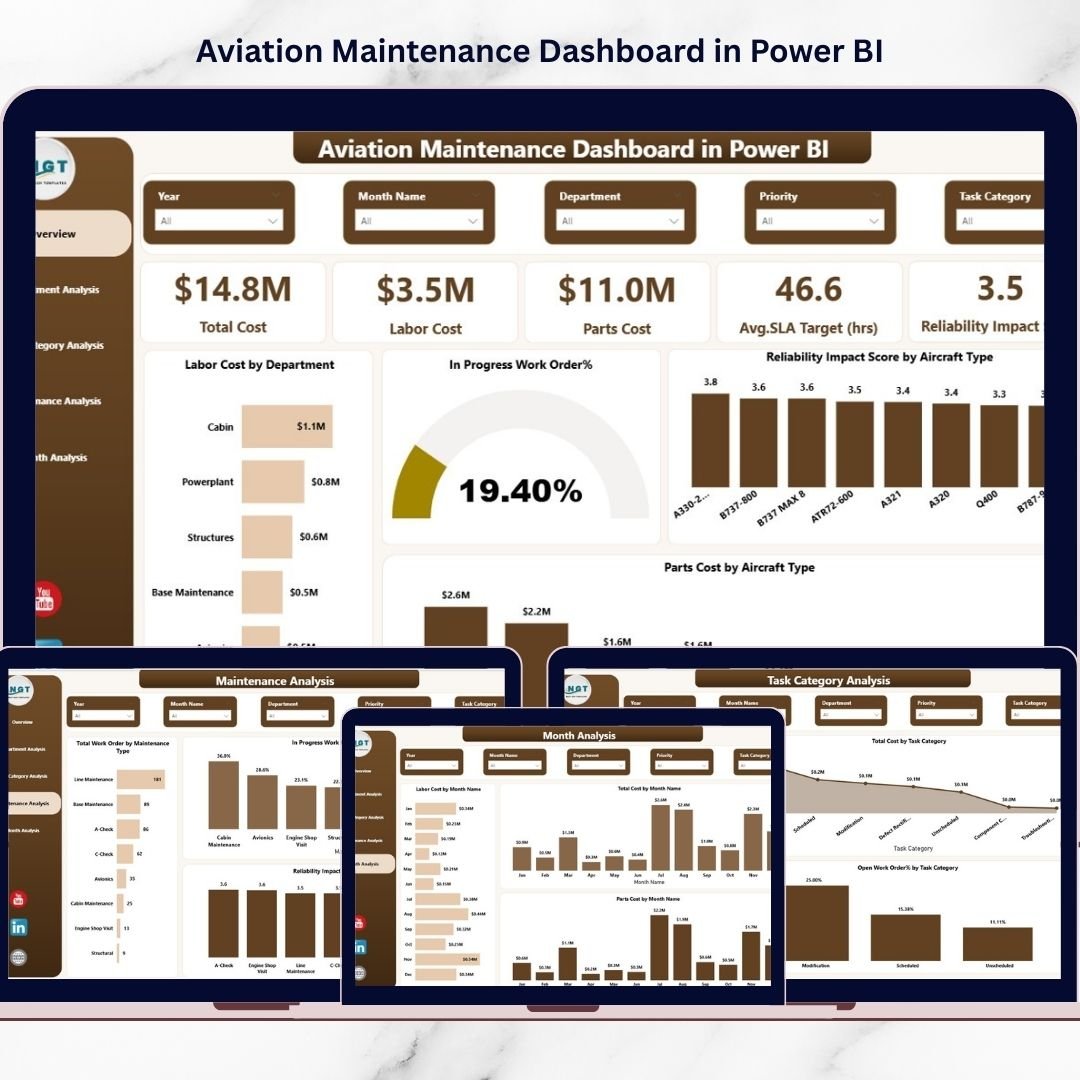
That is exactly why we created the Aviation Maintenance Dashboard in Power BI — a powerful, ready-to-use analytics solution designed to help aviation professionals monitor maintenance performance through interactive visual insights.
This dashboard consolidates all aviation maintenance data into a single intelligent reporting system. Instead of analyzing multiple reports manually, users can quickly monitor costs, track work orders, evaluate department performance, and analyze aircraft reliability through dynamic Power BI visualizations.
With this dashboard, aviation teams can make faster decisions, reduce operational costs, and improve aircraft reliability using data-driven insights.
✈️ Key Feature of Aviation Maintenance Dashboard in Power BI
📊 5 Interactive Dashboard Pages
The dashboard contains five analytical pages that provide deep insights into aviation maintenance performance.
📊 Centralized Maintenance Monitoring
Track all maintenance activities including work orders, costs, and reliability metrics from one dashboard.
📊 Cost Analysis for Maintenance Operations
Monitor Total Cost, Labor Cost, and Parts Cost to better control maintenance expenses.
📊 Aircraft Reliability Monitoring
Analyze Reliability Impact Score by Aircraft Type to understand maintenance impact on aircraft performance.
📊 Work Order Management Insights
Track open work orders and in-progress work orders to improve maintenance efficiency.
📊 Department Performance Evaluation
Compare maintenance productivity across departments to optimize workforce allocation.
📊 Maintenance Type Analysis
Analyze preventive, corrective, scheduled, and emergency maintenance activities.
📊 Monthly Maintenance Cost Tracking
Understand maintenance cost patterns through monthly trend analysis.
📊 Interactive Power BI Filters (Slicers)
Easily filter dashboard data to analyze maintenance performance from multiple perspectives.
📂 What’s Inside the Aviation Maintenance Dashboard in Power BI
This Power BI dashboard includes five fully interactive analytical pages designed for aviation maintenance performance analysis.
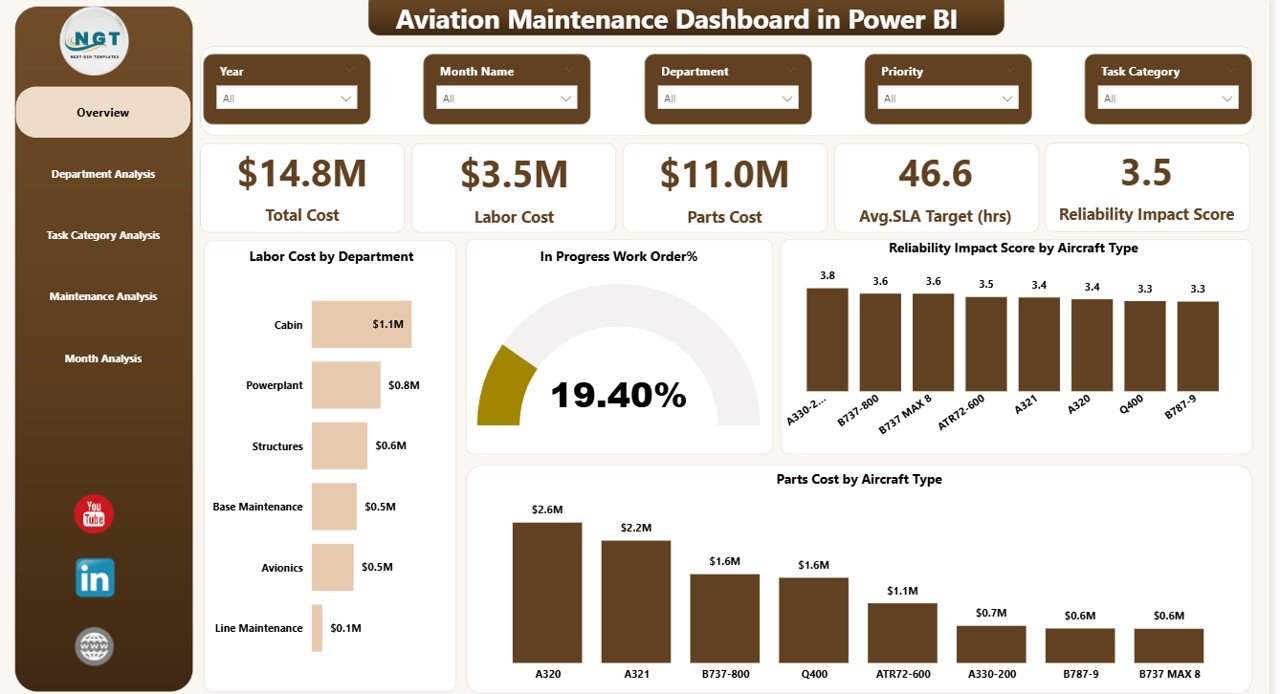
1️⃣ Overview Page
This page provides a quick summary of maintenance operations.
KPI Cards Included:
-
Total Cost
-
Labor Cost
-
Parts Cost
-
Average SLA Target (Hours)
-
Reliability Impact Score
Charts Included:
-
Labor Cost by Department
-
In Progress Work Order %
-
Reliability Impact Score by Aircraft Type
-
Parts Cost by Aircraft Type
This page acts as the main maintenance monitoring control panel.
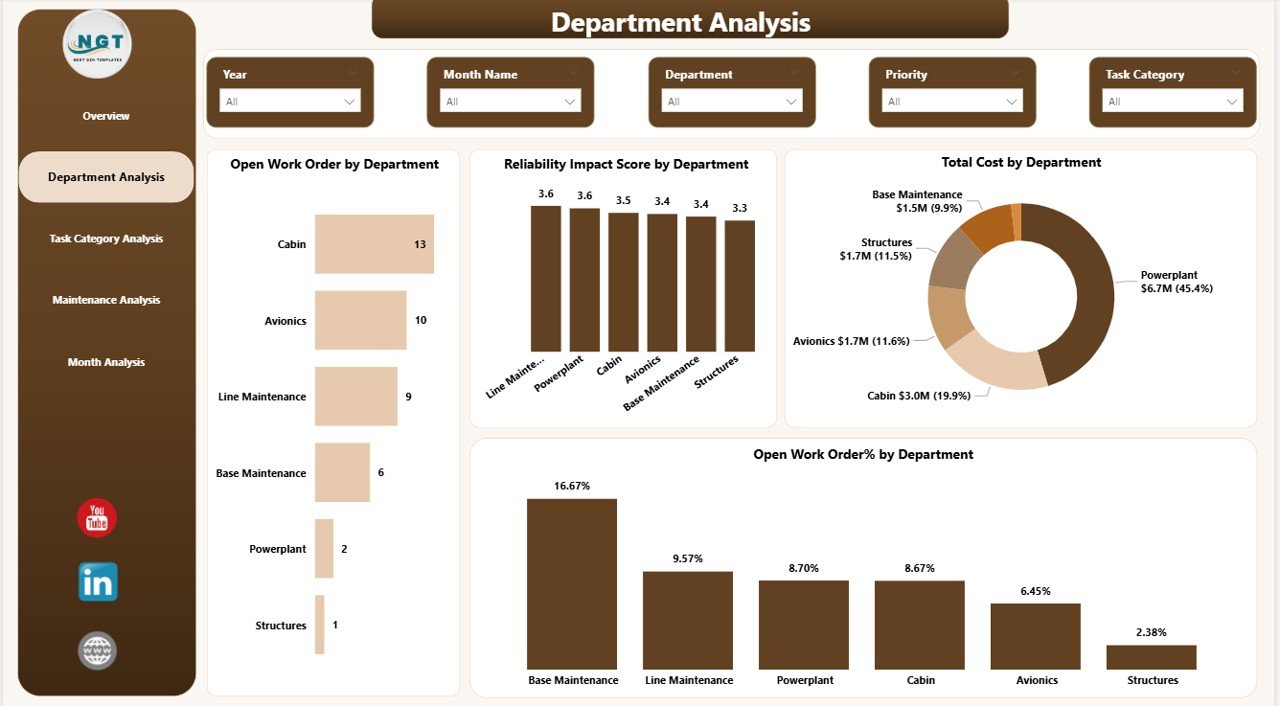
2️⃣ Department Analysis Page
This page evaluates maintenance performance across departments.
Charts included:
-
Open Work Orders by Department
-
Reliability Impact Score by Department
-
Total Cost by Department
-
Open Work Order % by Department
This analysis helps aviation managers identify department productivity and maintenance bottlenecks.
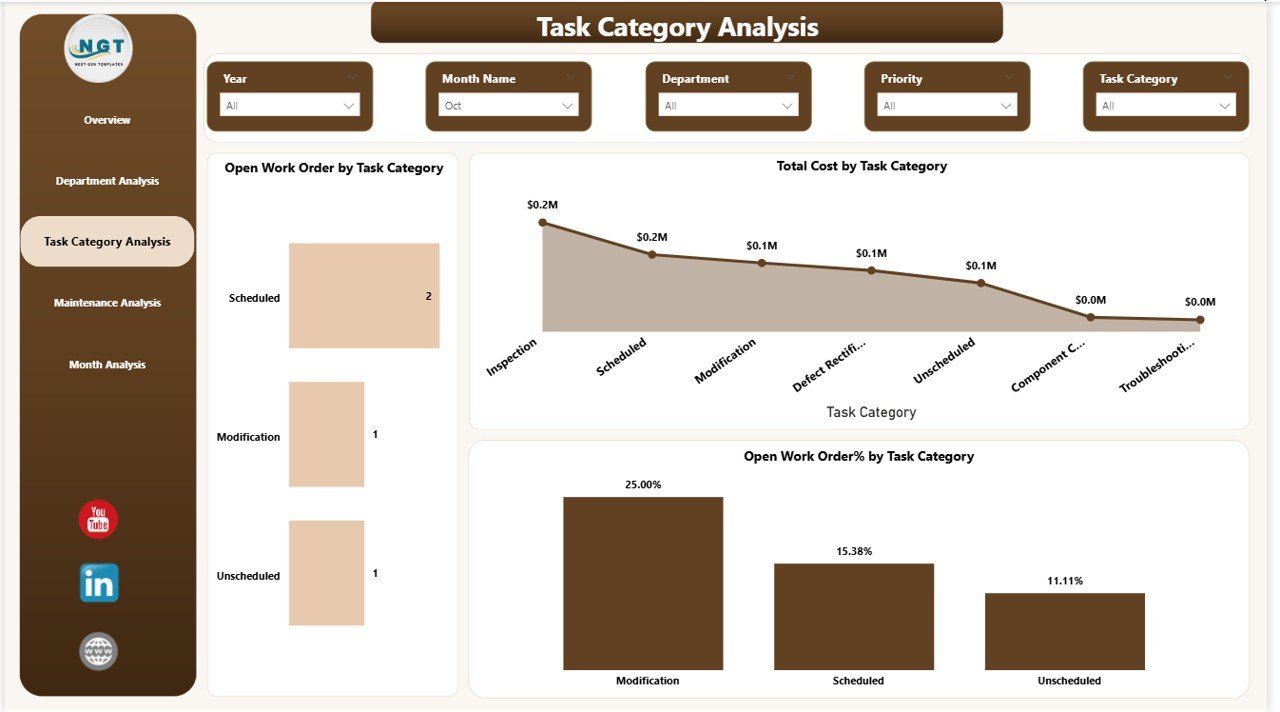
3️⃣ Task Category Analysis Page
This page focuses on maintenance workload by task category.
Charts included:
-
Open Work Orders by Task Category
-
Total Cost by Task Category
-
Open Work Order % by Task Category
Managers can quickly identify which maintenance categories require additional attention or resources.
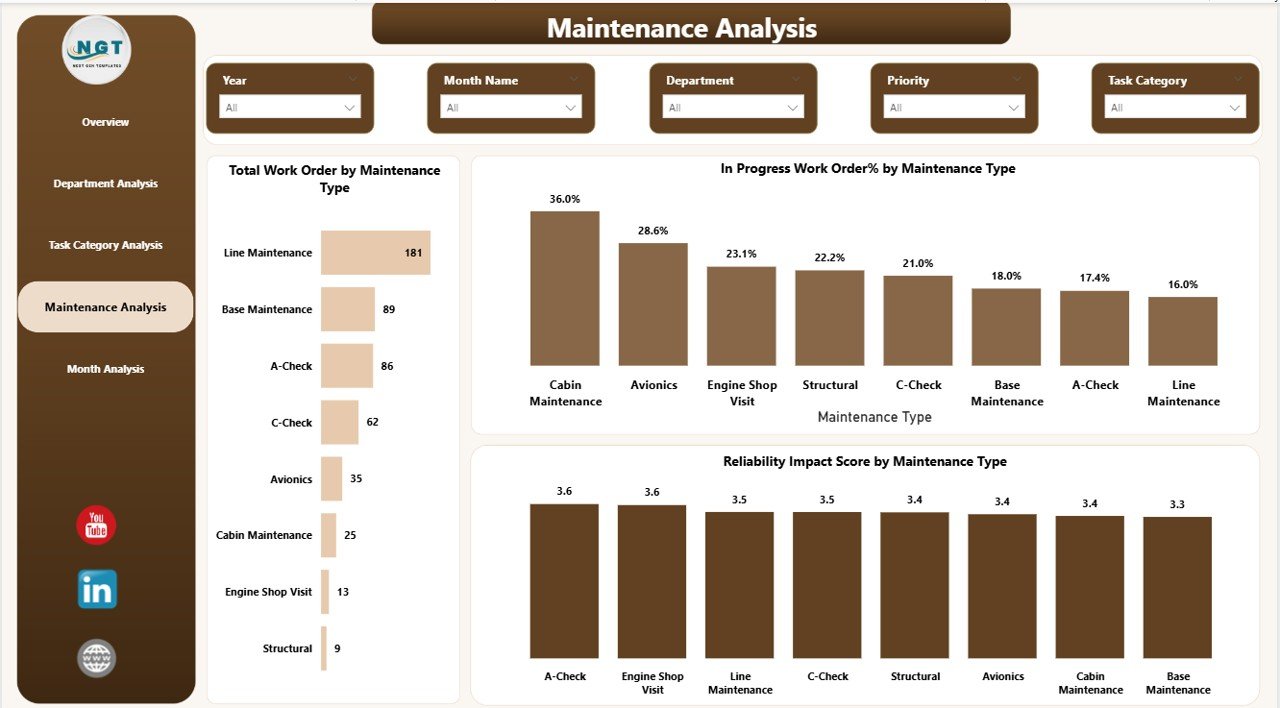
4️⃣ Maintenance Analysis Page
This page analyzes maintenance types such as preventive, corrective, scheduled, and emergency maintenance.
Charts included:
-
Total Work Orders by Maintenance Type
-
In Progress Work Order % by Maintenance Type
-
Reliability Impact Score by Maintenance Type
This helps organizations optimize maintenance planning and strategy.
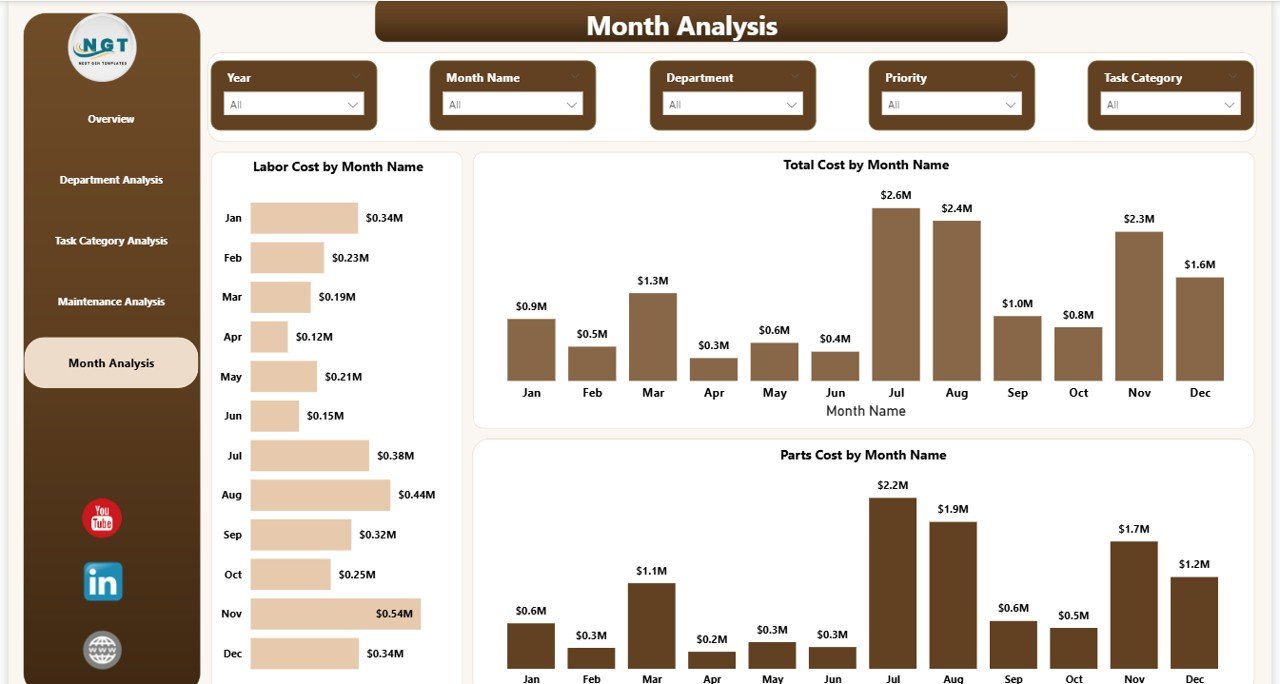
5️⃣ Month Analysis Page
This page tracks maintenance cost trends throughout the year.
Charts included:
-
Labor Cost by Month
-
Total Cost by Month
-
Parts Cost by Month
With this analysis, aviation teams can forecast budgets and plan maintenance schedules effectively.
⚙️ How to Use the Aviation Maintenance Dashboard in Power BI
Using this dashboard is extremely simple and user-friendly.
Step 1: Import aviation maintenance data into Power BI.
Step 2: Connect the data to the dashboard model.
Step 3: Use slicers and filters to analyze data by aircraft type, department, or maintenance category.
Step 4: Monitor KPI cards to track maintenance performance instantly.
Step 5: Use visual charts to identify cost trends, work order backlog, and reliability issues.
This intuitive interface ensures that even non-technical users can easily analyze aviation maintenance data.
👨✈️ Who Can Benefit from This Aviation Maintenance Dashboard in Power BI
This dashboard is highly valuable for professionals working in aviation operations and maintenance management.
👨✈️ Airline Maintenance Managers
👨🔧 Aircraft Engineers
📊 Aviation Data Analysts
🛠 Maintenance Repair Organizations (MRO)
📈 Aviation Operations Managers
🛫 Airline Executives
📋 Maintenance Planners
By using this dashboard, these professionals can improve operational efficiency, reduce maintenance costs, and enhance aircraft safety.
Click here to read the Detailed blog post
Watch the step-by-step video tutorial:


