Automation Units Dashboard plants increasingly rely on automation technologies to improve productivity, maintain consistent product quality, and reduce operational errors. Automation units such as robotic arms, conveyor systems, CNC machines, packaging automation units, and smart production equipment have become essential components of modern industrial environments. However, managing and monitoring these automation systems requires continuous tracking of performance indicators such as machine uptime, maintenance activities, operating efficiency, downtime trends, and energy consumption.
Despite the advanced technology used in automation systems, many organizations still track machine performance through scattered spreadsheets or manual reports. As a result, managers often struggle to analyze equipment performance across departments, evaluate maintenance costs, or identify machines that cause operational disruptions. Without a centralized monitoring system, decision-making becomes slower and equipment failures may go unnoticed until they significantly impact production.
To address these challenges, companies increasingly adopt data-driven dashboards that consolidate operational data into a single analytical platform. One powerful solution for this purpose is the Automation Units Dashboard in Power BI.
The Automation Units Dashboard in Power BI is a ready-to-use business intelligence solution designed to monitor automation equipment performance using interactive charts, KPI indicators, and advanced data visualizations. By transforming raw operational data into visual insights, the dashboard helps managers monitor automation units across factories, departments, vendors, and machine types.
Power BI connects with multiple data sources such as Excel spreadsheets, maintenance logs, ERP systems, IoT sensors, and production databases. Once connected, the dashboard automatically processes the data and displays performance insights through interactive visual reports. As a result, managers can quickly identify downtime issues, analyze maintenance costs, and monitor machine efficiency in real time.
The dashboard tracks several important automation performance metrics, including:
-
Machine operating hours
-
Equipment downtime trends
-
Maintenance costs and activities
-
Vendor service performance
-
Energy consumption across departments
-
Automation unit distribution by type
-
Monthly operational performance trends
The Automation Units Dashboard in Power BI includes five analytical pages, each designed to analyze automation performance from a different operational perspective. These pages include Overview, Department Analysis, Vendor Analysis, Unit Type Analysis, and Month Analysis.
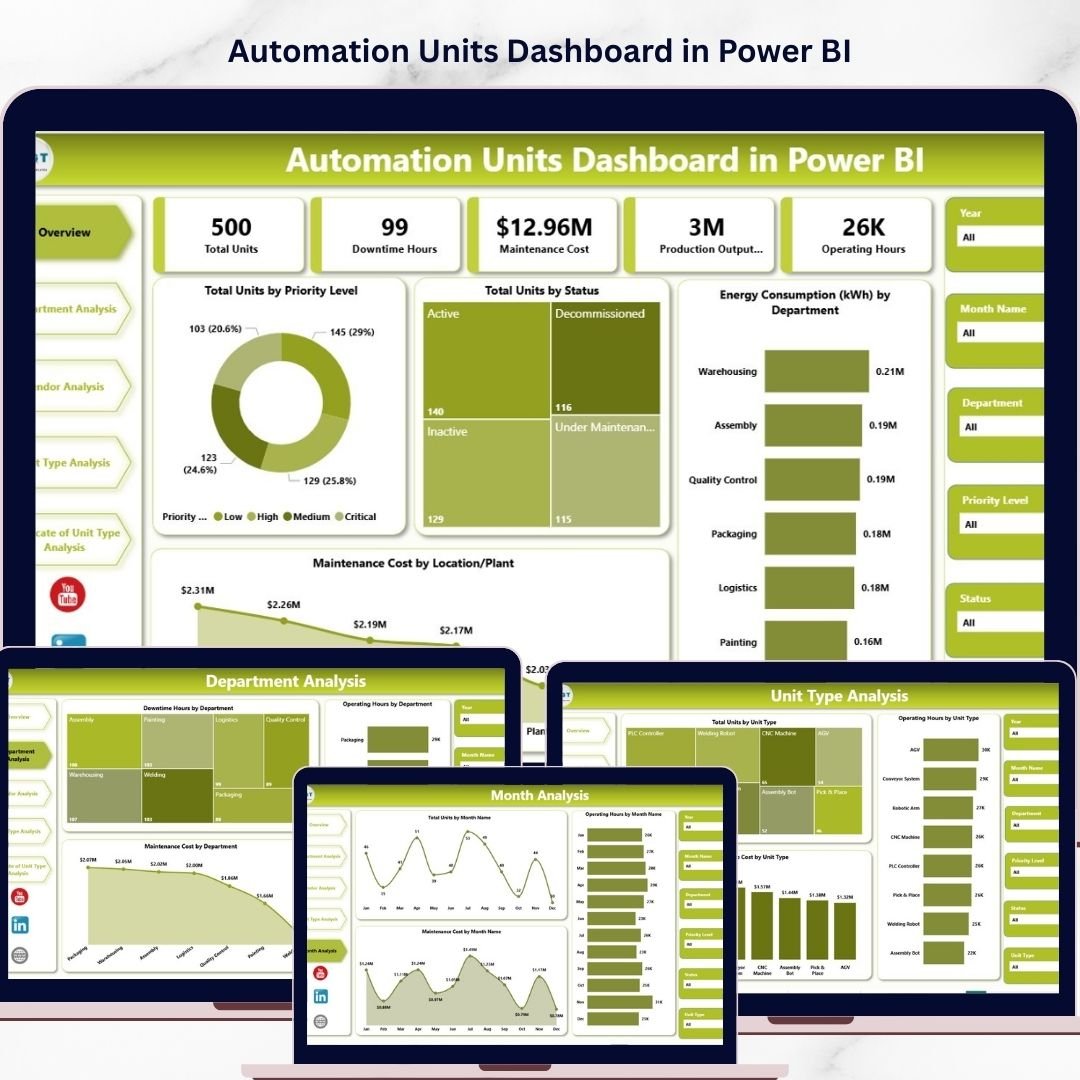
The Overview Page acts as the main control panel of the dashboard. It provides a quick summary of automation performance through KPI cards and analytical charts. Managers can instantly see metrics such as total units by priority level, total units by operational status, energy consumption by department, and maintenance cost by location or plant. Interactive slicers allow users to filter data dynamically based on operational parameters.
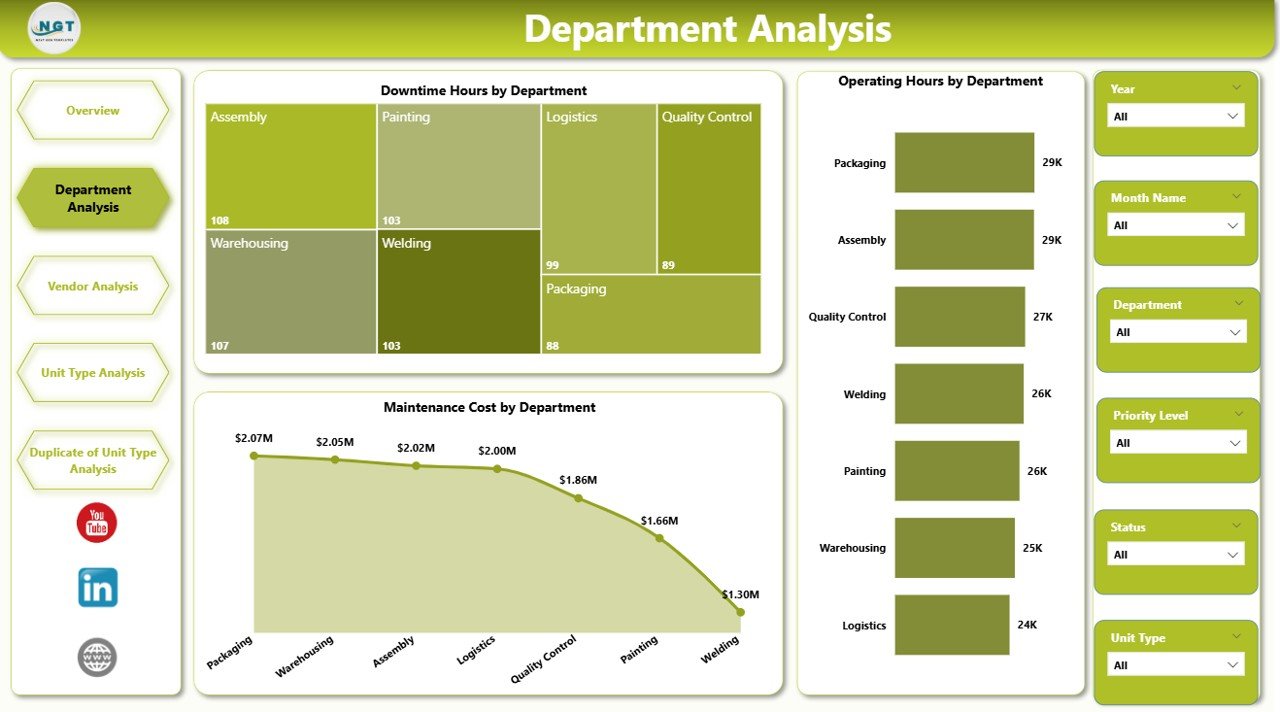
The Department Analysis Page focuses on analyzing automation performance across departments. Manufacturing plants often operate multiple departments such as assembly, packaging, logistics, and quality control. Each department may use different automation equipment with varying performance levels. This page displays downtime hours, operating hours, and maintenance costs by department, helping managers identify departments that require maintenance improvements or operational optimization.
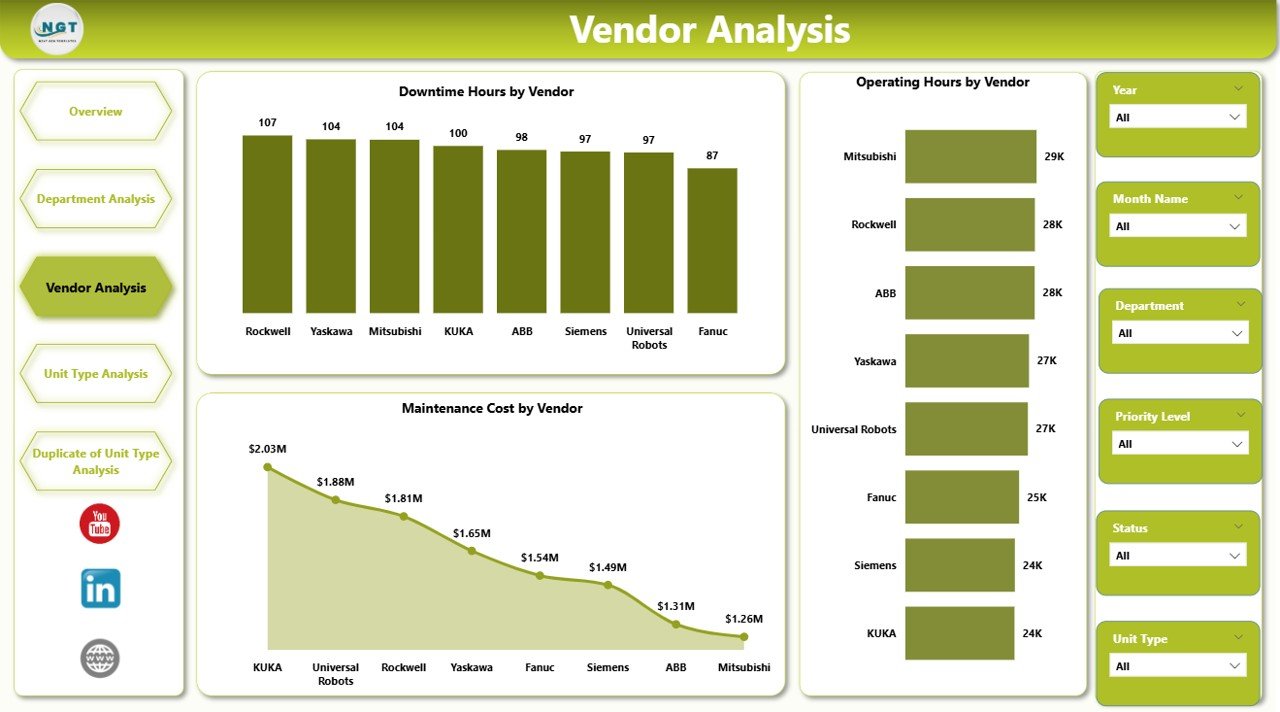
The Vendor Analysis Page evaluates the performance of vendors responsible for machine maintenance, spare parts supply, and equipment servicing. Organizations rely heavily on vendors to maintain automation systems, so monitoring vendor performance becomes essential. This page displays downtime hours, operating hours, and maintenance costs by vendor, allowing organizations to evaluate vendor reliability and service quality.
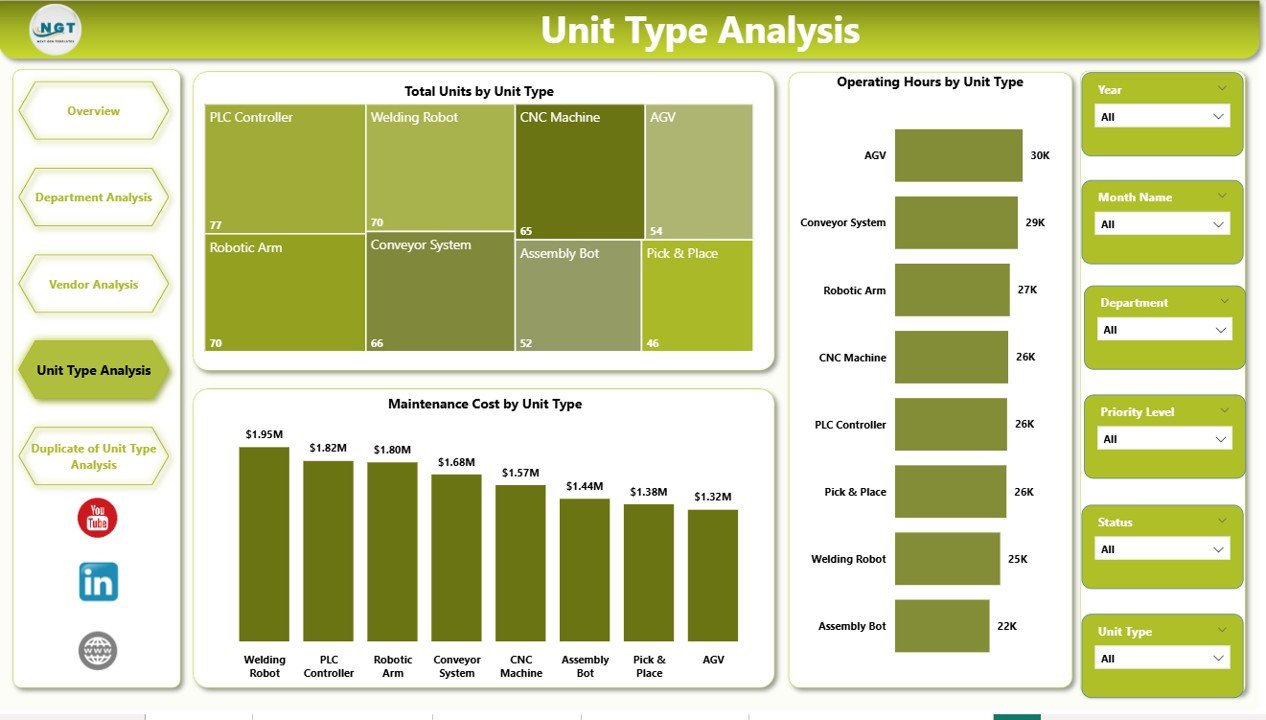
The Unit Type Analysis Page focuses on analyzing automation equipment based on machine type. Manufacturing environments often use different types of automation systems such as robotic arms, conveyor systems, assembly robots, and packaging automation units. Each machine type may have different maintenance requirements and operational efficiency levels. This page displays total units, operating hours, and maintenance costs by unit type, helping managers plan equipment upgrades and optimize machine utilization.
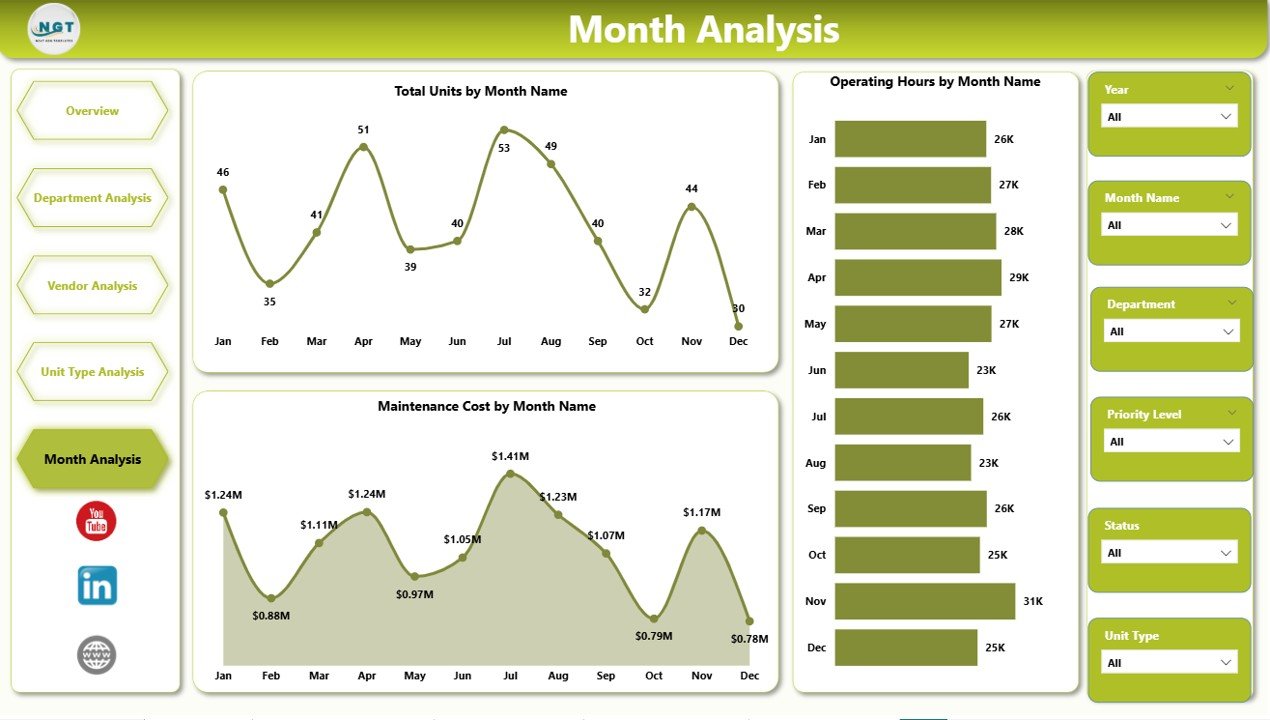
The Month Analysis Page provides time-based insights into automation performance. Because production demand fluctuates across months, machine usage and maintenance costs may vary. This page tracks total units, operating hours, and maintenance costs by month, allowing managers to identify seasonal patterns and plan preventive maintenance strategies.
One of the most powerful advantages of Power BI is its ability to integrate multiple data sources. Automation dashboards can connect with IoT sensors, ERP systems, maintenance databases, and Excel files, enabling organizations to monitor machine performance continuously. Automated data refresh ensures that the dashboard always reflects the latest operational information.
The Automation Units Dashboard in Power BI is ideal for professionals responsible for managing industrial automation environments. This includes manufacturing managers, automation engineers, maintenance supervisors, plant operations managers, vendor management teams, and industrial data analysts.
By transforming complex machine data into clear visual insights, the Automation Units Dashboard in Power BI helps organizations reduce downtime, optimize maintenance planning, improve vendor management, and enhance overall operational efficiency.
Key Features of Automation Units Dashboard in Power BI
⚙ Automation Equipment Monitoring
Track machine performance, downtime, and maintenance activities.
📊 Interactive Operational Analytics
Analyze automation systems through dynamic Power BI visualizations.
🏭 Department-Level Performance Insights
Compare automation performance across production departments.
🔧 Vendor Performance Monitoring
Evaluate vendor service quality and maintenance efficiency.
🤖 Machine Type Performance Analysis
Monitor efficiency and maintenance trends by automation unit type.
📉 Downtime Trend Monitoring
Identify operational disruptions and equipment failures quickly.
📊 Maintenance Cost Analysis
Track maintenance expenses by department, vendor, and machine type.
📅 Monthly Performance Monitoring
Analyze machine usage and maintenance costs over time.
⚡ Real-Time Data Integration
Connect with ERP systems, IoT sensors, and databases.
📊 Automated Business Intelligence Reporting
Power BI automatically updates visual insights when data refreshes.
What’s Inside the Automation Units Dashboard in Power BI
The dashboard includes five analytical pages designed to analyze automation performance from different perspectives.
Overview Page – Automation Performance Summary
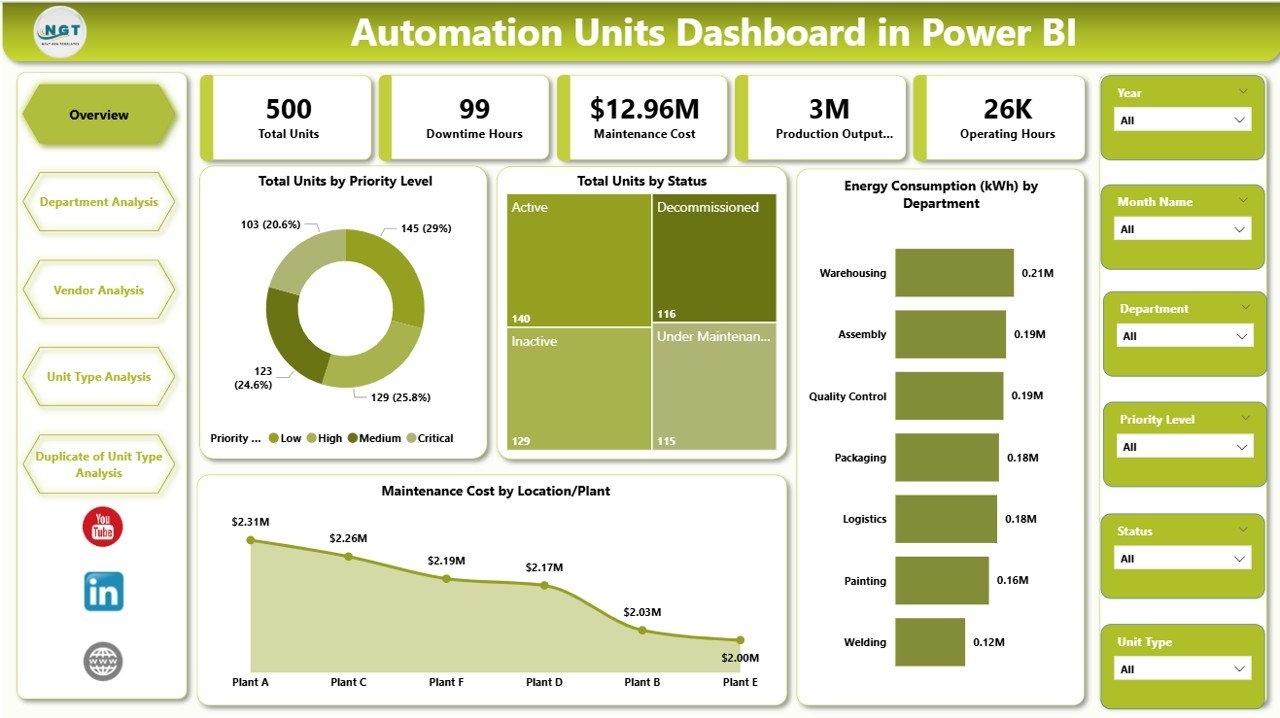
The Overview Page provides a high-level summary of automation performance.
Key visuals include:
-
Total Units by Priority Level
-
Total Units by Status
-
Energy Consumption by Department
-
Maintenance Cost by Location or Plant
These insights help managers quickly evaluate automation system conditions.
Department Analysis Page
This page analyzes automation performance across departments.
Charts include:
-
Downtime Hours by Department
-
Operating Hours by Department
-
Maintenance Cost by Department
Vendor Analysis Page
This page evaluates vendor service performance.
Charts include:
-
Total Downtime Hours by Vendor
-
Operating Hours by Vendor
-
Maintenance Cost by Vendor
Unit Type Analysis Page
This page analyzes machine performance by automation unit type.
Charts include:
-
Total Units by Unit Type
-
Operating Hours by Unit Type
-
Maintenance Cost by Unit Type
Month Analysis Page
This page focuses on time-based operational trends.
Charts include:
-
Total Units by Month
-
Operating Hours by Month
-
Maintenance Cost by Month
How to Use the Automation Units Dashboard
1️⃣ Connect Power BI to automation data sources.
2️⃣ Import machine performance data such as downtime logs and maintenance records.
3️⃣ Refresh the dataset to update dashboard visuals.
4️⃣ Use filters and slicers to analyze specific departments, vendors, or unit types.
5️⃣ Monitor operational trends and identify improvement opportunities.
Who Can Use This Dashboard
This dashboard is ideal for professionals responsible for industrial automation systems.
🏭 Manufacturing Managers
🤖 Automation Engineers
🔧 Maintenance Teams
📊 Operations Managers
🏢 Plant Supervisors
📈 Industrial Data Analysts
These professionals can use the dashboard to monitor machine performance, reduce downtime, and improve production efficiency.
Click here to read the Detailed blog post
Visit our YouTube channel to learn step-by-step video tutorials
https://youtube.com/@PKAnExcelExpert