
In today’s complex business environment, maintaining transparency and minimizing risk requires more than traditional audits — it demands real-time insights and automation. That’s where the Audit & Internal Controls Dashboard in Excel comes in.
This ready-to-use, interactive dashboard empowers audit and compliance teams to track, analyze, and visualize audit data seamlessly. Built entirely in Microsoft Excel, it brings automation, analytics, and clarity together — eliminating the need for manual reporting.
Whether you’re managing internal audits, financial checks, or risk assessments, this dashboard simplifies monitoring, enhances accuracy, and drives accountability across departments and regions.
⚙️ Key Features of the Audit & Internal Controls Dashboard in Excel
✅ 📊 Five Analytical Pages – Comprehensive, interactive reporting views that cover every aspect of auditing and control management.
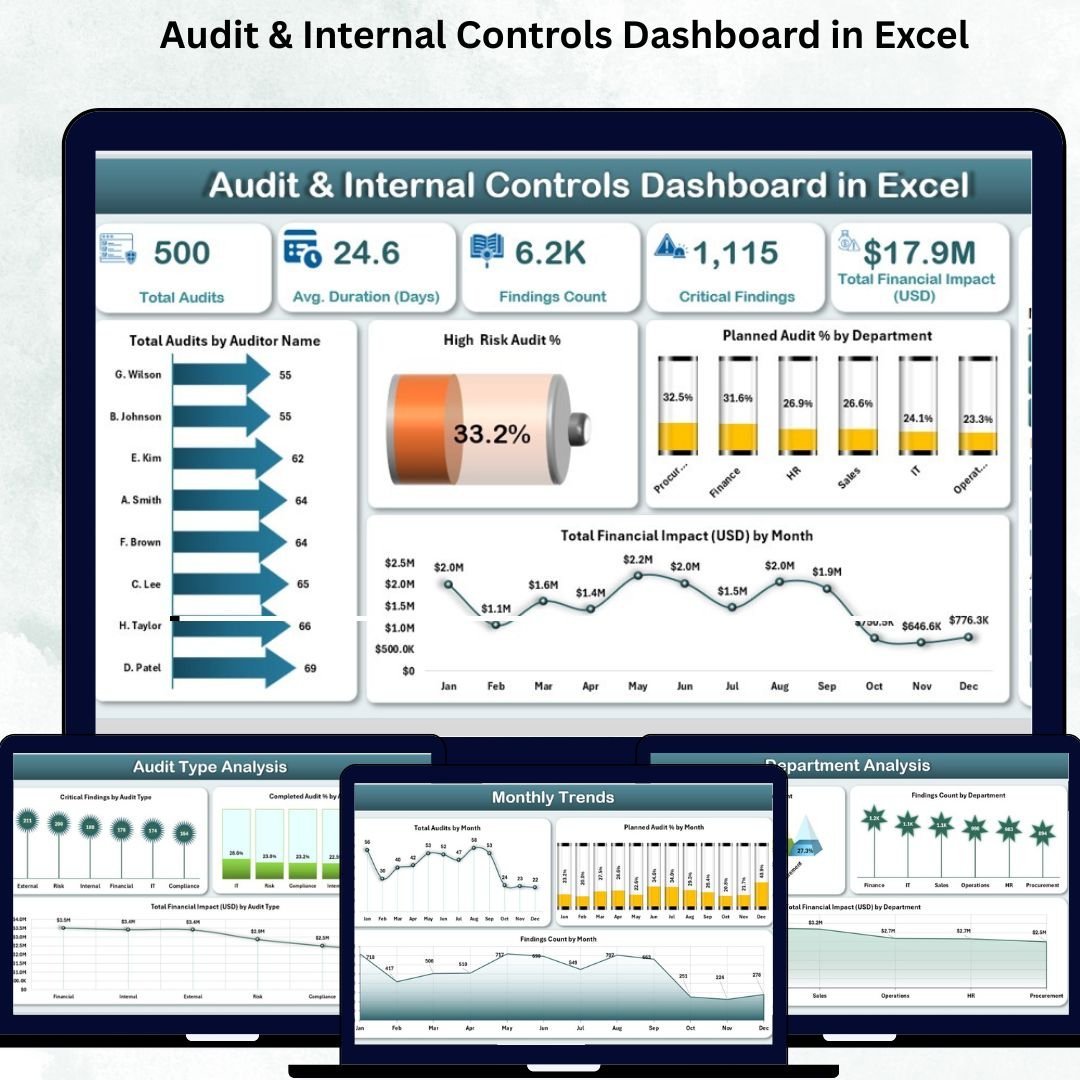
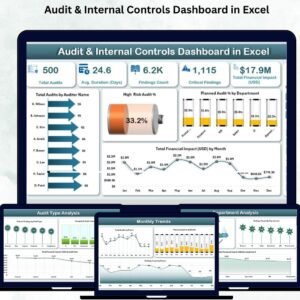
🏁 1. Overview Page – Your Central Command Hub
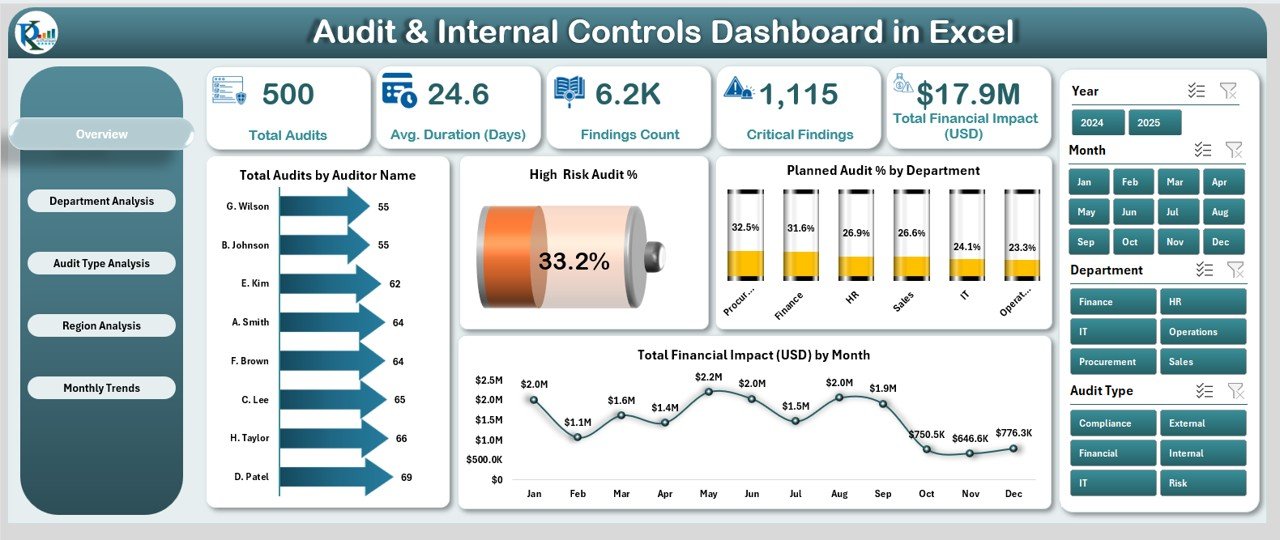
The Overview Page provides a bird’s-eye view of all audit activities and KPIs.
Includes:
-
🎛️ Slicers: Filter by Month, Department, Region, or Auditor.
-
📈 Five KPI Cards: Total Audits, High-Risk Audit %, Planned Audit %, Total Financial Impact (USD), and Findings Count.
-
📊 Charts Displayed:
-
Total Audits by Auditor Name
-
High-Risk Audit %
-
Planned Audit % by Department
-
Financial Impact by Month
-
👉 Get instant visibility into risk exposure, audit progress, and financial implications — all in one glance.
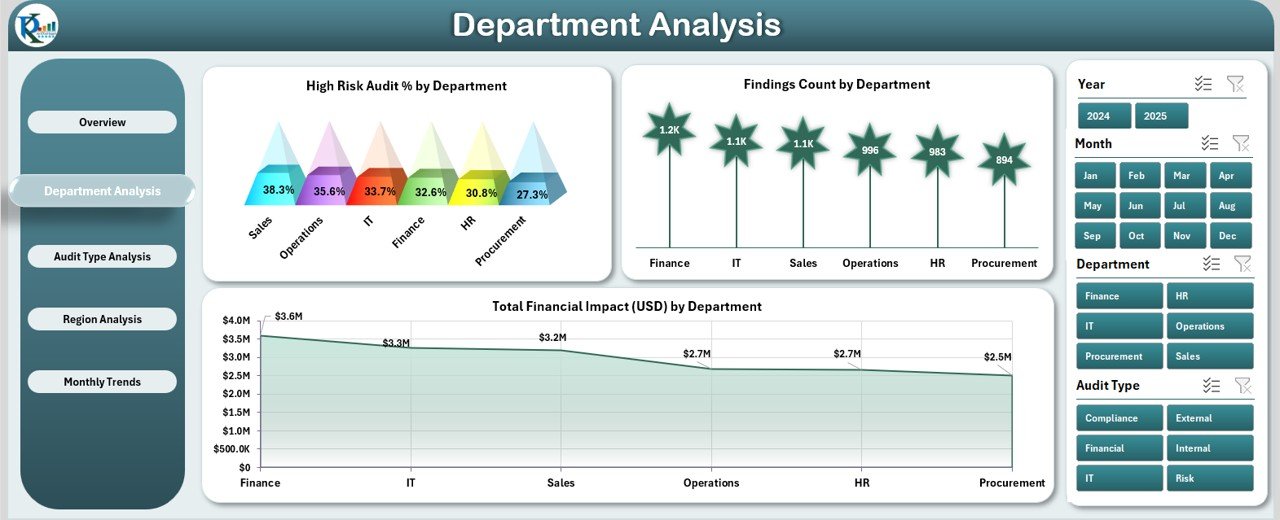
🏢 2. Department Analysis – Track Performance by Department
This page provides department-wise insights for better governance and accountability.
Charts Include:
-
High-Risk Audit % by Department
-
Findings Count by Department
-
Total Financial Impact (USD) by Department
Audit leaders can quickly spot non-compliant departments, high-risk areas, and cost implications with a single click.
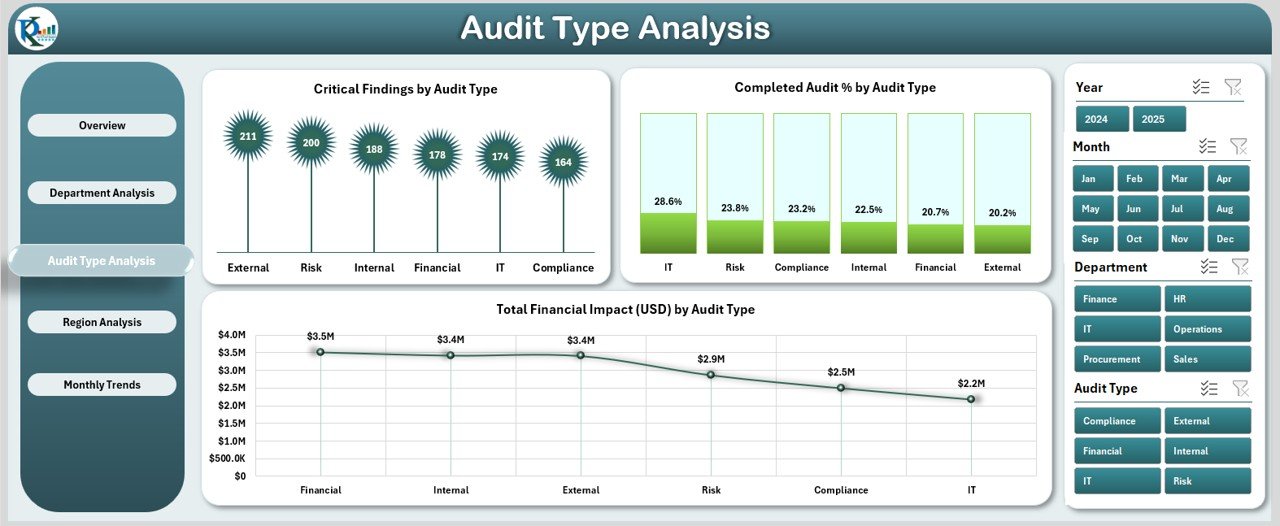
🧾 3. Audit Type Analysis – Compare Operational, Financial, and Compliance Audits
Understand how each audit type performs and contributes to organizational compliance.
Includes:
-
Critical Findings by Audit Type
-
Completed Audit % by Audit Type
-
Total Financial Impact (USD) by Audit Type
📊 This page helps allocate resources effectively and identify high-impact audit categories.
🌍 4. Region Analysis – Measure Performance by Geography
For organizations operating across multiple regions, this page highlights performance variations.
Visuals Displayed:
-
Total Financial Impact (USD) by Region
-
Planned Audits by Region
-
High-Risk Audit % by Region
🗺️ Identify regions with the most findings or highest risks, helping leadership prioritize corrective actions.
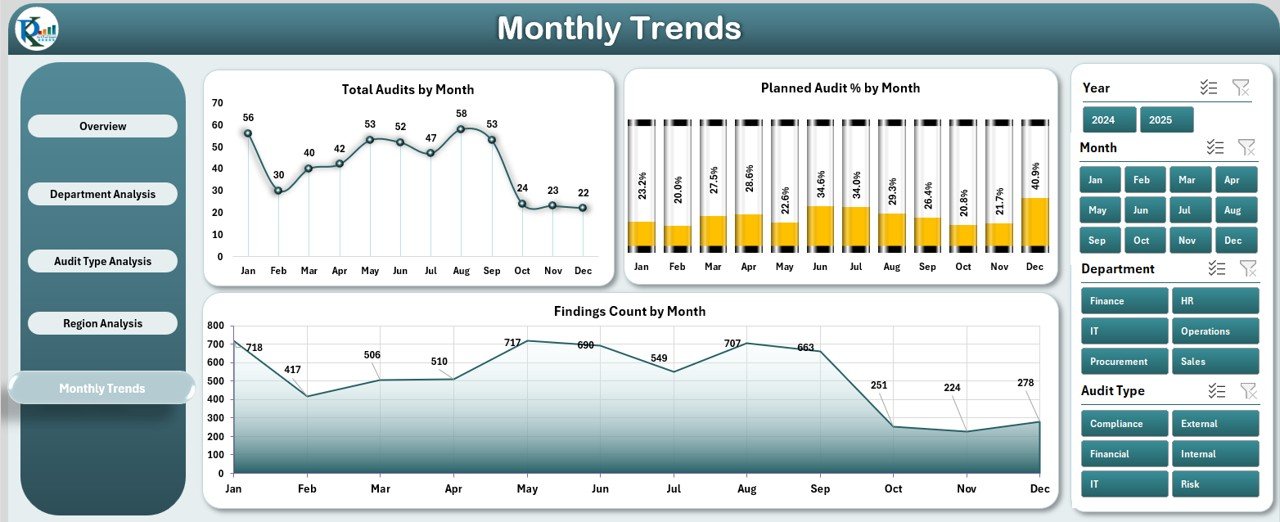
📅 5. Monthly Trends – Monitor Progress Over Time
Visualize audit activity and results on a time scale to detect trends and patterns.
Charts Include:
-
Total Audits by Month
-
Planned Audit % by Month
-
Finding Count by Month
-
Total Financial Impact (USD) by Month
💡 Ideal for evaluating seasonal audit patterns or performance consistency throughout the year.
📘 Support and Data Sheets
-
Data Sheet: Store audit data such as Audit ID, Department, Region, Audit Type, Auditor, Findings, and Financial Impact.
-
Support Sheet: Manage dropdown lists and slicer data for smooth automation and accuracy.
Once you update the data, the entire dashboard recalculates automatically.
🚀 Why Use Excel for Audit & Internal Controls?
✅ Simple Interface: No complex training or software needed.
✅ Automated Insights: Charts and KPIs refresh with one click.
✅ Flexible Design: Modify visuals, layouts, or KPIs easily.
✅ Cost-Effective: Zero license costs — built fully in Excel.
✅ Visual Clarity: Interactive, color-coded visuals simplify audit interpretation.
👨💼 Who Can Benefit from This Dashboard?
📋 Internal Audit Teams – Monitor progress and findings efficiently.
💼 Finance & Risk Departments – Analyze financial impact and risk levels.
⚖️ Compliance Officers – Track adherence to regulations and controls.
🏢 External Auditors – Visualize client data and share reports easily.
📊 Executives – Gain transparency into organizational risk management.
🌟 Advantages of Using the Audit & Internal Controls Dashboard in Excel
✅ Centralized audit tracking across departments and regions.
✅ Real-time KPI updates for faster decisions.
✅ Improved accuracy and transparency in audit results.
✅ Time-saving automation for report generation.
✅ Fully customizable layout for your organization’s needs.
🔗 Click here to read the Detailed blog post
📺 Visit our YouTube channel for step-by-step tutorials
👉 YouTube.com/@PKAnExcelExpert


Reviews
There are no reviews yet.