
Managing investments across multiple asset classes, fund types, regions, and client segments is never simple. Asset management companies deal with large volumes of financial data every day, and when this data remains scattered across multiple spreadsheets and static reports, decision-making becomes slow and risky. Important insights get missed, profitability trends stay hidden, and risk exposure becomes difficult to control.
That is exactly where the Asset Management Companies Dashboard in Excel becomes a powerful and practical solution 🚀.
This ready-to-use Excel dashboard helps asset managers, portfolio managers, analysts, and finance teams track, analyze, and visualize key investment and financial performance metrics from a single Excel file. Instead of manually calculating figures or preparing multiple reports, users get instant insights through interactive charts, KPI cards, and slicers.
Because the dashboard is built entirely in Microsoft Excel, it remains affordable, flexible, and easy to customize—without any need for Power BI or advanced technical skills.
⭐ Key Features of Asset Management Companies Dashboard in Excel
This dashboard is designed specifically for the real-world needs of asset management companies.
🧭 Page Navigator for Easy Navigation
A smart Page Navigator on the left side allows users to move instantly between analytical pages. As a result, users save time and focus directly on insights instead of scrolling through sheets.
🎛 Interactive Slicers
Right-side slicers allow instant filtering by:
-
Region
-
Asset Class
-
Fund Type
-
Client Segment
-
Month
Therefore, performance analysis becomes fast, flexible, and highly focused.
📊 KPI Cards for Instant Performance View
The dashboard displays five high-level KPI cards on the Overview page, giving decision-makers an immediate snapshot of overall performance.
📌 What’s Inside the Asset Management Companies Dashboard in Excel
This dashboard includes five structured analytical pages, each adding unique business value.
🏠 Overview Page – Business Performance at a Glance
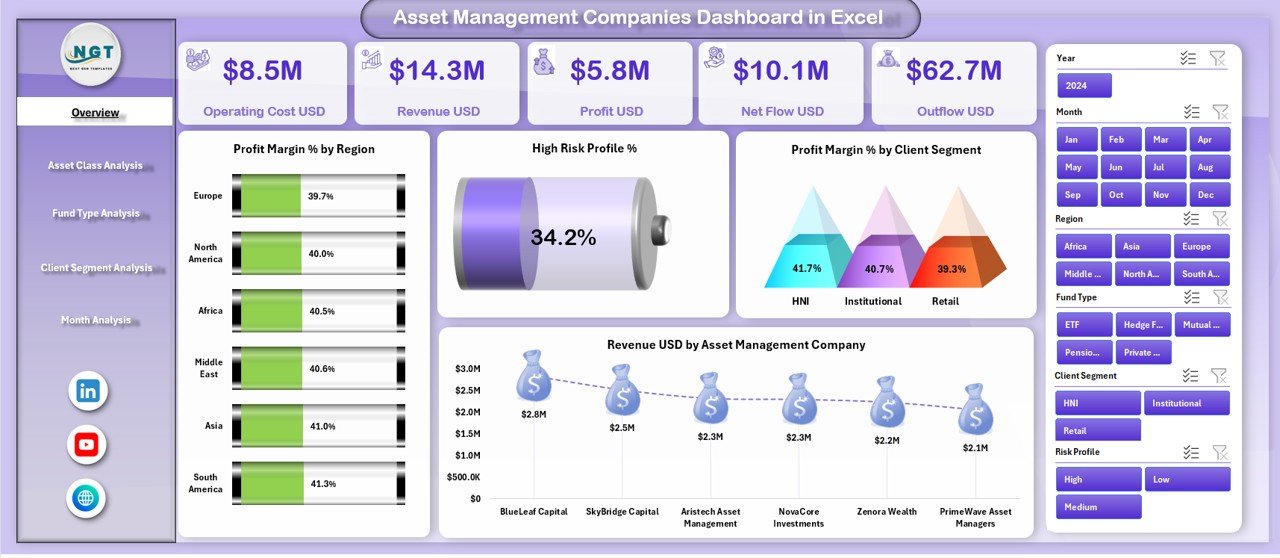
The Overview Page acts as the command center of the dashboard.
📈 Charts on the Overview Page
-
📊 Profit Margin % by Region – Identify the most and least profitable regions
-
⚠️ High Risk Profit % – Understand exposure to high-risk investments
-
👥 Profit Margin % by Client Segment – Compare profitability across client types
-
💰 Revenue USD by Asset Management Company – Benchmark revenue performance
Together, these visuals deliver instant clarity on profitability, risk, and revenue.
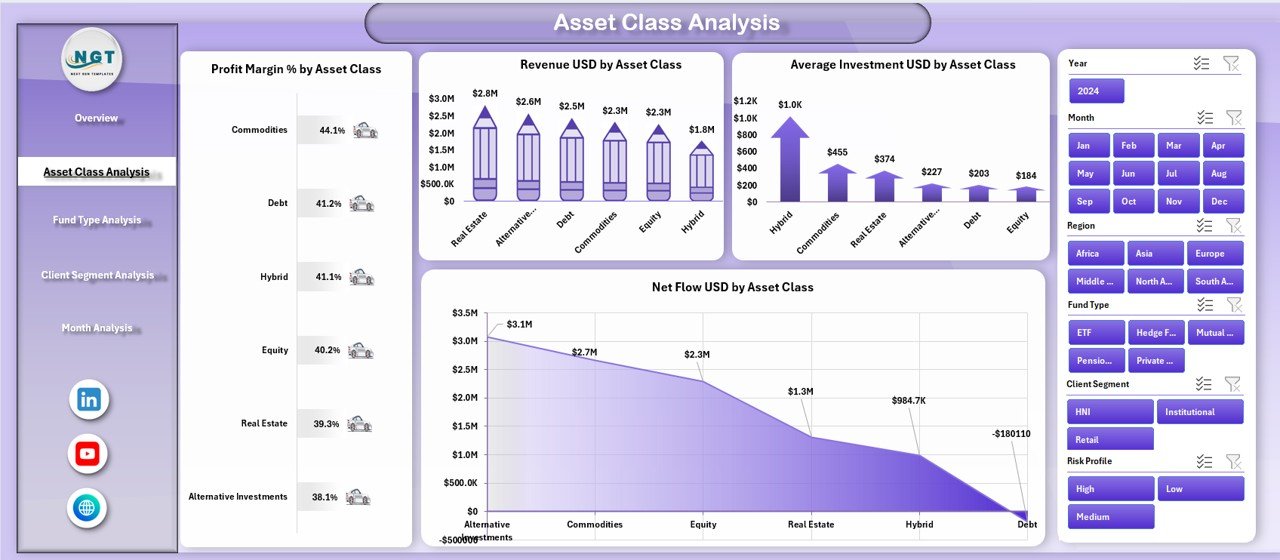
📂 Asset Class Analysis – Smarter Portfolio Decisions
The Asset Class Analysis Page focuses on performance across asset categories.
📊 Charts Included
-
📈 Profit Margin % by Asset Class
-
💵 Revenue USD by Asset Class
-
📉 Average Investment USD by Asset Class
-
🔄 Net Flow USD by Asset Class
As a result, portfolio managers can optimize asset allocation using real data instead of assumptions.
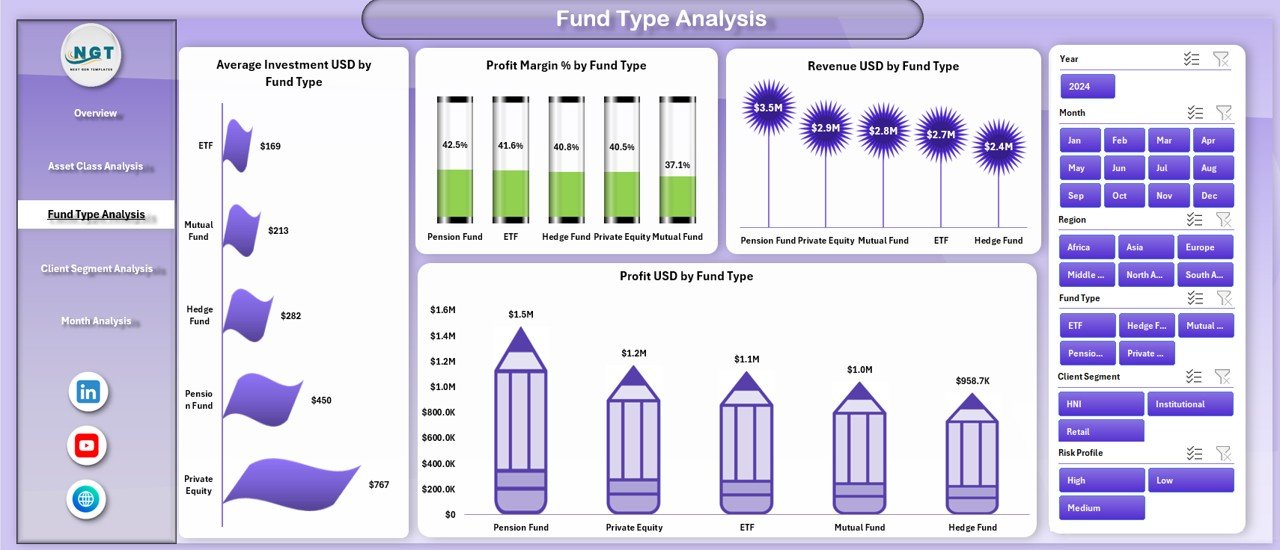
🏦 Fund Type Analysis – Understand Fund Performance
Different fund types behave differently. This page highlights those differences clearly.
📊 Charts Included
-
💼 Average Investment USD by Fund Type
-
📊 Profit Margin % by Fund Type
-
💰 Revenue USD by Fund Type
-
🧮 Profit USD by Fund Type
Therefore, fund managers can refine strategies based on profitability and investor behavior.
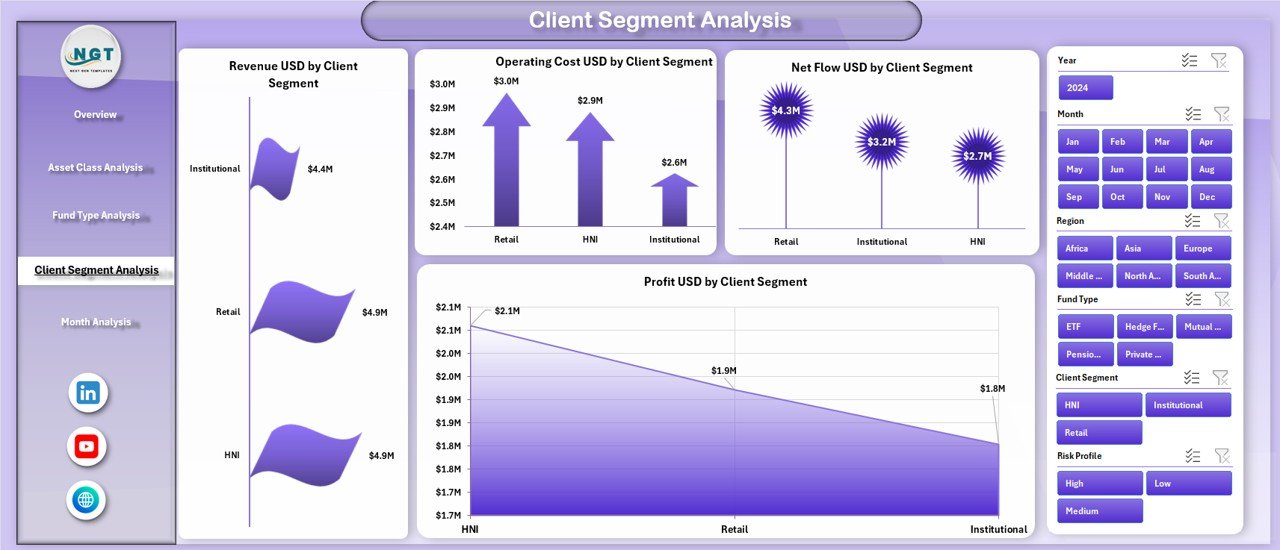
👤 Client Segment Analysis – Improve Client Profitability
Client behavior directly impacts revenue stability and margins.
📊 Charts Included
-
💵 Revenue USD by Client Segment
-
🧾 Operating Cost USD by Client Segment
-
🔄 Net Flow USD by Client Segment
-
📈 Profit USD by Client Segment
As a result, organizations improve pricing models and client relationship strategies.
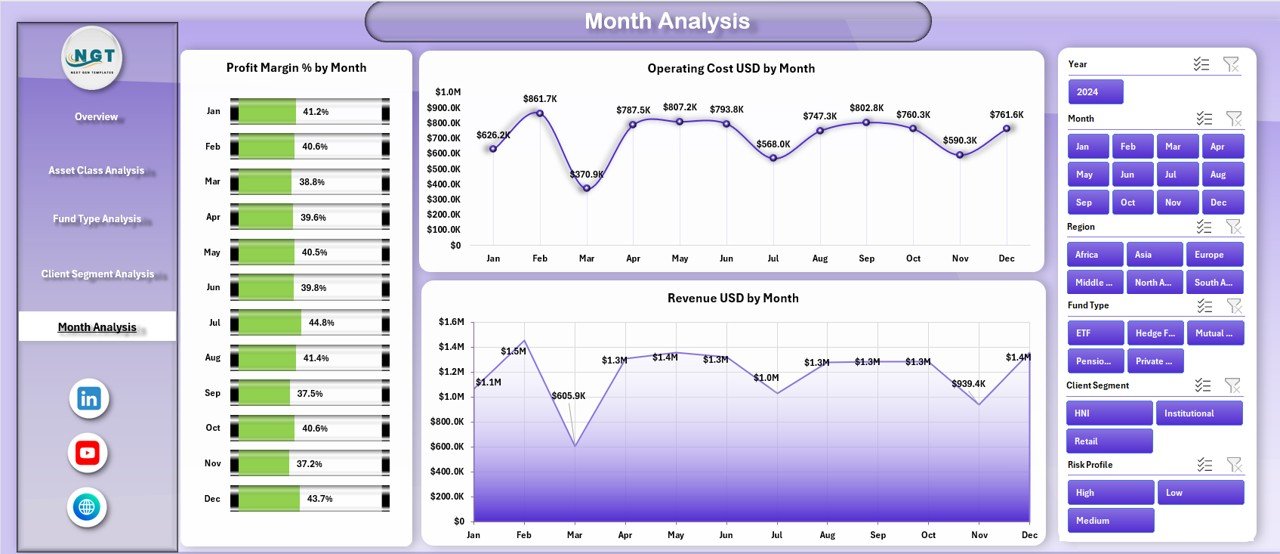
📅 Month Analysis – Track Trends Over Time
The Month Analysis Page focuses on time-based performance trends.
📊 Charts Included
-
📈 Profit Margin % by Month
-
💸 Operating Cost USD by Month
-
💰 Revenue USD by Month
This page supports forecasting, budgeting, and trend analysis.
⚙️ How to Use the Asset Management Companies Dashboard in Excel
1️⃣ Update the data table with latest figures
2️⃣ Use slicers to filter by region, asset class, or client
3️⃣ Review KPI cards for quick insights
4️⃣ Analyze detailed pages for deeper understanding
5️⃣ Use results for reporting, strategy, and reviews
👥 Who Can Benefit from This Dashboard
-
Asset Managers
-
Portfolio Managers
-
Investment Analysts
-
Finance & Accounting Teams
-
Risk Management Teams
-
Senior Leadership
### Click here to read the Detailed blog post
📺 Visit our YouTube channel to learn step-by-step video tutorials
👉 https://youtube.com/@PKAnExcelExpert


Reviews
There are no reviews yet.