Artificial Intelligence is rapidly changing how modern organizations operate, automate processes, and make strategic decisions. However, deploying AI solutions alone is not enough. Businesses must continuously monitor performance, efficiency, costs, and user experience to ensure AI systems deliver real value. Without structured monitoring, organizations often face rising costs, slow performance, and unclear outcomes.
The Artificial Intelligence (AI) Dashboard in Power BI is a powerful, ready-to-use analytics solution designed to transform complex AI operational data into clear, actionable insights. This interactive dashboard enables organizations to track AI performance, evaluate model efficiency, monitor operational costs, and analyze performance trends — all from one centralized reporting platform.
Built using Power BI’s advanced visualization capabilities, this dashboard converts technical AI metrics into easy-to-understand visuals, helping both technical and non-technical stakeholders make confident, data-driven decisions.
Whether you manage AI automation, machine learning models, chatbot systems, or intelligent analytics platforms, this dashboard provides the visibility needed to optimize performance and maximize AI investments.
🚀 Key Feature of Artificial Intelligence (AI) Dashboard in Power BI
✅ Interactive multi-page dashboard for complete AI monitoring
✅ Real-time KPI tracking including latency, throughput, and success rate
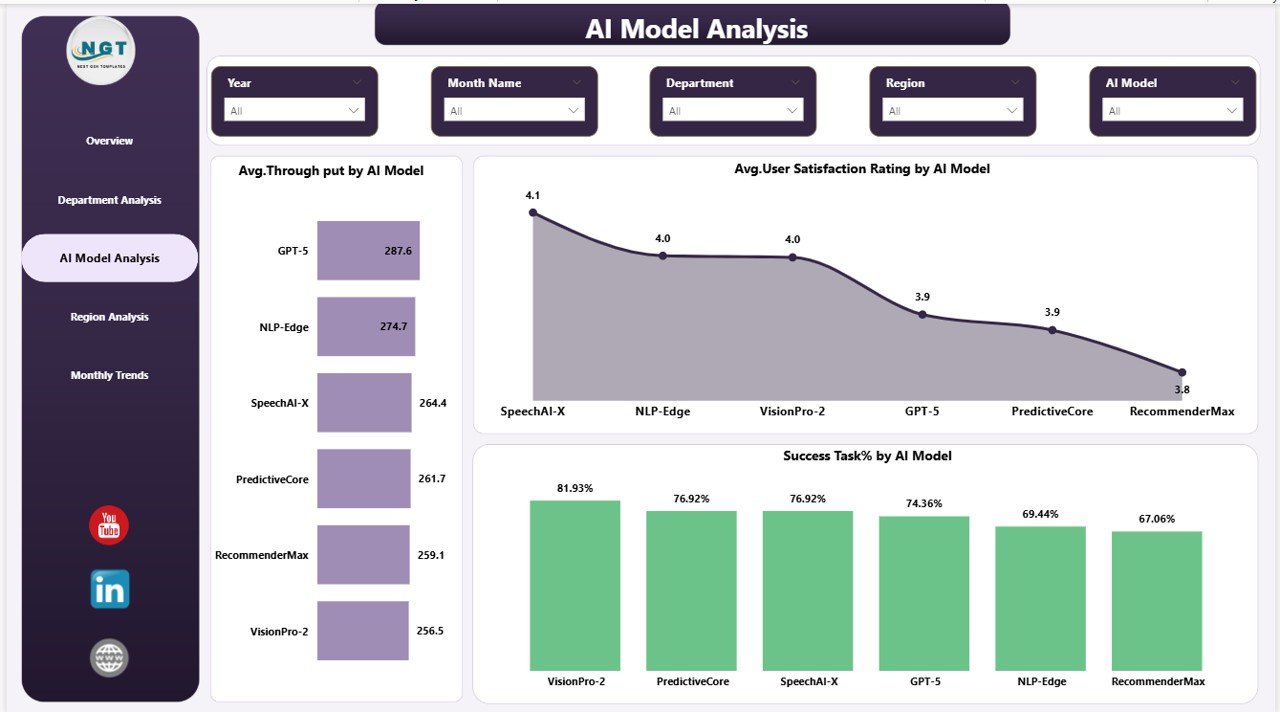
✅ AI model performance comparison for optimization decisions
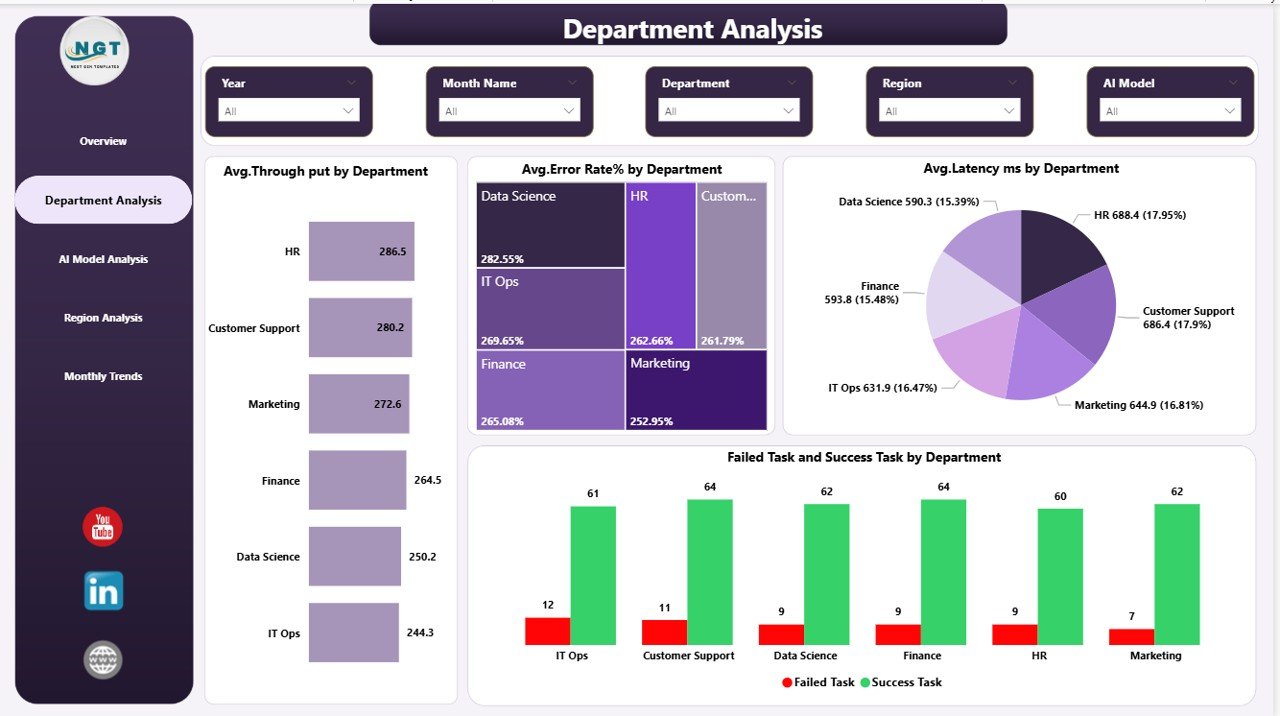
✅ Department-wise efficiency analysis
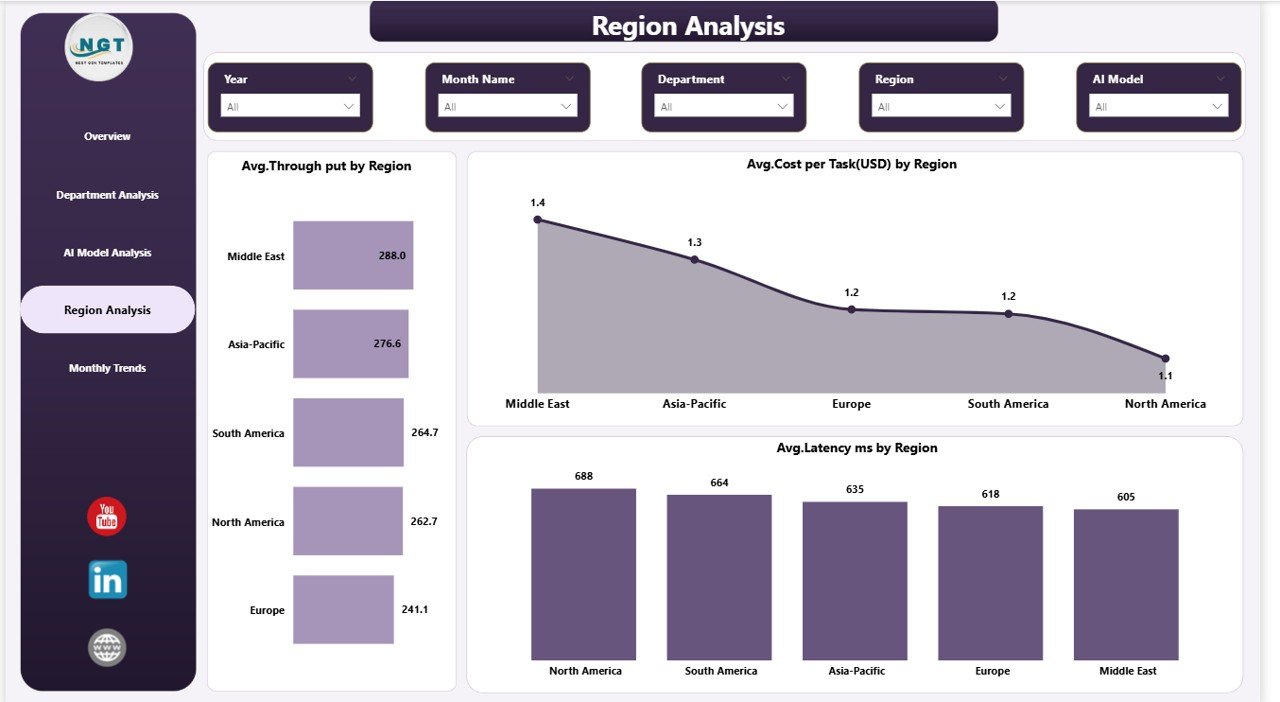
✅ Regional performance monitoring for global operations
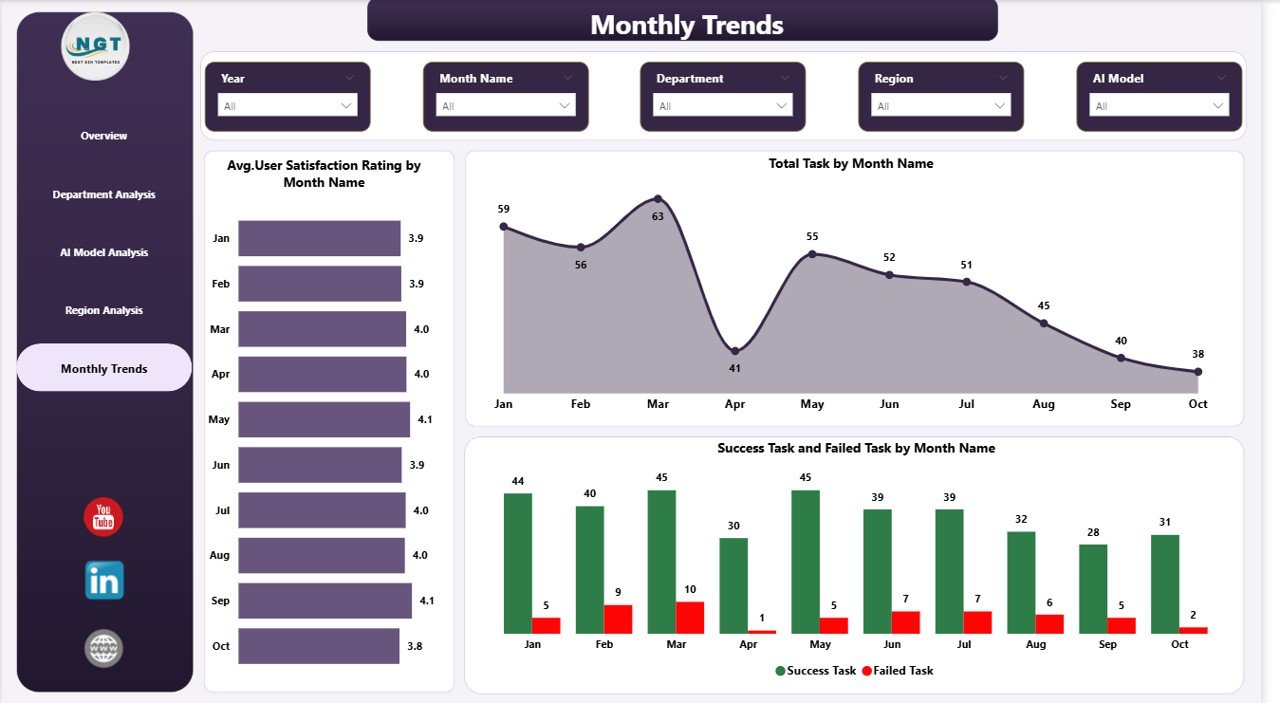
✅ Monthly trend analysis to identify performance patterns
✅ Cost per task tracking for financial control
✅ User satisfaction monitoring for experience improvement
✅ Dynamic filters and slicers for instant analysis
✅ Executive-ready visuals for faster decision-making
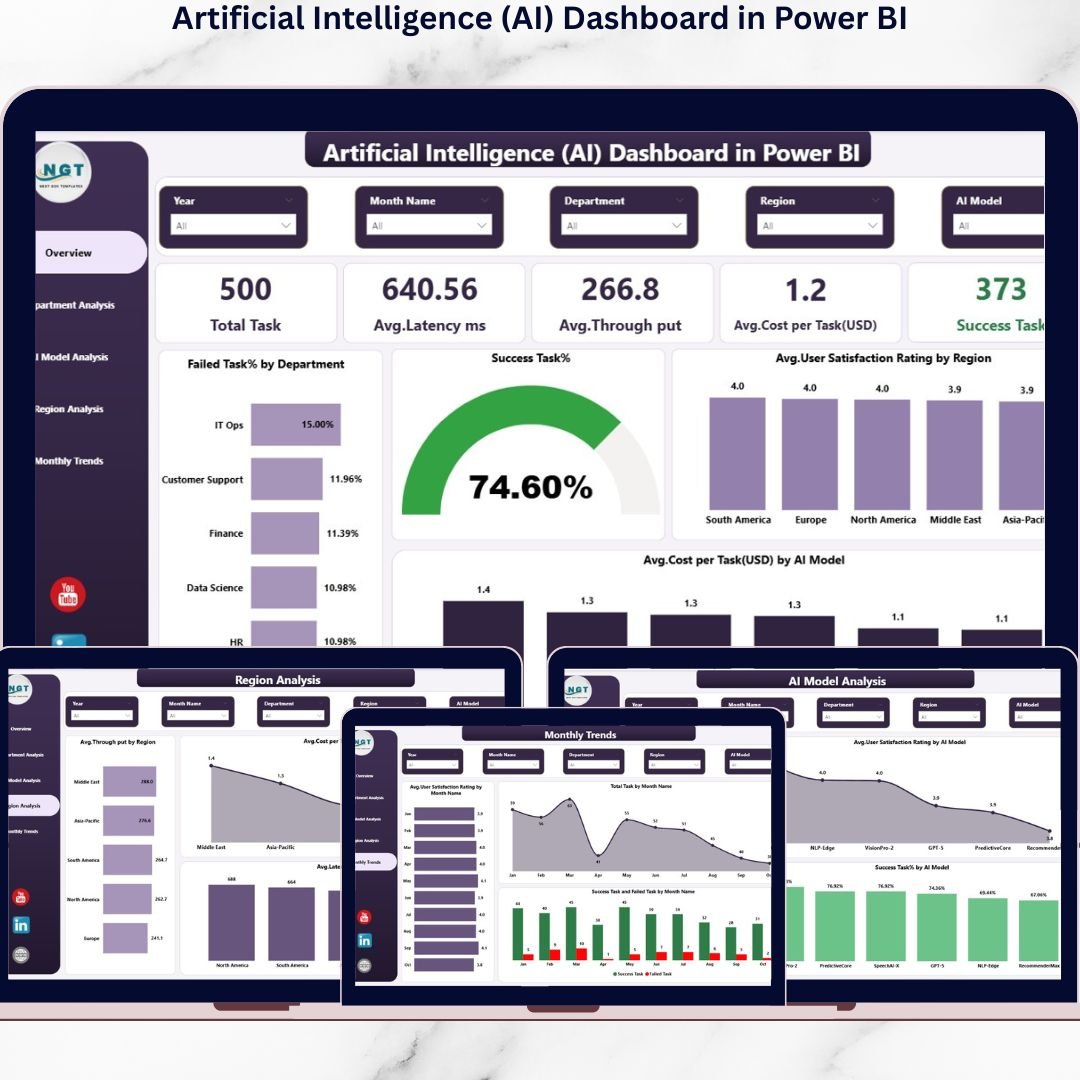
📊 What’s Inside the Artificial Intelligence (AI) Dashboard in Power BI
This professionally designed dashboard includes five powerful analytical pages:
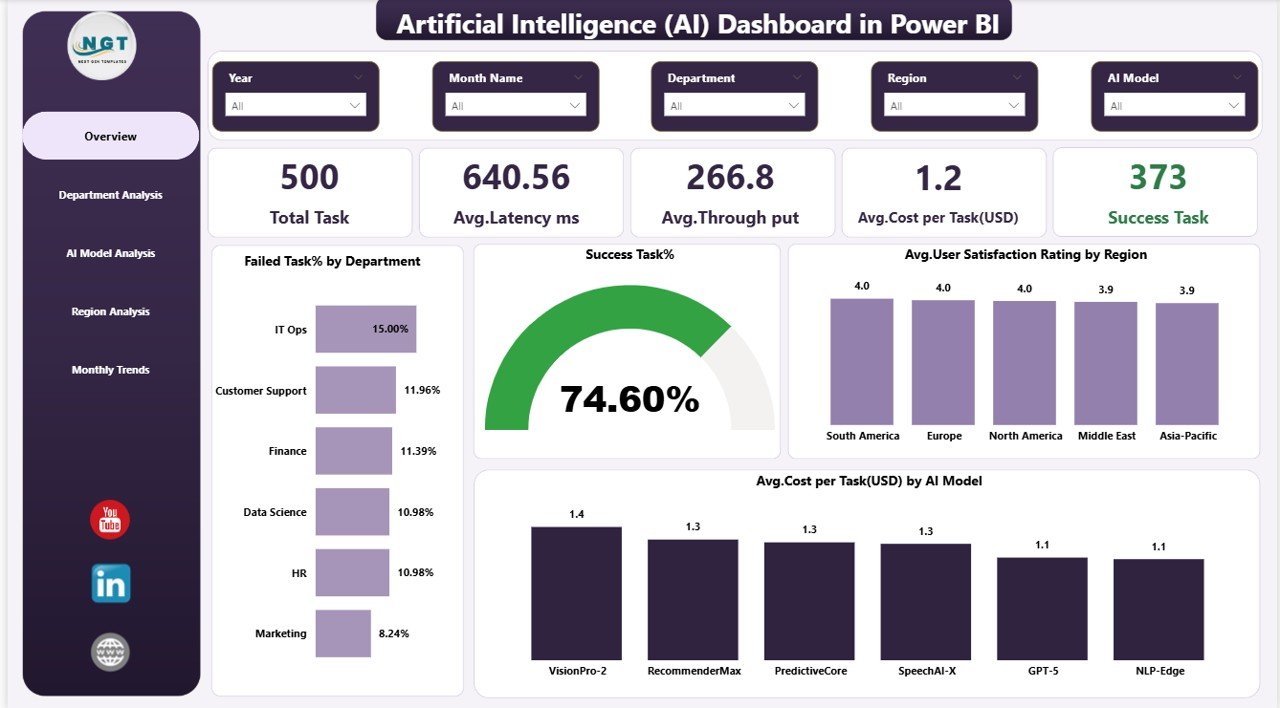
Overview Page – Central performance hub displaying key KPIs such as Total Tasks, Latency, Throughput, Costs, and Success Rate.
Department Analysis – Compare AI efficiency across departments and identify operational bottlenecks quickly.
AI Model Analysis – Evaluate multiple AI models to determine high-performing and cost-efficient solutions.
Region Analysis – Analyze geographic performance differences and optimize infrastructure deployment.
Monthly Trends Page – Monitor historical performance trends and detect risks or improvements early.
Each page is built for pivot-style interactive exploration using Power BI visuals and filters.
⚙️ How to Use the Artificial Intelligence (AI) Dashboard in Power BI
Using the dashboard is simple and requires minimal setup:
1️⃣ Import your AI operational dataset into Power BI.
2️⃣ Refresh data connections to update KPIs automatically.
3️⃣ Use slicers to filter by department, region, or AI model.
4️⃣ Analyze KPIs through interactive charts.
5️⃣ Identify performance gaps and optimization opportunities.
6️⃣ Share insights securely with stakeholders using Power BI sharing features.
Within minutes, organizations can transform raw AI data into strategic intelligence.
🎯 Who Can Benefit from This Artificial Intelligence (AI) Dashboard
This dashboard is ideal for multiple professional roles:
👨💼 Business Leaders – Measure AI ROI and operational efficiency
🧠 Data Scientists – Compare and optimize AI models
💻 IT Teams – Monitor infrastructure and performance reliability
📈 Operations Managers – Improve departmental productivity
🛍 Product Managers – Track user satisfaction and service quality
🏢 Enterprise Organizations – Govern AI systems with transparency
From startups to large enterprises, anyone managing AI systems can benefit from structured performance analytics.
By combining operational KPIs, financial insights, and user experience metrics into one intelligent dashboard, this solution helps organizations move from reactive monitoring to proactive optimization. Instead of guessing AI performance, teams gain measurable insights that drive smarter decisions, lower costs, and improved outcomes.
The Artificial Intelligence (AI) Dashboard in Power BI turns AI operations into visible, controllable, and scalable business assets — empowering organizations to unlock the true potential of artificial intelligence.
Click here to read the Detailed blog post
Watch the step-by-step video tutorial:
Visit our YouTube channel to learn step-by-step video tutorials:
👉 YouTube channel