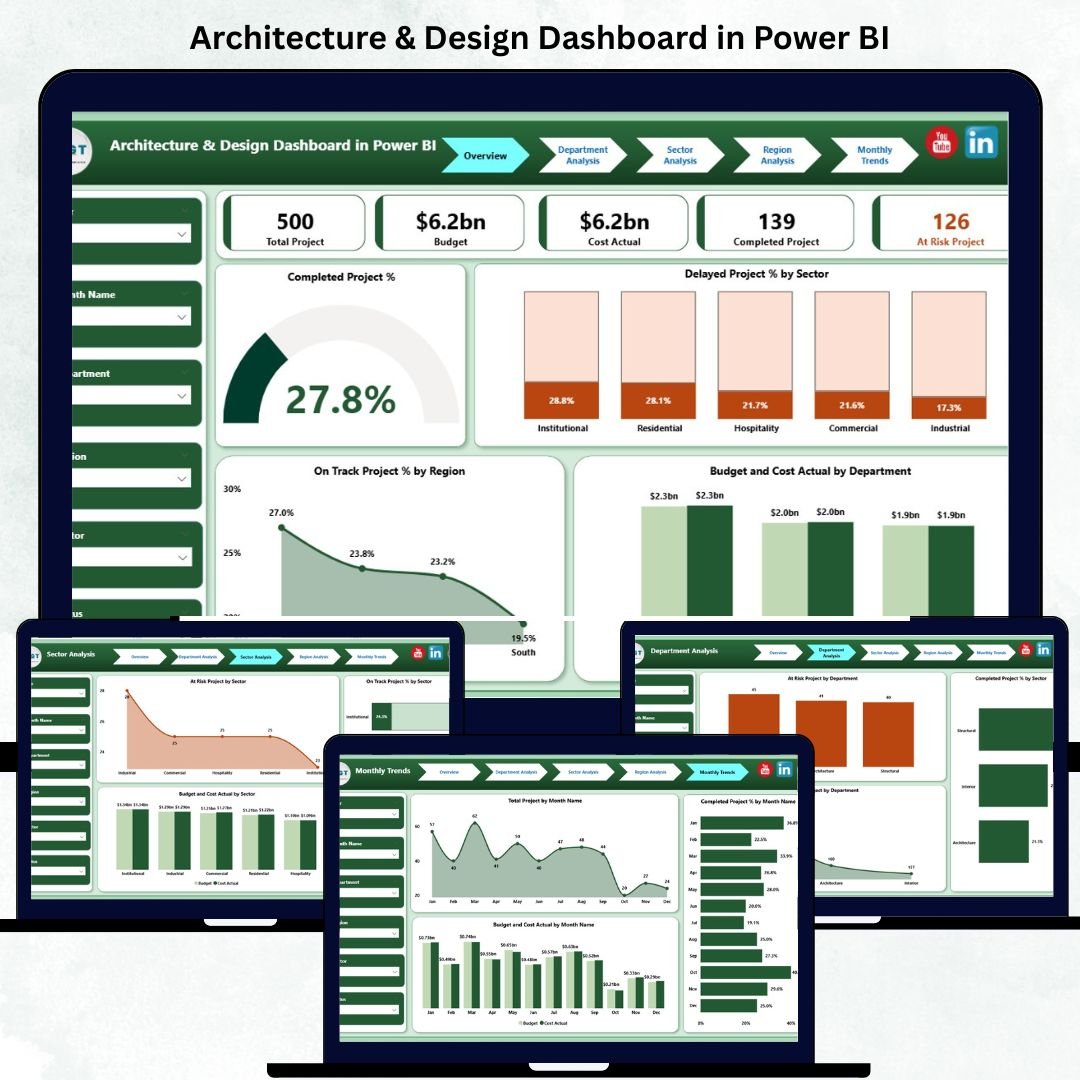
🏛️ Architecture and design firms juggle dozens of complex projects—each with its own budgets, deadlines, and design phases. Without a proper analytics system, tracking progress and costs can quickly become chaotic. That’s why the Architecture & Design Dashboard in Power BI is a must-have solution for every modern design organization.
This ready-to-use dashboard turns your scattered project data into interactive visuals, enabling architects, designers, and project managers to monitor KPIs in real time. Built on Microsoft Power BI, it provides transparency, accountability, and efficiency—everything your firm needs to stay creative and profitable.
✨ Key Features of the Architecture & Design Dashboard in Power BI
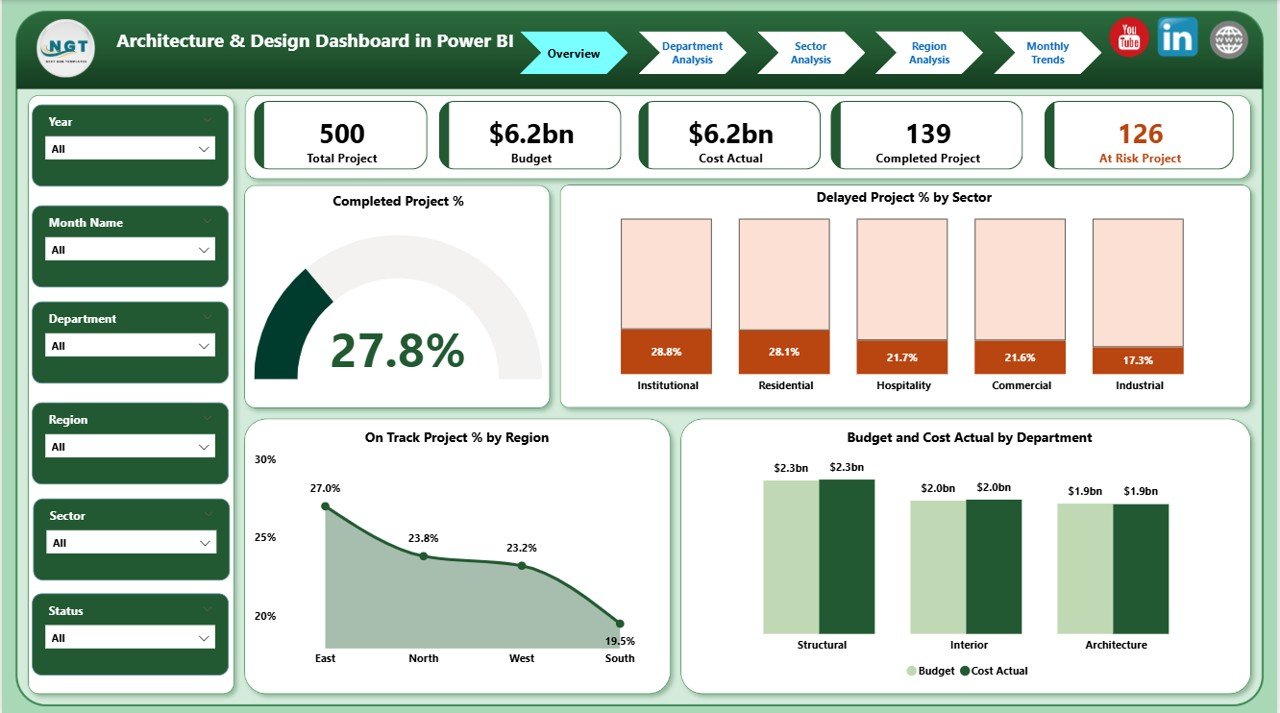
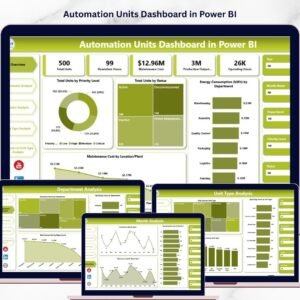
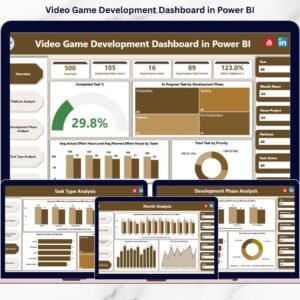
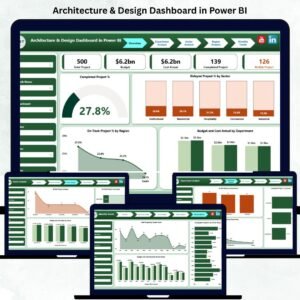
✅ 📊 Comprehensive Overview Page – See the big picture instantly!
Includes cards for Total Projects, Completed %, Delayed %, Total Budget (USD), and Actual Cost (USD).
Dynamic charts visualize completion by sector, delay by sector, on-track projects by region, and budget vs actual costs by department.
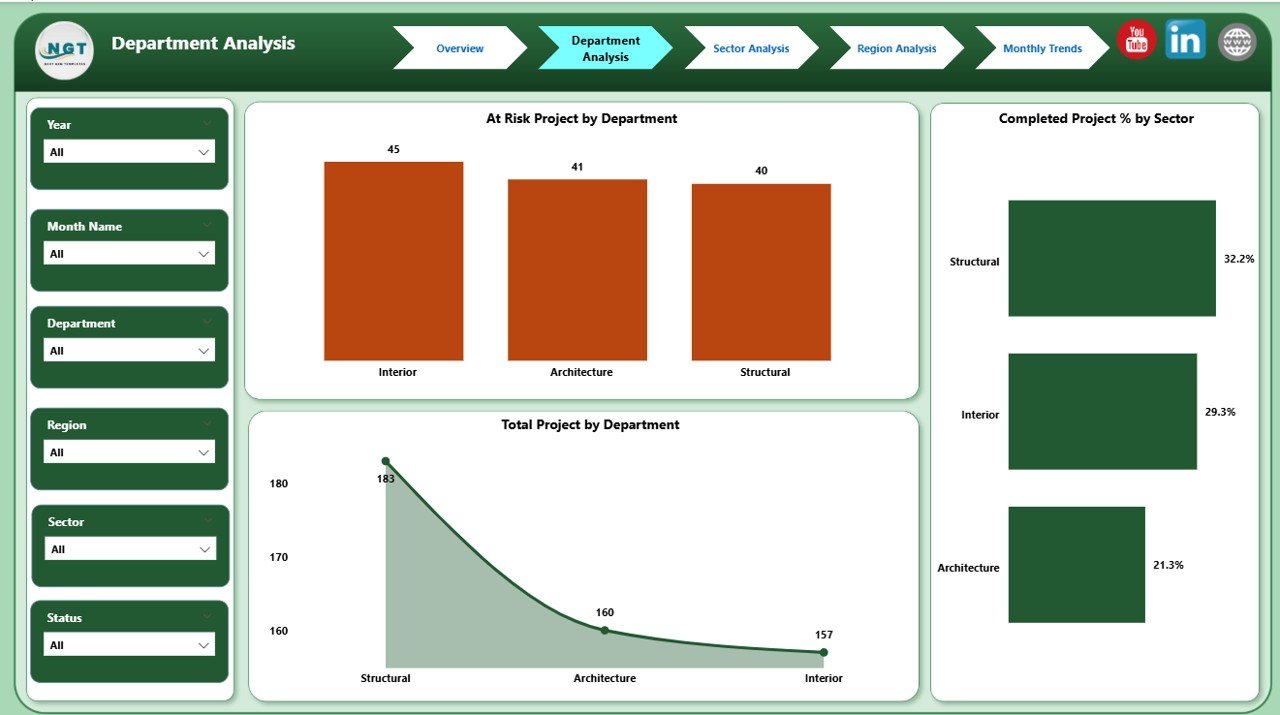
✅ 🏢 Department Analysis Page – Compare departmental performance with visuals like:
• At-Risk Projects by Department
• Completed Project % by Sector
• Total Projects by Department
Identify resource bottlenecks and optimize team efficiency.
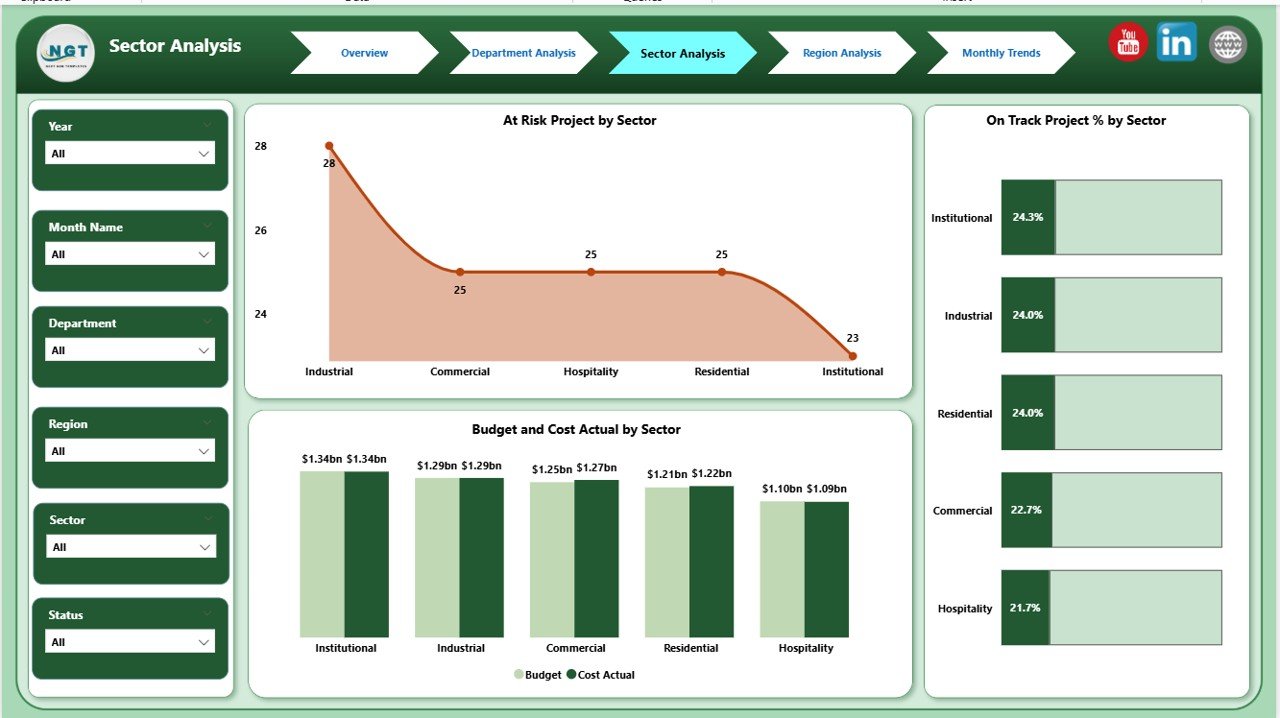
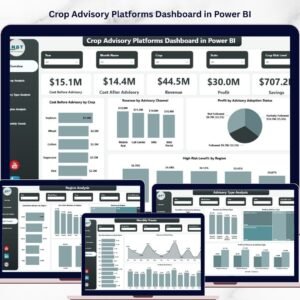
✅ 🏗️ Sector Analysis Page – Evaluate how each sector (commercial, residential, institutional, public works) performs.
Track At-Risk, On-Track Projects, and Budget vs Cost by Sector to discover which segments drive profitability.
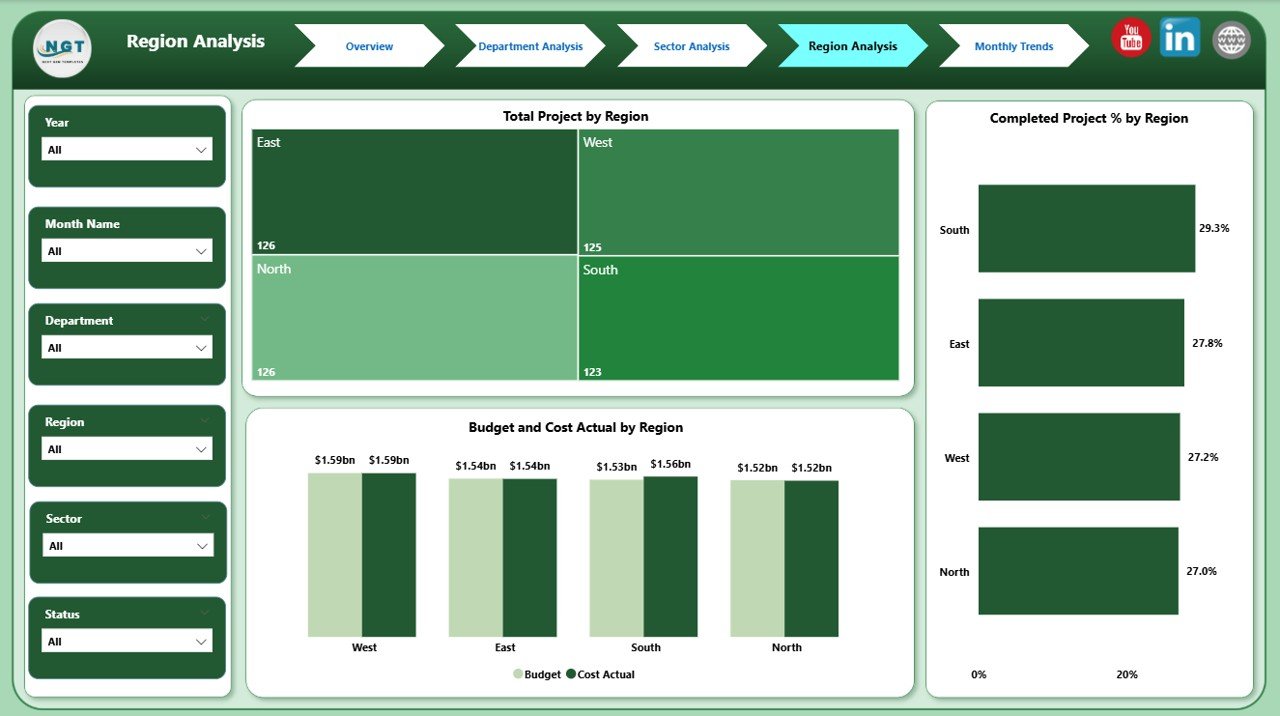
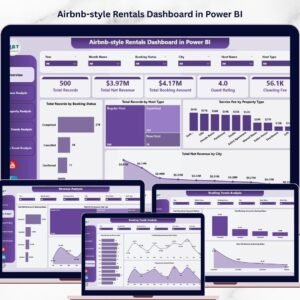
✅ 🌍 Region Analysis Page – Compare performance and costs across regions.
Visuals like Total Projects, Completed %, and Budget vs Actual by Region help balance workloads and budgets.
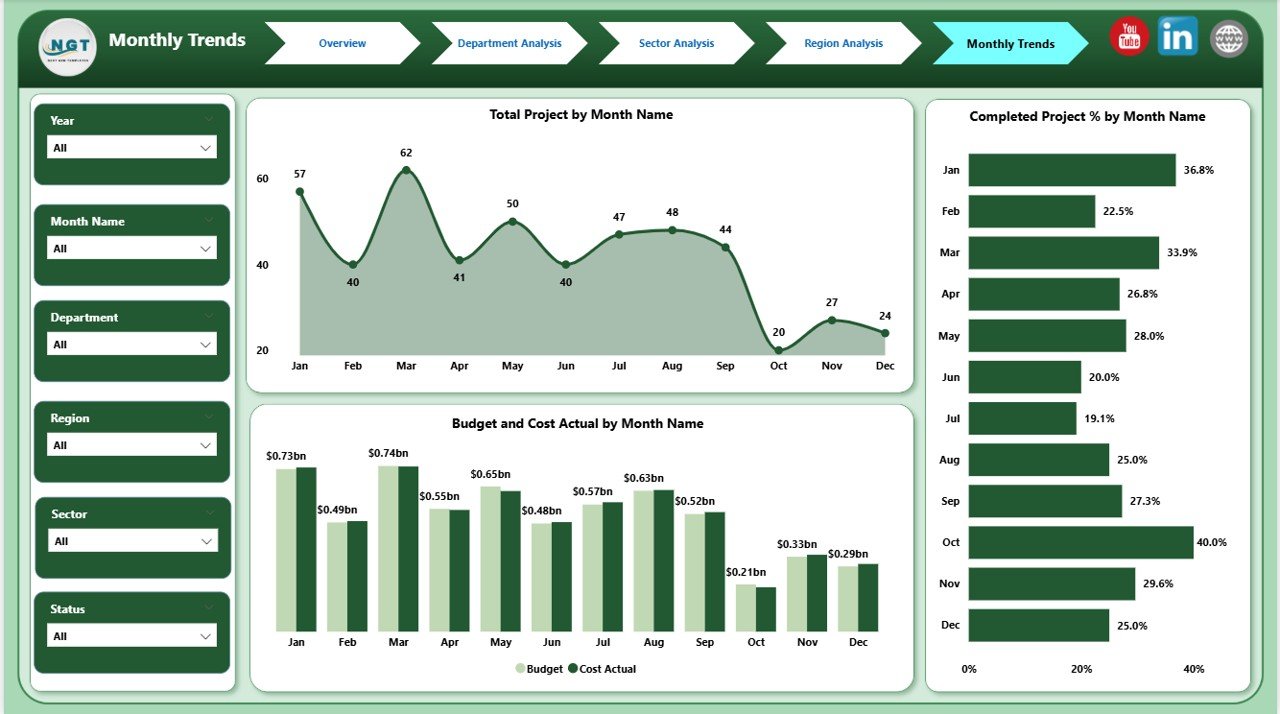
✅ 📅 Monthly Trends Page – Monitor patterns in project completion, cost variance, and budget usage throughout the year.
Spot seasonal fluctuations to forecast resources better.
✅ ⚙️ Automated Data Refresh & Dynamic Filters – Power BI automatically updates visuals from Excel or database inputs. Use slicers for sector, department, and region to customize views instantly.
✅ 🧱 Customizable and Scalable – Modify KPIs, colors, and layouts to fit your firm’s branding or reporting needs.
✅ 🔒 Secure Cloud Sharing – Publish your dashboard to Power BI Service for collaboration with executives, clients, and project teams — with role-based permissions.
📦 What’s Inside the Architecture & Design Dashboard
📁 Five Professional Analytical Pages:
1️⃣ Overview Page – Summarizes organization-wide performance.
2️⃣ Department Analysis Page – Drills down into team efficiency and output.
3️⃣ Sector Analysis Page – Compares performance by industry segment.
4️⃣ Region Analysis Page – Evaluates geographic profitability and delivery rates.
5️⃣ Monthly Trends Page – Reveals time-based patterns for forecasting and planning.
📊 Built-In Metrics and Visuals:
-
Project Completion %
-
Delayed Projects %
-
Budget vs Actual Spending
-
Cost Variance by Department
-
Sector and Regional Breakdowns
💡 Optimized Design:
-
Pre-modeled data relationships between Projects, Departments, Sectors, and Regions
-
Conditional color formatting for on-track (🟢), at-risk (🟡), and delayed (🔴) statuses
-
Drill-through filters for faster analysis
⚙️ How to Use the Architecture & Design Dashboard
1️⃣ Connect your Excel or database project file to Power BI.
2️⃣ Open the dashboard and review the Overview Page for a quick snapshot of all projects.
3️⃣ Explore Department, Sector, and Region Pages to compare performance metrics.
4️⃣ Use Monthly Trends to identify patterns and improve forecasting.
5️⃣ Share interactive dashboards with stakeholders via Power BI Service.
💡 Pro Tip: Set automatic data refresh and establish KPI targets for budget variance and completion rates to ensure timely performance tracking.
👥 Who Can Benefit from This Dashboard
🏛️ Architecture Firms – Monitor all projects and budgets in one dashboard.
🎨 Design Consultancies – Track creative and technical team performance.
🏗️ Engineering Firms – Oversee sector-wise project progress and costs.
💰 Project Managers & Executives – Make data-driven decisions faster.
🌍 Multiregional Organizations – Compare results across branches and countries.
📈 Data Analysts & Consultants – Deliver insightful reports with visual storytelling.
Whether you manage residential designs or large-scale commercial projects, this Power BI dashboard streamlines your operations for maximum clarity and profitability.
🔗 Click here to read the Detailed Blog Post
🎥 Visit our YouTube channel to learn step-by-step video tutorials


Reviews
There are no reviews yet.