Arbitration and mediation are designed to resolve disputes faster, fairly, and at a lower cost than litigation. However, when case data is scattered across files, registers, and emails, legal teams struggle to measure efficiency, control timelines, and improve outcomes. Without structured KPIs, dispute resolution becomes reactive instead of strategic.
That is exactly where the Arbitration and Mediation KPI Dashboard in Excel delivers powerful value.
This ready-to-use Excel dashboard helps arbitration centers, mediation institutions, and legal teams track key dispute resolution KPIs in one centralized, interactive, and easy-to-use file. Instead of manually reviewing case logs, you can instantly monitor performance, compare results with targets, analyze trends, and identify improvement areas.
Built entirely in Excel, this dashboard offers flexibility, transparency, and clarity—without the need for expensive legal analytics software or advanced technical skills.
🚀 Key Features of Arbitration and Mediation KPI Dashboard in Excel
📊 Centralized KPI Monitoring
Track all arbitration and mediation KPIs in one structured Excel dashboard.
🎯 MTD & YTD Performance Tracking
Monitor Month-to-Date and Year-to-Date results for each KPI.
📈 Target vs Actual Comparison
Instantly identify whether KPIs meet defined performance targets.
🔄 Previous Year Performance Comparison
Analyze improvement or decline using historical data.
📉 Detailed KPI Trend Analysis
View MTD and YTD trend charts for Actual, Target, and Previous Year values.
🧭 Easy Navigation with Home Sheet
Quickly jump to any worksheet using built-in navigation buttons.
🧠 User-Friendly & No Advanced Skills Required
Designed for legal professionals—no complex formulas or tools needed.
⚙️ Fully Customizable & Scalable
Add, remove, or modify KPIs as per organizational needs.
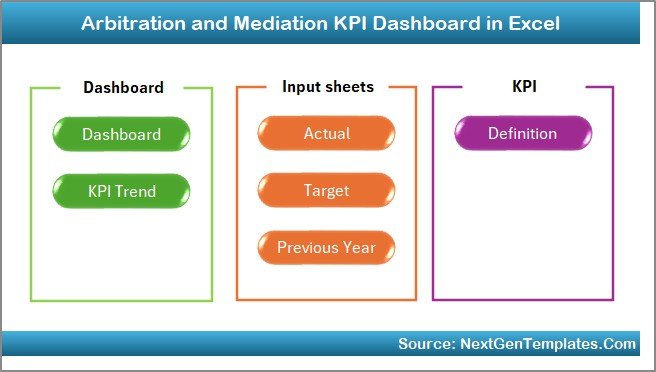
📦 What’s Inside the Arbitration and Mediation KPI Dashboard in Excel
This digital product includes seven professionally designed worksheets, each serving a specific role:
📌 Home Sheet
A central index page with navigation buttons for quick access to all worksheets.
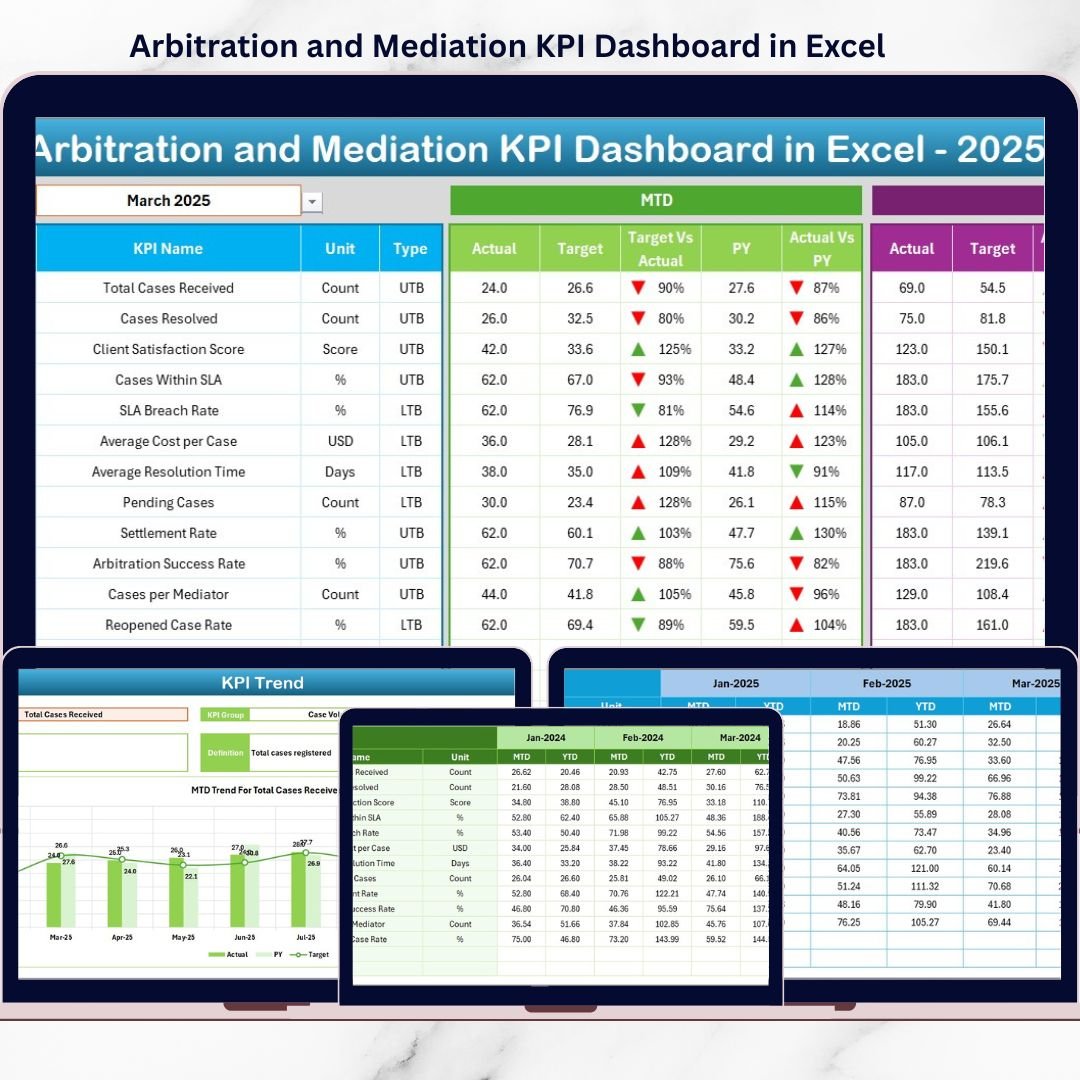
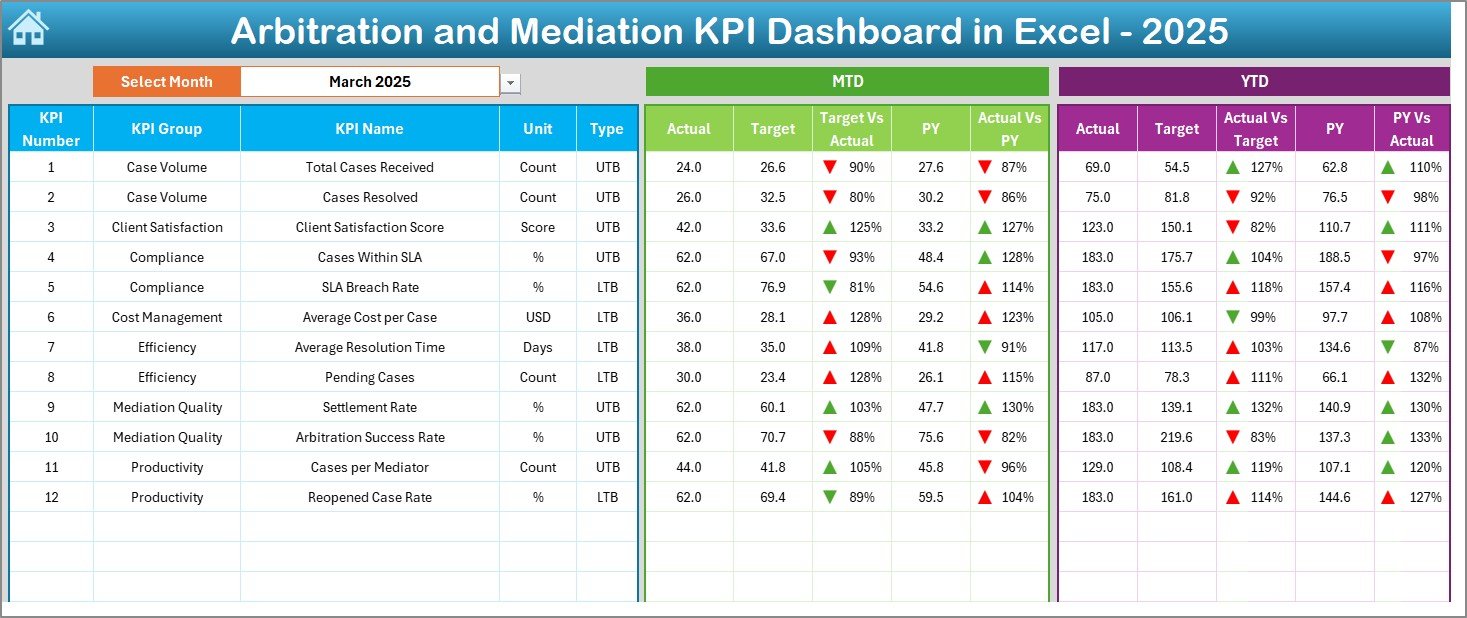
📌 Dashboard Sheet
The main performance view showing:
-
MTD Actual, Target & Previous Year
-
YTD Actual, Target & Previous Year
-
Target vs Actual indicators
-
Conditional formatting with up/down arrows
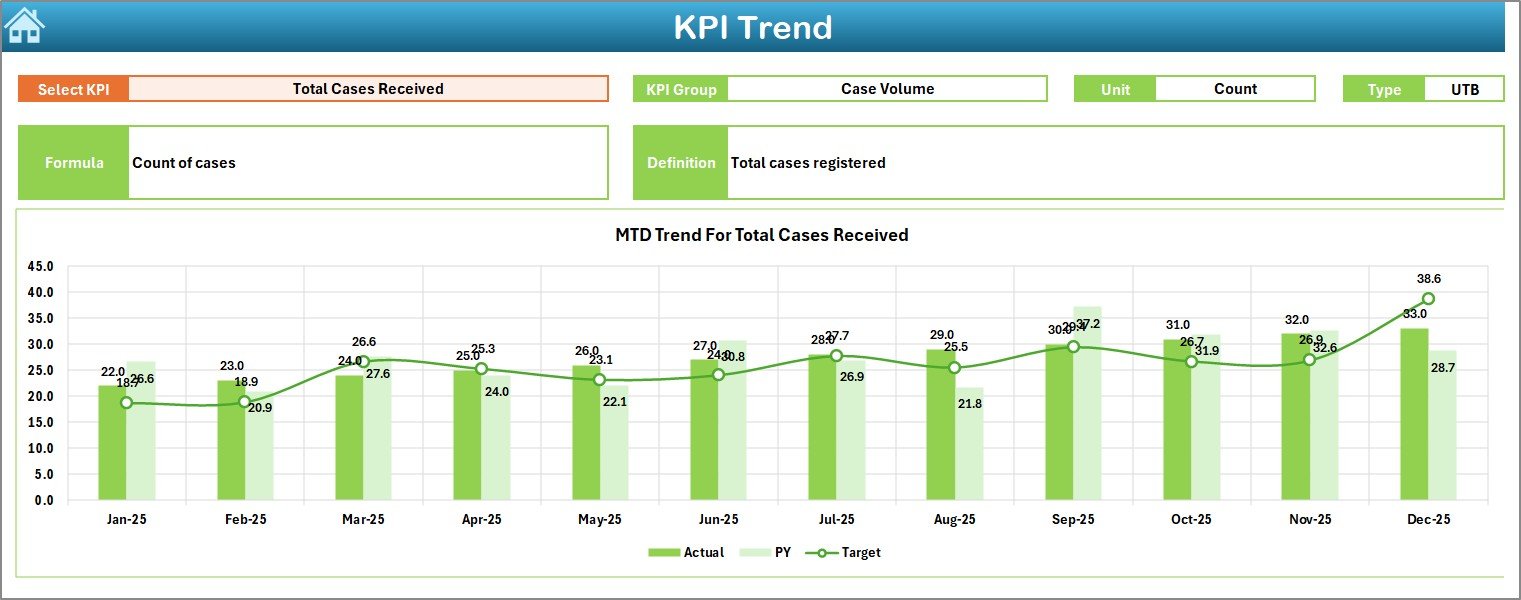
📌 KPI Trend Sheet
Analyze individual KPI performance with:
-
KPI details (Group, Unit, Type, Formula, Definition)
-
MTD trend chart (Actual, Target, PY)
-
YTD trend chart (Actual, Target, PY)
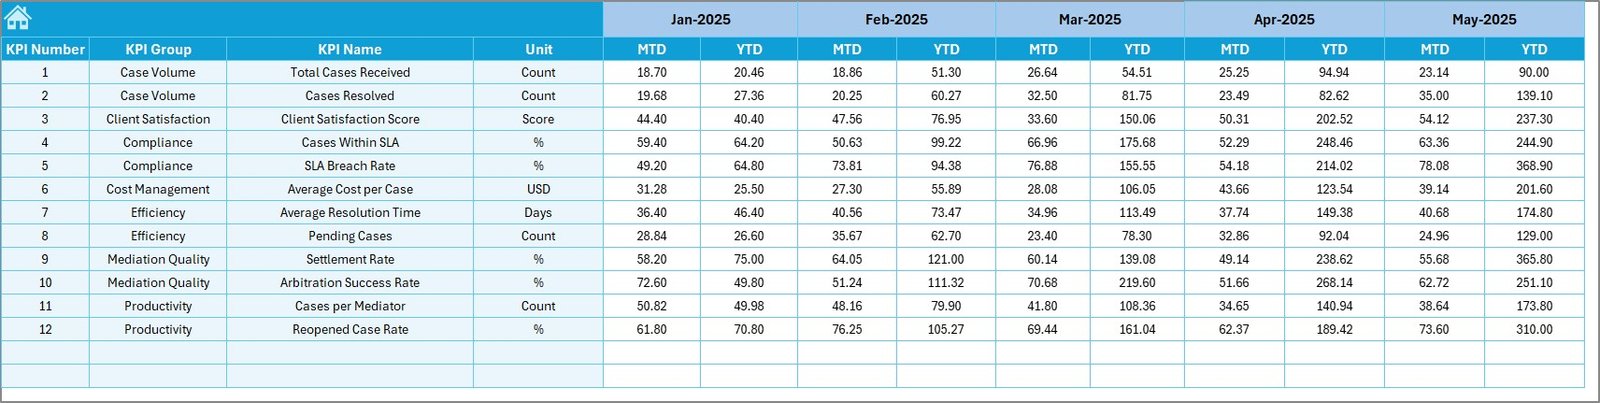
📌 Actual Numbers Input Sheet
Enter MTD and YTD actual values and set the reporting month easily.
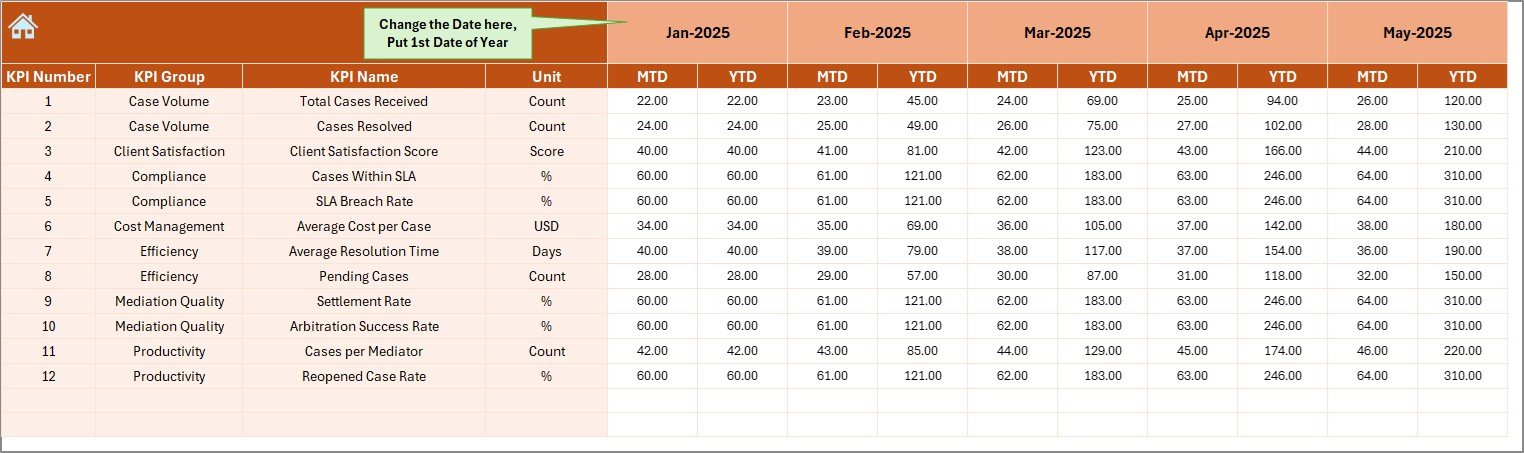
📌 Target Sheet
Define KPI-wise monthly and YTD targets for consistent benchmarking.
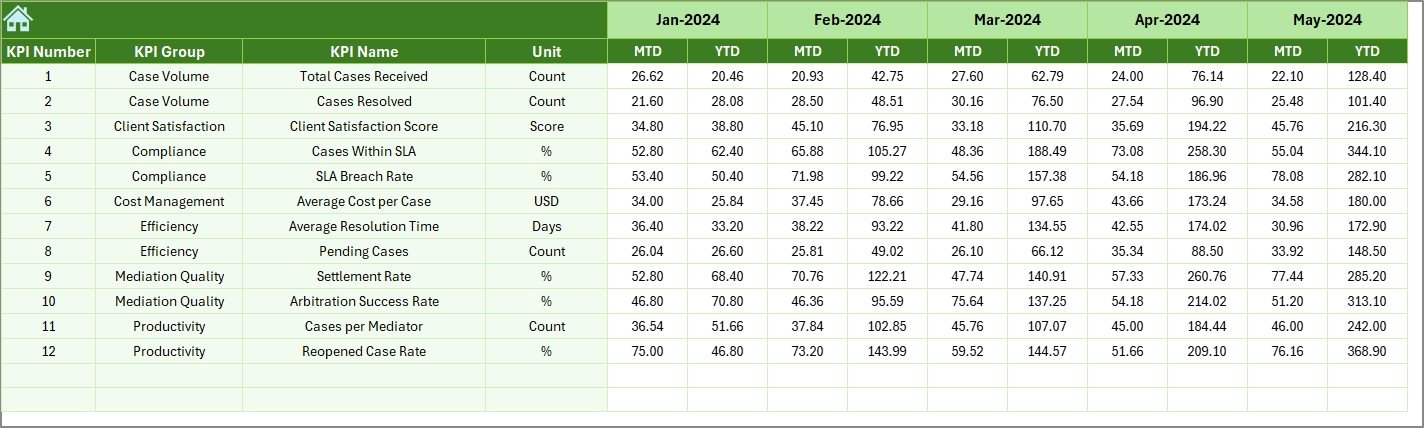
📌 Previous Year Number Sheet
Store historical KPI values for year-over-year comparison.
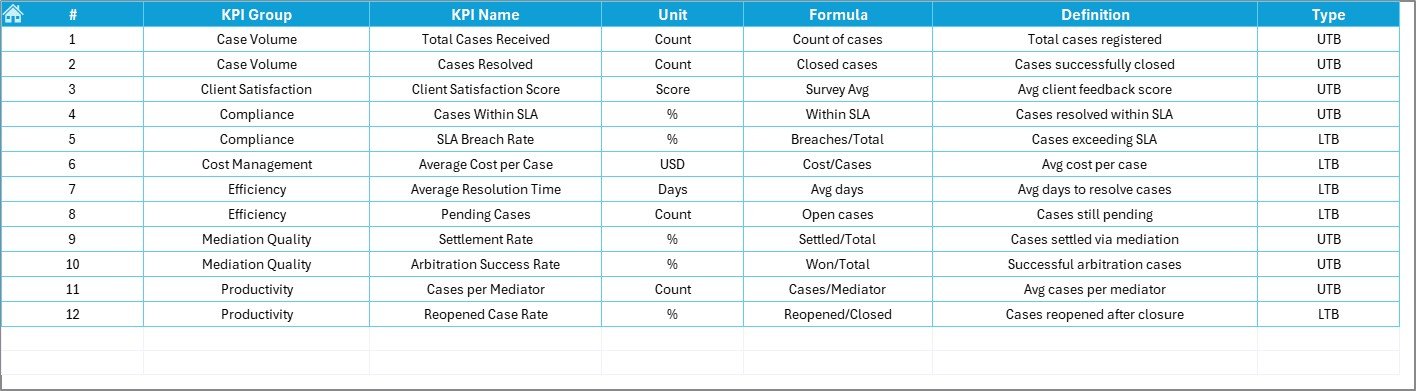
📌 KPI Definition Sheet
A reference guide capturing KPI names, groups, units, formulas, definitions, and KPI type (LTB / UTB).
Together, these sheets ensure clarity, consistency, and reliable performance insights.
🛠️ How to Use the Arbitration and Mediation KPI Dashboard in Excel
Using the dashboard is simple and efficient:
1️⃣ Enter actual case data in the Actual Numbers Input Sheet
2️⃣ Define KPI targets in the Target Sheet
3️⃣ Update previous year values if required
4️⃣ Select the reporting month from dropdowns
5️⃣ Review consolidated results on the Dashboard Sheet
6️⃣ Analyze trends using the KPI Trend Sheet
No setup hassle. No macros. Just update data and analyze instantly.
👥 Who Can Benefit from This Arbitration and Mediation KPI Dashboard
This dashboard is ideal for:
⚖️ Arbitration Centers – Monitor case volume, timelines, and outcomes
🤝 Mediation Institutions – Track settlement success and efficiency
🏢 Legal & Compliance Teams – Improve transparency and accountability
📊 Dispute Resolution Professionals – Analyze workload and performance
🧠 Consultants & Analysts – Deliver structured KPI reporting to clients
🏛️ Small & Large Legal Teams – Gain insights without heavy investments
Because it is Excel-based, it works seamlessly for organizations of all sizes.
🔗 Click here to read the Detailed blog post
🎥 Visit our YouTube channel to learn step-by-step video tutorials
👉 https://youtube.com/@PKAnExcelExpert


Reviews
There are no reviews yet.