The AR and VR gaming industry is evolving at lightning speed. New studios launch immersive titles, platforms expand rapidly, and monetization models shift constantly. However, many AR/VR gaming studios still rely on scattered spreadsheets to track costs, revenue, user engagement, and profitability. As a result, insights remain hidden, reporting becomes slow, and decisions turn reactive instead of strategic.
That’s where the AR/VR Gaming Studios Dashboard in Excel becomes a powerful solution.
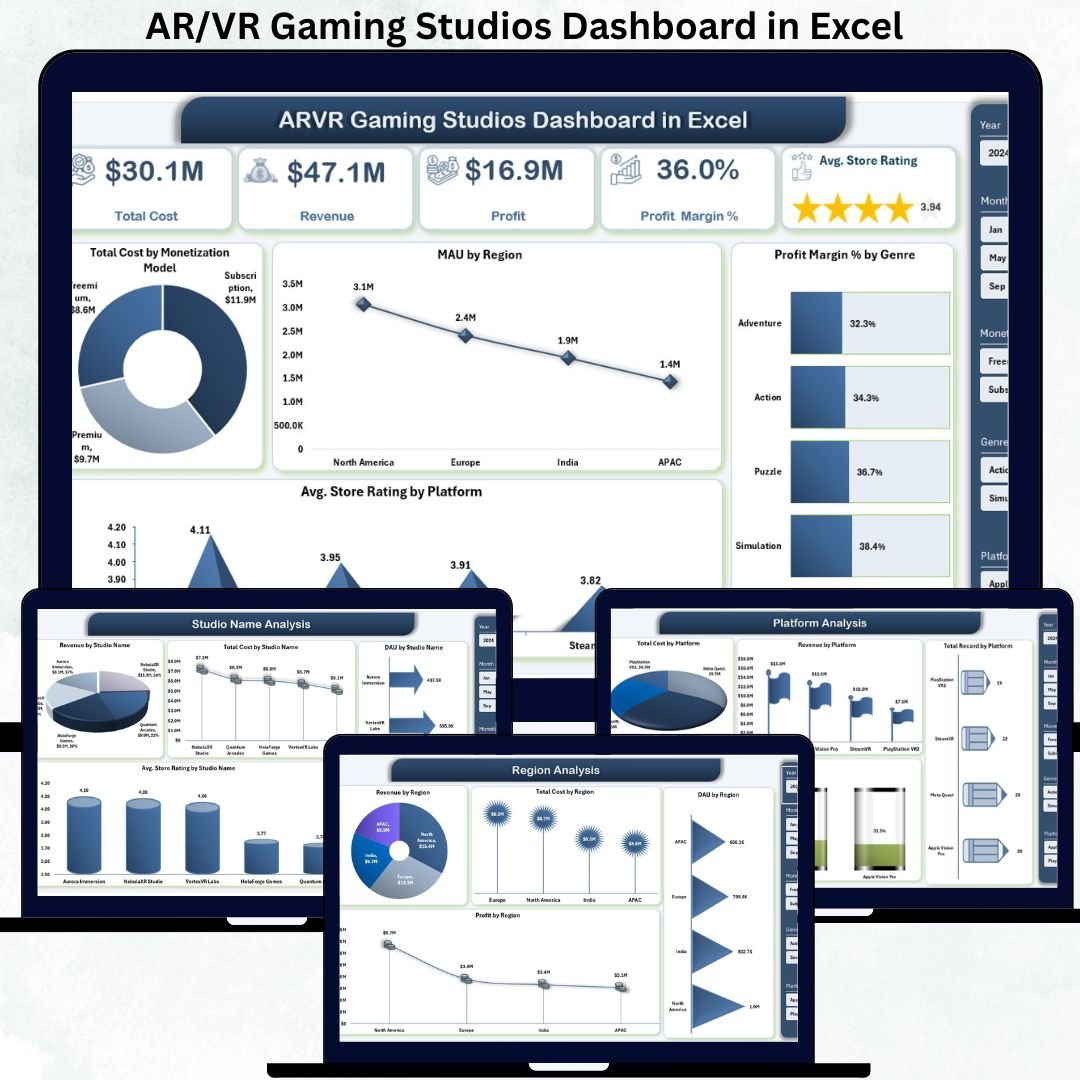
AR/VR Gaming Studios Dashboard in Excel This ready-to-use Excel dashboard is designed specifically for AR and VR gaming studios to monitor financial performance, player engagement, platform success, regional trends, and monthly growth—all from a single, interactive Excel file. Instead of juggling multiple reports, you get one centralized analytics system that converts raw gaming data into clear KPIs and visual insights.
Because the dashboard is built entirely in Excel, studios avoid expensive BI tools while still enjoying dynamic charts, slicers, KPI cards, and professional layouts. Whether you run a single AR/VR studio or manage multiple studios under one portfolio, this dashboard gives you clarity, control, and confidence in every decision 🎯.
Key Features of the AR/VR Gaming Studios Dashboard in Excel ✨
This dashboard is designed to balance simplicity and analytical depth, making it useful for both business and creative teams.
🎯 All-in-One Performance View – Costs, revenue & profit together
📈 User Engagement Tracking – DAU & MAU visibility
🎮 Platform-Wise Performance Analysis – PC VR, Mobile AR, Console & more
🌍 Region-Wise Insights – Identify global growth opportunities
💰 Profit & Margin Analysis – Understand what truly earns money
📊 Monthly Trend Tracking – Spot growth patterns early
🧭 Page Navigator – Seamless movement between dashboard pages
🎛️ Right-Side Slicers – Interactive filtering by studio, region, platform & genre
This is not just a report—it’s a gaming analytics command center.
What’s Inside the AR/VR Gaming Studios Dashboard in Excel 📂
The dashboard contains 5 well-structured analytical pages, each focused on a specific business question.
🎯 1. Overview Page – Complete Studio Performance Snapshot
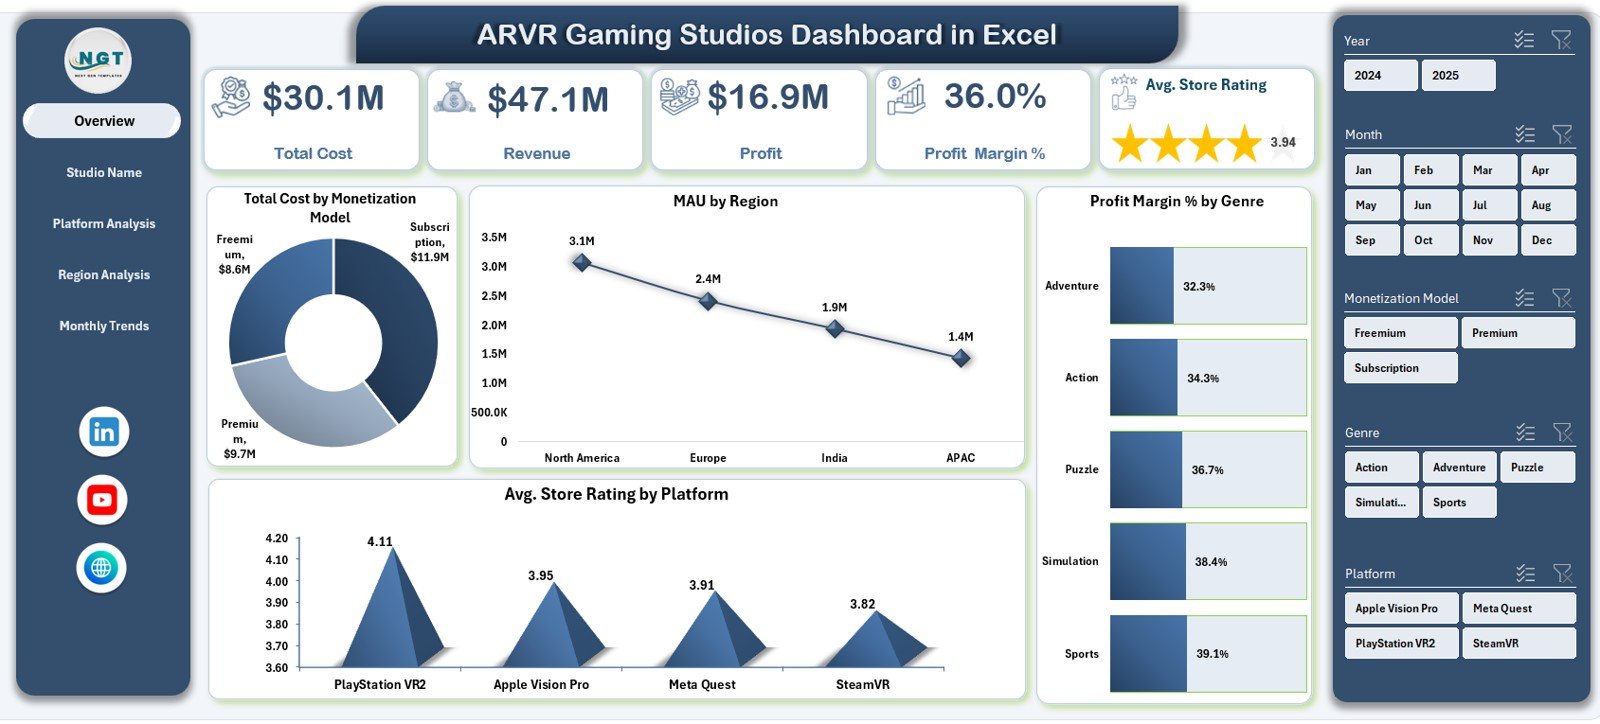
This is the main control panel of the dashboard.
KPI Cards Display:
-
Total Cost
-
Revenue
-
Profit
-
Profit Margin %
-
Average Store Rating
Charts Included:
📊 Total Cost by Monetization Model
🌍 MAU by Region
🎮 Profit Margin % by Genre
⭐ Average Store Rating by Platform
This page gives leadership an instant view of financial health, engagement, and platform performance.
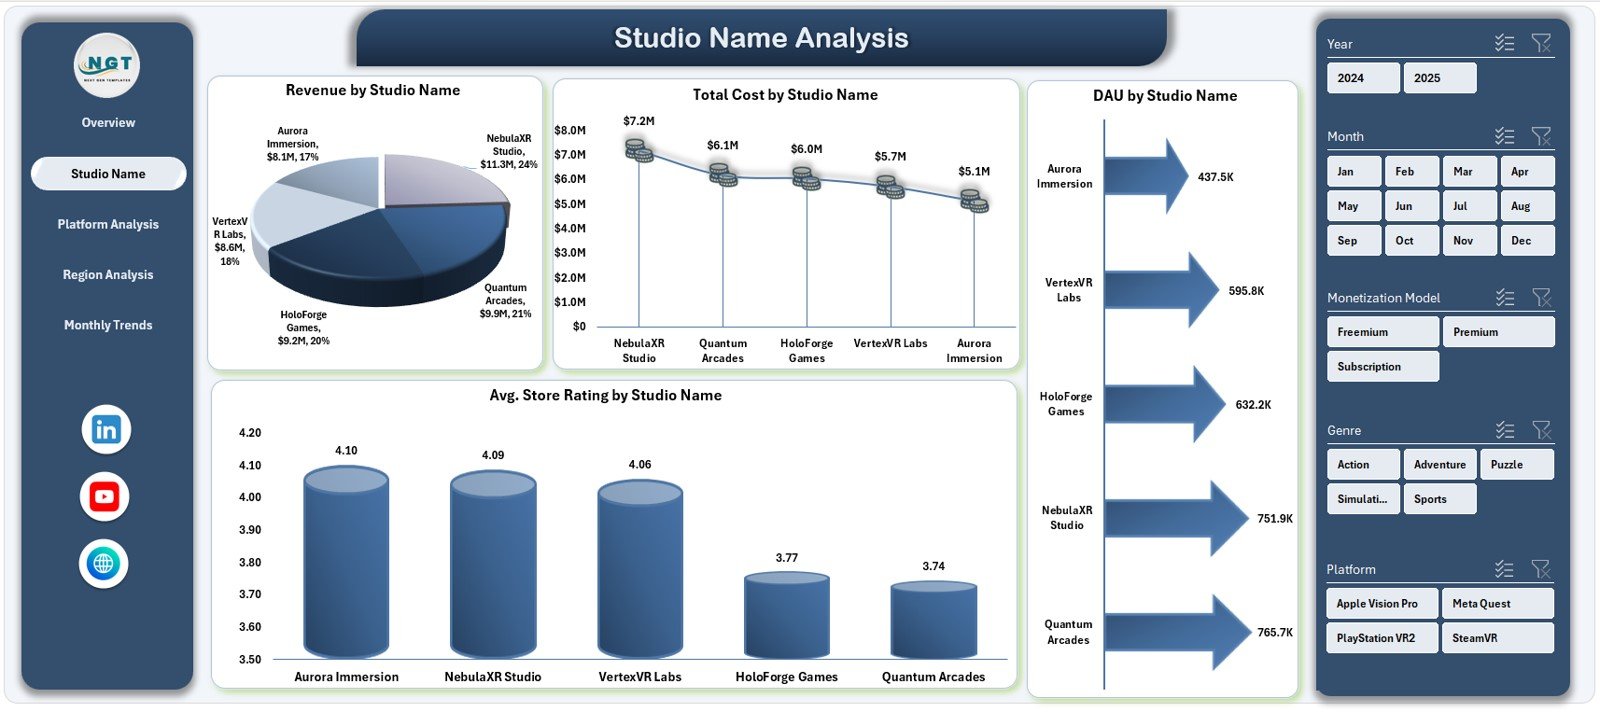
🎮 2. Studio Name Analysis – Compare Studio Performance
This page helps organizations managing multiple gaming studios.
Charts on This Page:
-
Cost vs Revenue by Studio Name
-
Total Cost by Studio Name
-
DAU by Studio Name
-
Average Store Rating by Studio Name
It becomes easy to identify top-performing studios, cost-heavy studios, and engagement leaders.
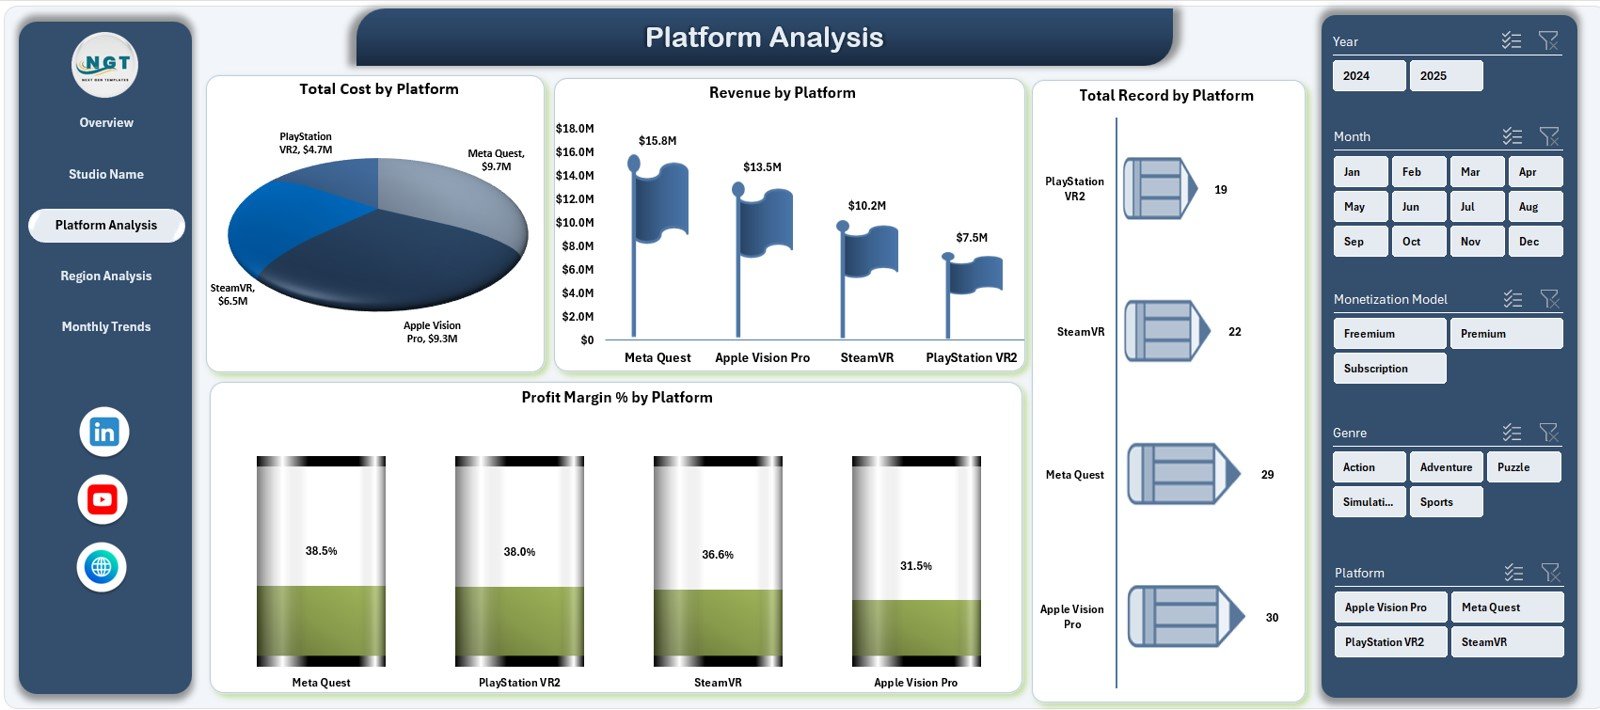
🕹️ 3. Platform Analysis – Where Should You Invest More?
AR/VR games perform differently across platforms.
Charts Included:
-
Total Cost by Platform
-
Revenue by Platform
-
Total Records by Platform
-
Profit Margin % by Platform
This page supports platform investment decisions and optimization strategies.
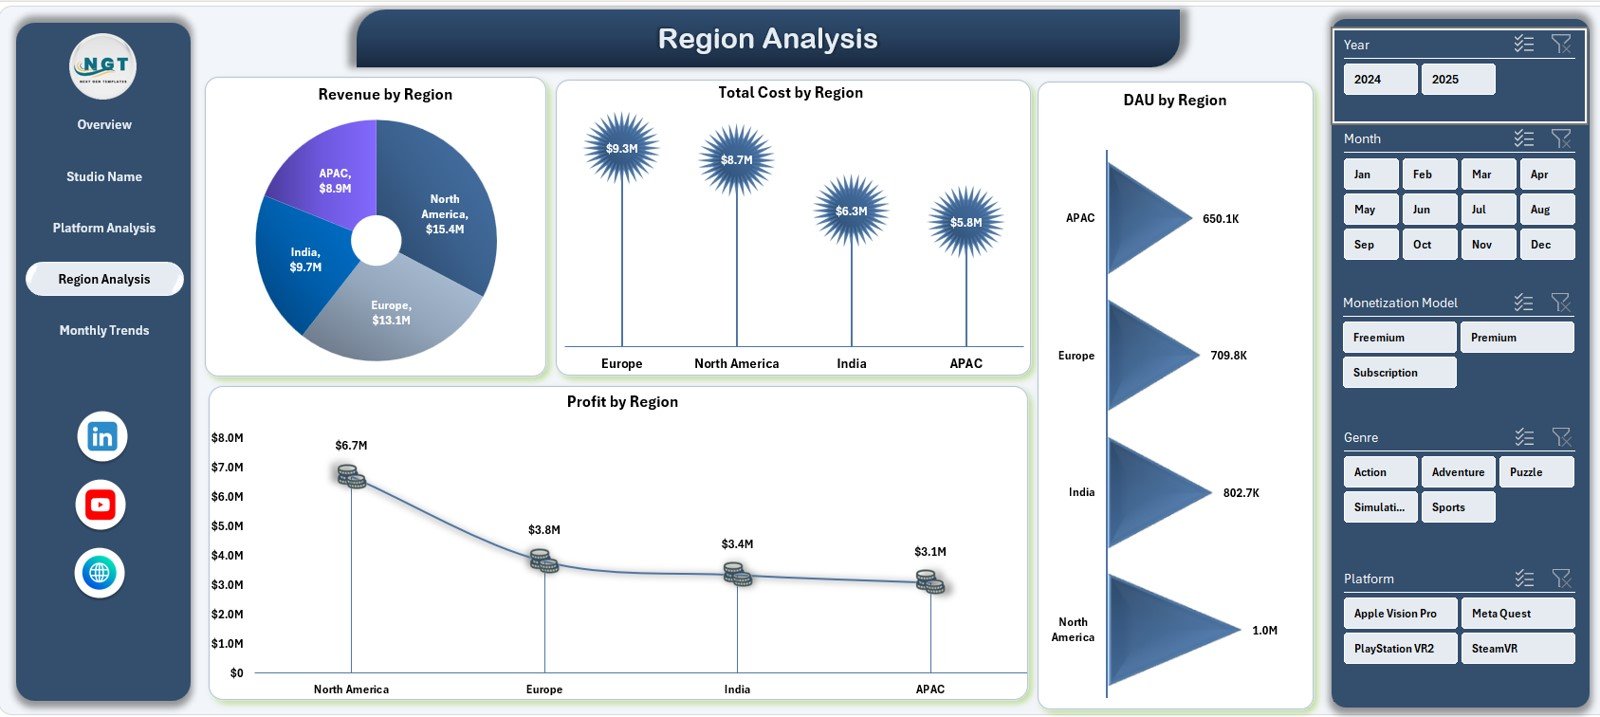
🌍 4. Region Analysis – Global Player Behavior
Player engagement and monetization vary by geography.
Charts Included:
-
Revenue by Region
-
Total Cost by Region
-
DAU by Region
-
Profit by Region
This analysis helps studios expand wisely, localize effectively, and control regional costs.
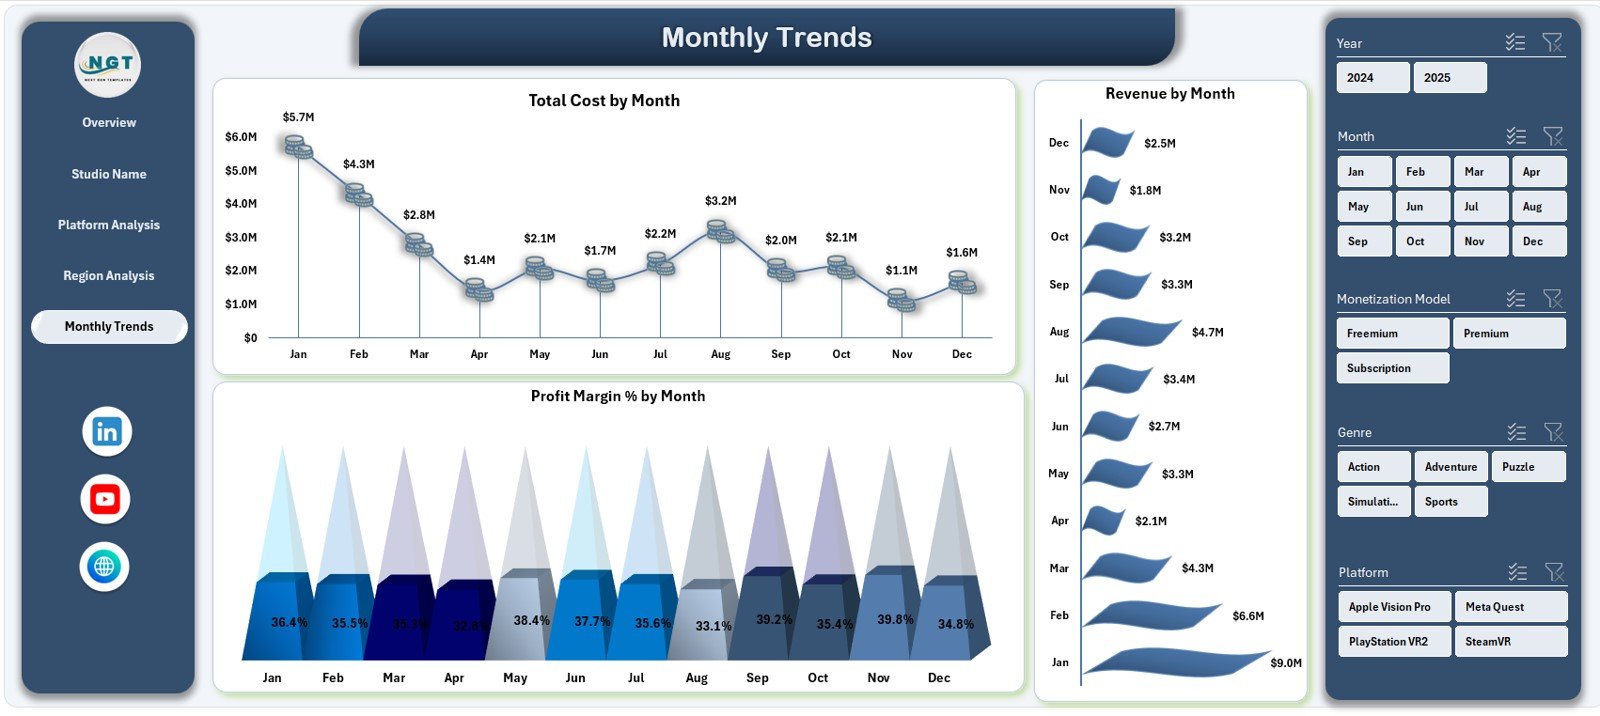
📅 5. Monthly Trends – Growth Over Time
Static numbers don’t tell the full story—trends do.
Monthly Trend Charts:
-
Total Cost by Month
-
Revenue by Month
-
Profit Margin % by Month
This page helps studios understand seasonality, launch impact, and long-term growth.
How to Use the AR/VR Gaming Studios Dashboard in Excel 🛠️
Using the dashboard is simple and intuitive:
1️⃣ Update the Data Sheet with gaming metrics
2️⃣ Dashboard refreshes automatically
3️⃣ Use slicers to filter by studio, platform, region or genre
4️⃣ Review KPI cards for quick insights
5️⃣ Analyze charts to uncover patterns
6️⃣ Take data-driven actions confidently
No advanced Excel skills required 💡.
Who Can Benefit from This Dashboard? 👥
This dashboard is ideal for:
🎮 AR/VR Gaming Studio Owners
💰 Finance & Accounting Teams
🧠 Product & Platform Managers
📊 Business Analysts
📈 Strategy & Growth Teams
💼 Investors & Stakeholders
Anyone involved in AR/VR gaming performance will benefit.


Reviews
There are no reviews yet.