Modern API teams ship features fast. But speed alone doesn’t guarantee success. If response time increases, uptime drops, or deployment success rate declines — users notice immediately.
Without structured KPI tracking, even high-performing teams lose direction.
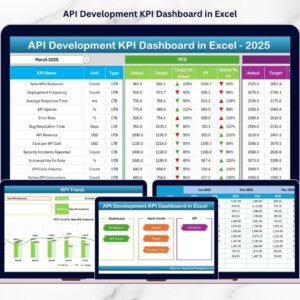
That’s why you need the API Development KPI Dashboard in Excel — a ready-to-use, professional performance monitoring template built specifically for API teams, DevOps engineers, and technology leaders.
This dashboard centralizes all your metrics into one structured Excel system. Instead of juggling multiple spreadsheets, you can track MTD, YTD, Target vs Actual, and Previous Year comparisons instantly — all with executive-ready visuals.
No complicated BI tools. No complex coding. Just powerful KPI clarity in Excel.
🚀 Key Feature of API Development KPI Dashboard in Excel
📊 7 Structured Worksheets – Fully organized system for Dashboard, Trends, Targets, Actuals, Previous Year, and KPI Definitions.
🎯 Target vs Actual Comparison – Instantly identify underperforming KPIs with visual arrows.
📈 MTD & YTD Reporting – Monitor both monthly and cumulative yearly performance.
🔄 Previous Year Comparison – Measure improvement using year-over-year analysis.
📉 Conditional Formatting Indicators – Green ↑ for improvement, Red ↓ for decline.
🧭 Easy Month Selection (Cell D3) – Switch reporting month instantly.
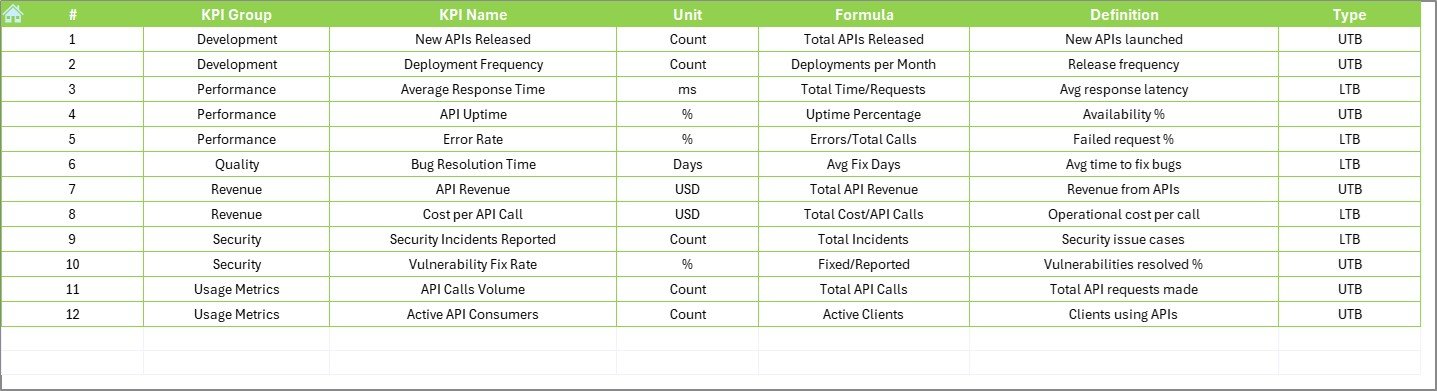
📑 Detailed KPI Documentation – Maintain KPI group, formula, unit, and definitions in one place.
📦 What’s Inside the API Development KPI Dashboard in Excel
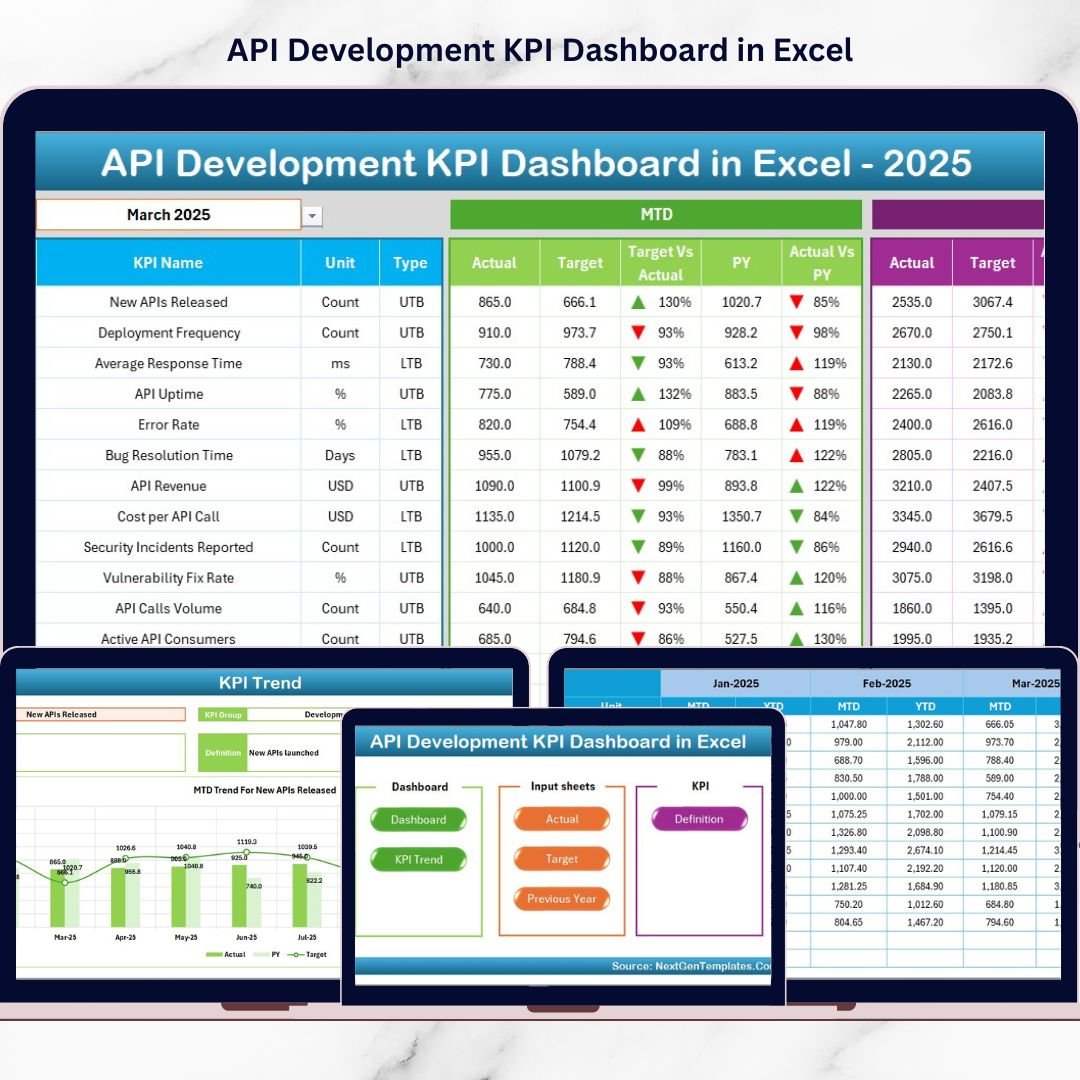
This powerful Excel file includes 7 structured worksheets:
1️⃣ Home Sheet
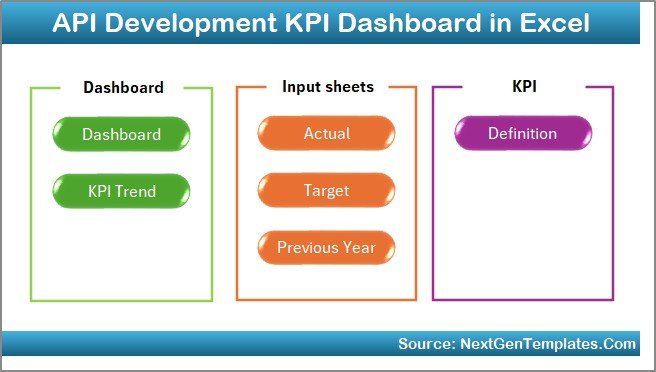
Navigation hub with 6 quick-access buttons to jump between sheets.
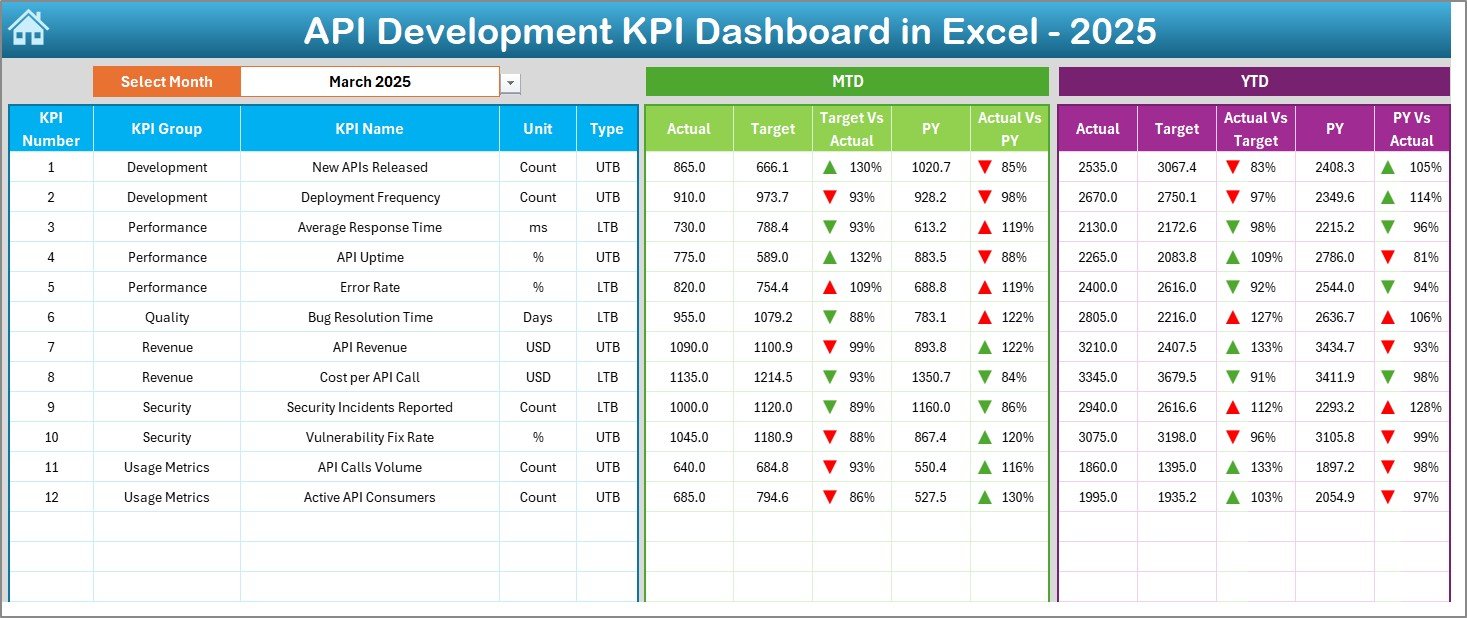
2️⃣ Dashboard Sheet
Main KPI overview page with:
-
MTD Actual, Target & Previous Year
-
YTD Actual, Target & Previous Year
-
Target vs Actual %
-
PY vs Actual %
-
Performance arrows
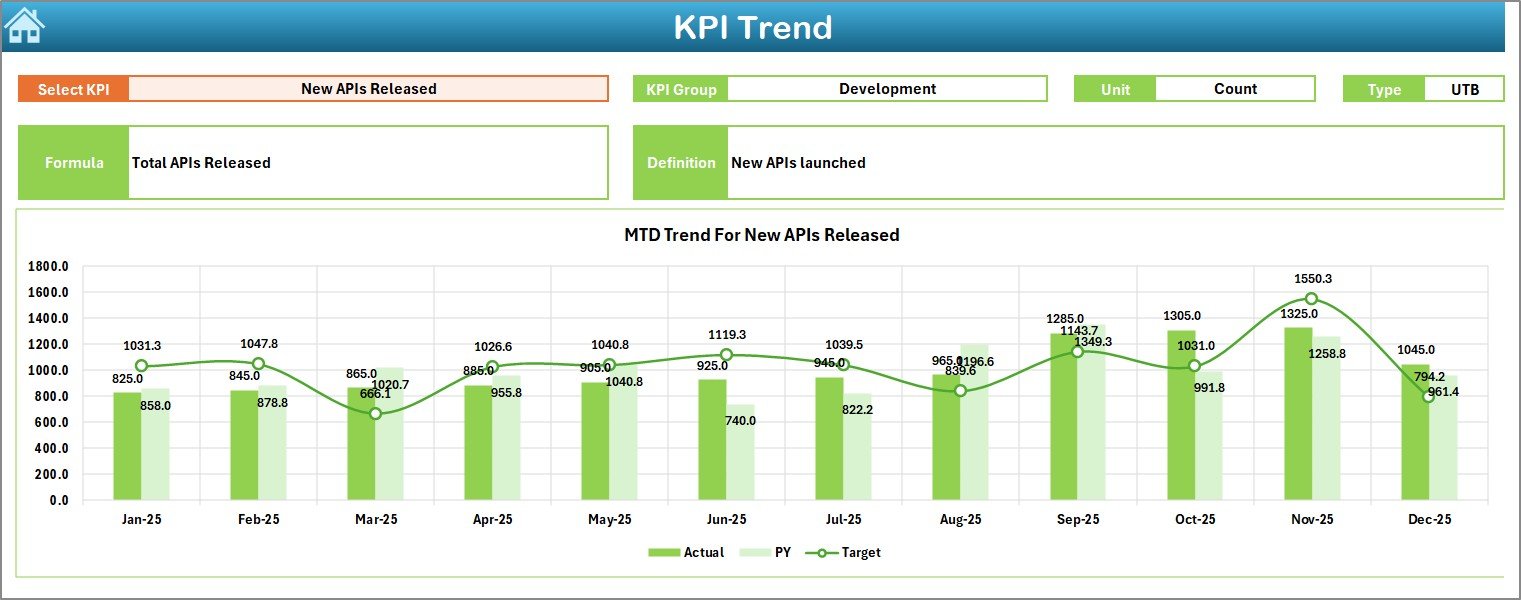
3️⃣ KPI Trend Sheet
Select KPI from Cell C3 and analyze:
-
KPI Group
-
Unit
-
Type (LTB / UTB)
-
Formula & Definition
-
MTD Trend Chart
-
YTD Trend Chart
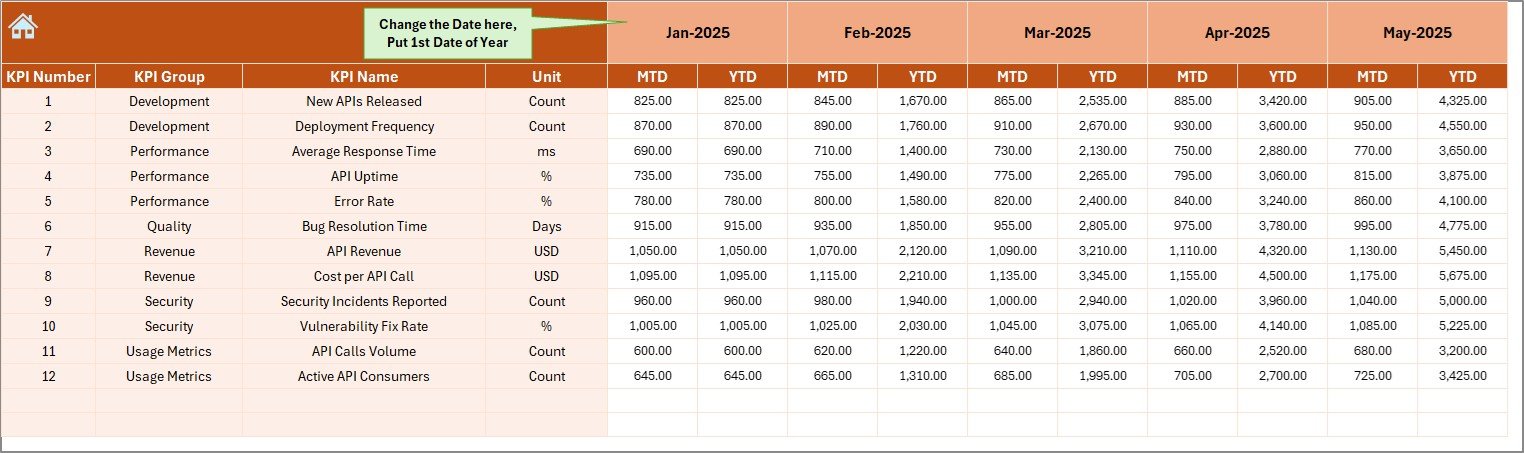
4️⃣ Actual Numbers Input Sheet
Enter current year MTD & YTD values.
5️⃣ Target Sheet
Define monthly and yearly targets for each KPI.
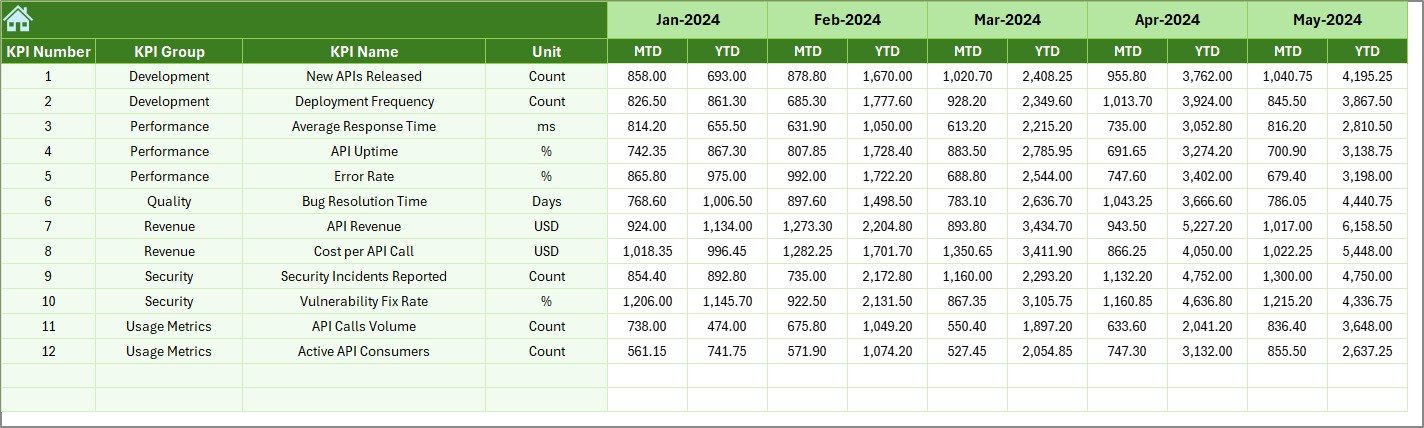
6️⃣ Previous Year Sheet
Store last year’s performance data for growth comparison.
7️⃣ KPI Definition Sheet
Central documentation for KPI names, formulas, and definitions.
Everything is structured for clarity and professional reporting.
🛠 How to Use the API Development KPI Dashboard in Excel
Using the dashboard is simple:
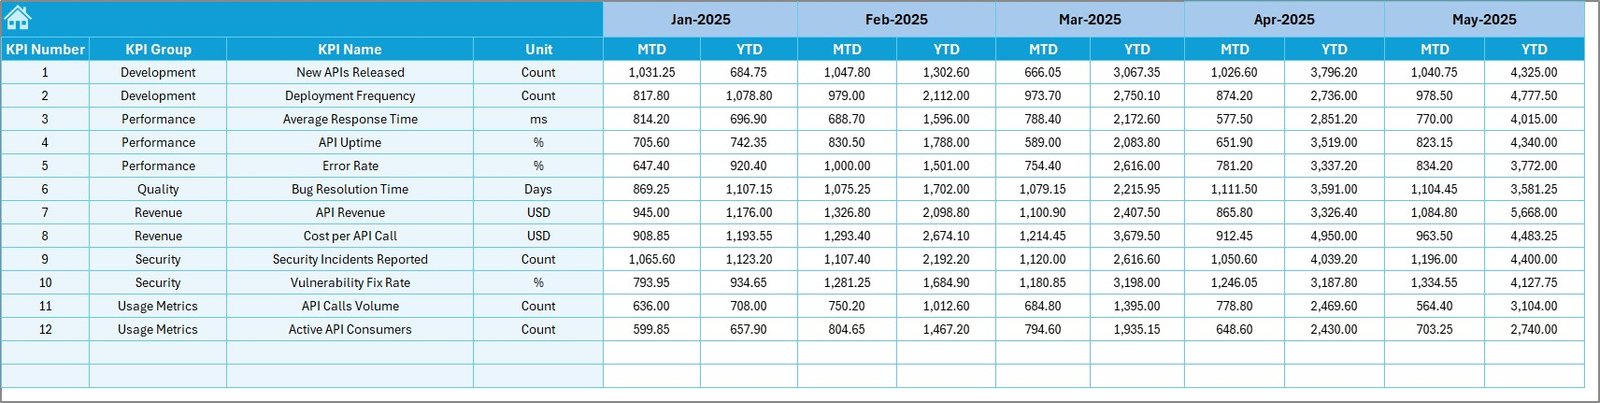
1️⃣ Enter current KPI data in the Actual Numbers Sheet.
2️⃣ Update performance targets in the Target Sheet.
3️⃣ Add historical data in the Previous Year Sheet.
4️⃣ Select the reporting month from Cell D3 on the Dashboard.
5️⃣ Review performance indicators and trend charts.
6️⃣ Use KPI Trend Sheet for deeper analysis.
Because calculations run automatically, reporting becomes effortless.
👨💻 Who Can Benefit from This API Development KPI Dashboard in Excel
✔ API Development Teams
✔ DevOps Engineers
✔ Software Engineering Managers
✔ CTOs & Technology Leaders
✔ SaaS Product Teams
✔ IT Operations Managers
✔ Performance Analysts
Whether you manage internal APIs or public integrations, this dashboard ensures performance visibility.
Why This Dashboard Can Transform Your API Performance
Instead of reacting to rising latency, you detect trends early.
Instead of guessing deployment stability, you measure success rate clearly.
Instead of manual reporting, you present executive-ready visuals instantly.
From API Response Time and Uptime % to Deployment Frequency and MTTR — every metric becomes measurable and comparable.
If you want structured performance monitoring without complexity, this dashboard becomes your competitive advantage.
Click here to read the Detailed blog post
Visit our YouTube channel to learn step-by-step video tutorials
👉 YouTube Channel – PKAnExcelExpert