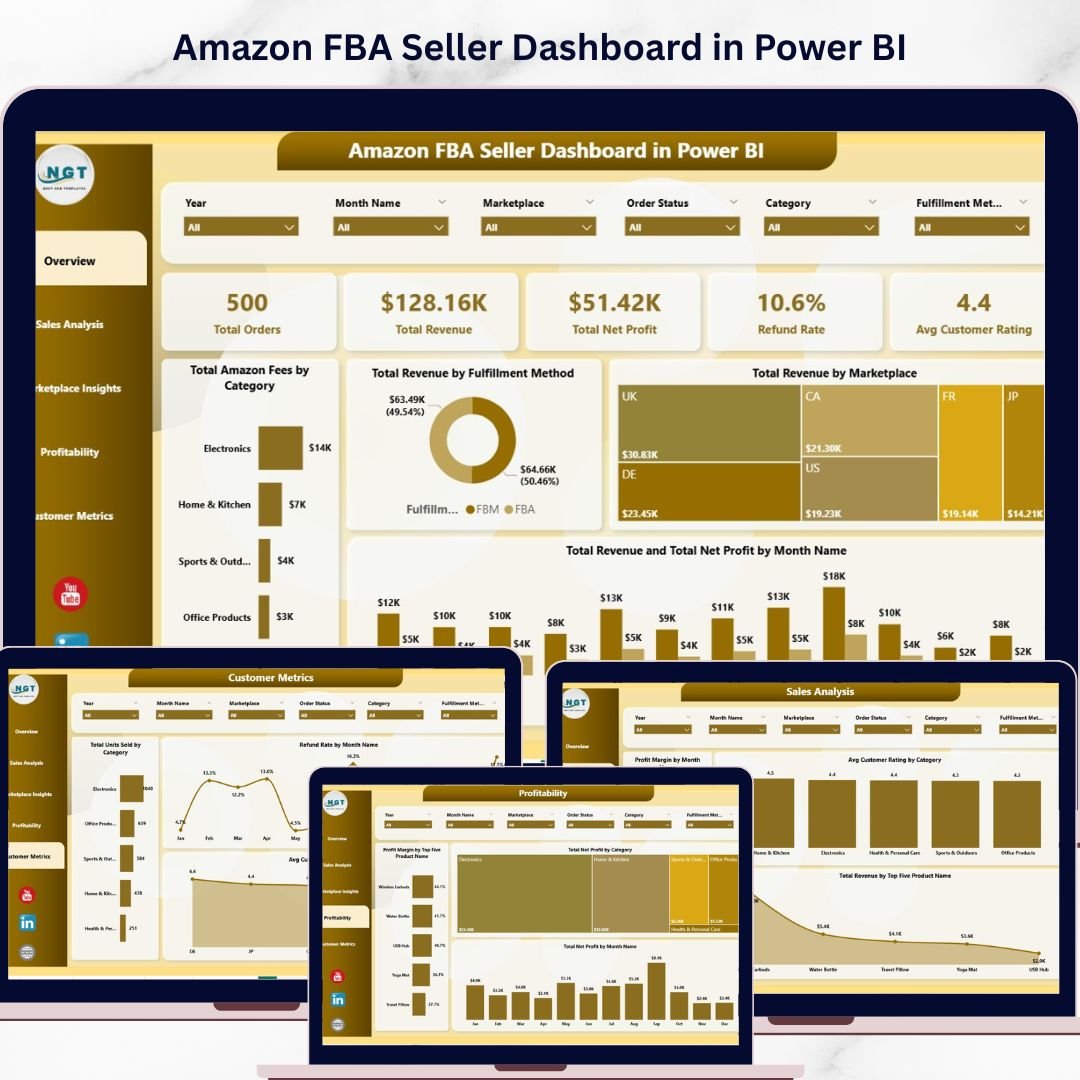

🔑 Key Features of Amazon FBA Seller Dashboard in Power BI
Amazon FBA Seller Dashboard in Power BI is a professionally designed, interactive analytics template built specifically for Amazon FBA sellers who want to monitor revenue, profitability, customer satisfaction, marketplace performance, and refund trends — all from a single dynamic Power BI dashboard. This template includes 5 interactive dashboard pages covering Overview, Sales Analysis, Marketplace Insights, Profitability, and Customer Metrics, delivering a complete 360-degree view of your Amazon seller business 🚀.
Whether you sell on Amazon US, UK, Canada, Germany, or any other marketplace, this Power BI Dashboard Template transforms your raw Amazon FBA data into actionable visual insights instantly. Simply open the .pixy file in Power BI Desktop, connect your data source, and refresh — all charts, KPI cards, and filters update automatically. This Amazon FBA Seller Dashboard in Power BI tracks 5 key performance indicators on the Overview page including Total Orders, Total Revenue, Total Net Profit, Refund Rate, and Avg Customer Rating, with 12+ charts and visualizations spread across 5 dashboard pages.
If you prefer working in Excel, check out the Amazon FBA Seller Dashboard in Excel for pivot-powered analytics. Also explore our Etsy Seller Analytics Dashboard in Excel and Online Marketplaces Dashboard in Excel for complementary e-commerce analytics.
📦 What’s Inside the Amazon FBA Seller Dashboard in Power BI
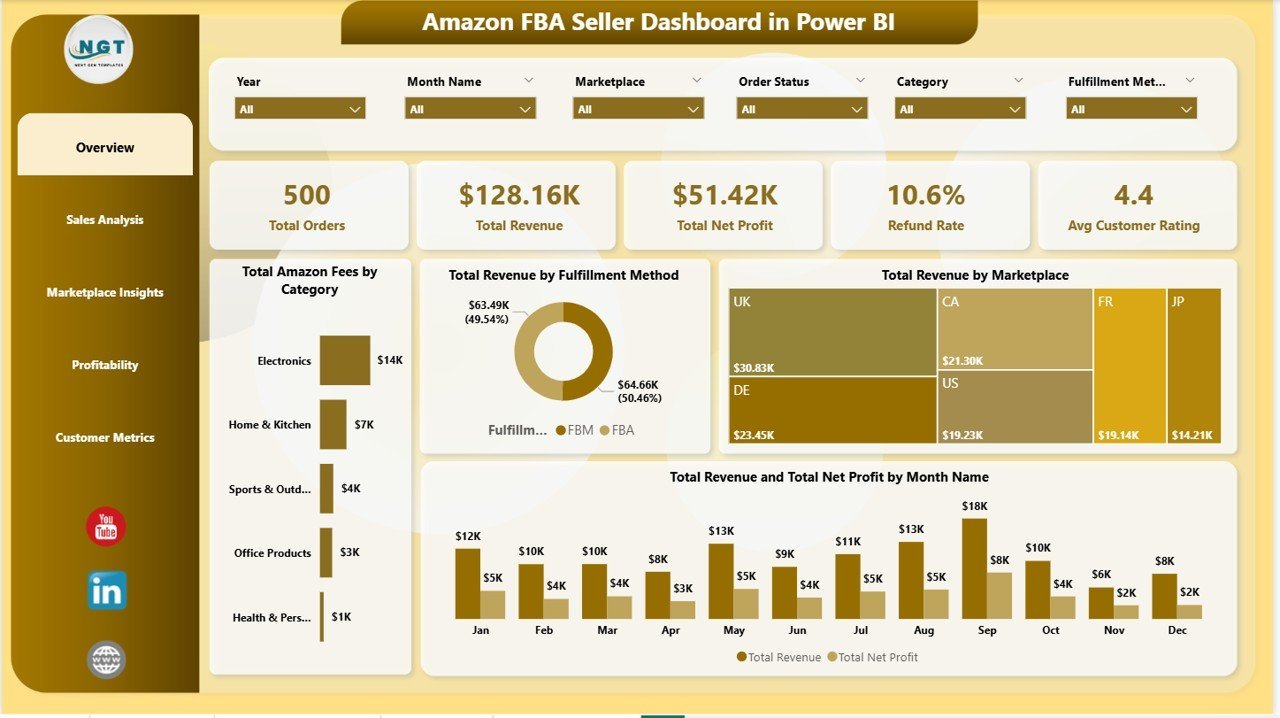
📌 Overview Page — High-level KPI cards showing Total Orders, Total Revenue, Total Net Profit, Refund Rate, and Avg Customer Rating. Interactive charts display Total Amazon Fees by Category tracking platform fee distribution across product categories, Total Revenue by Fulfillment Method comparing FBA vs FBM performance, Total Revenue by Marketplace comparing earnings across global Amazon marketplaces, and Total Revenue and Total Net Profit by Month Name tracking monthly revenue and profit trends. Multiple slicers allow instant filtering across all dimensions.

Amazon FBA Seller Dashboard in Power BI
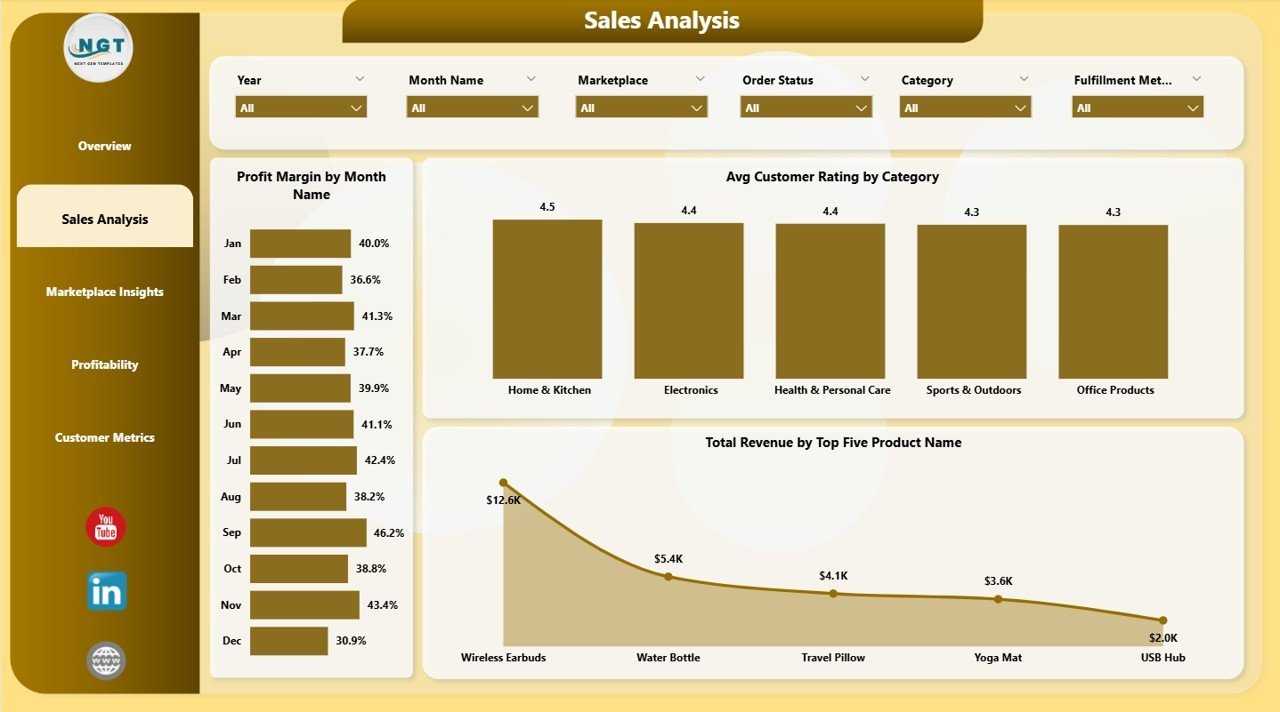
📌 Sales Analysis Page — Dive deeper into sales performance with Profit Margin by Month Name tracking monthly profitability trends, Avg Customer Rating by Category comparing customer satisfaction across product categories, and Total Revenue by Top Five Product Name identifying your best-selling products by revenue.

Sales Analysis
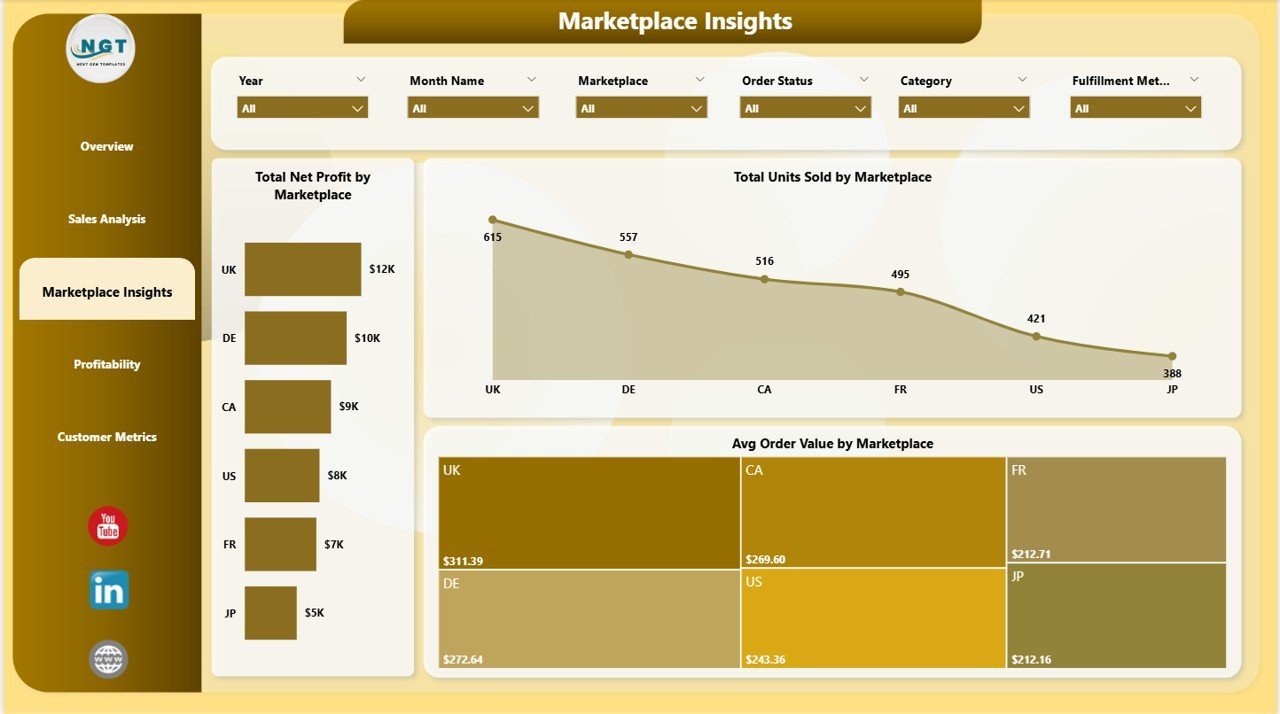
📌 Marketplace Insights Page — Compare performance across Amazon marketplaces with Total Net Profit by Marketplace identifying the most profitable selling regions, Total Units Sold by Marketplace comparing sales volume across countries, and Avg Order Value by Marketplace revealing which marketplaces generate the highest per-order revenue.

Marketplace Insights
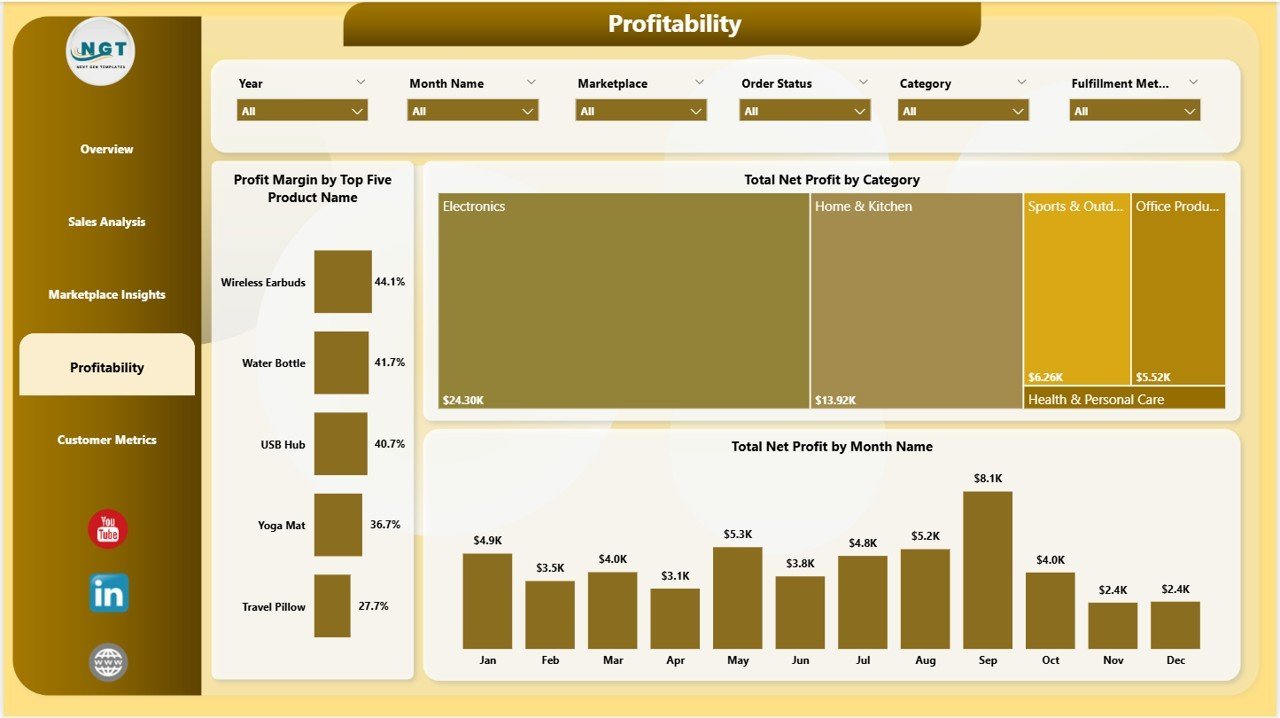
📌 Profitability Page — Analyze profit drivers with Profit Margin by Top Five Product Name identifying which products deliver the highest margins, Total Net Profit by Category tracking profitability across product categories, and Total Net Profit by Month Name monitoring monthly profit trends over time.

Profitability
📌 Customer Metrics Page — Monitor customer behavior with Total Units Sold by Category tracking sales volume distribution, Refund Rate by Month Name identifying months with the highest return rates, and Avg Customer Rating by Marketplace comparing customer satisfaction across different Amazon regions.
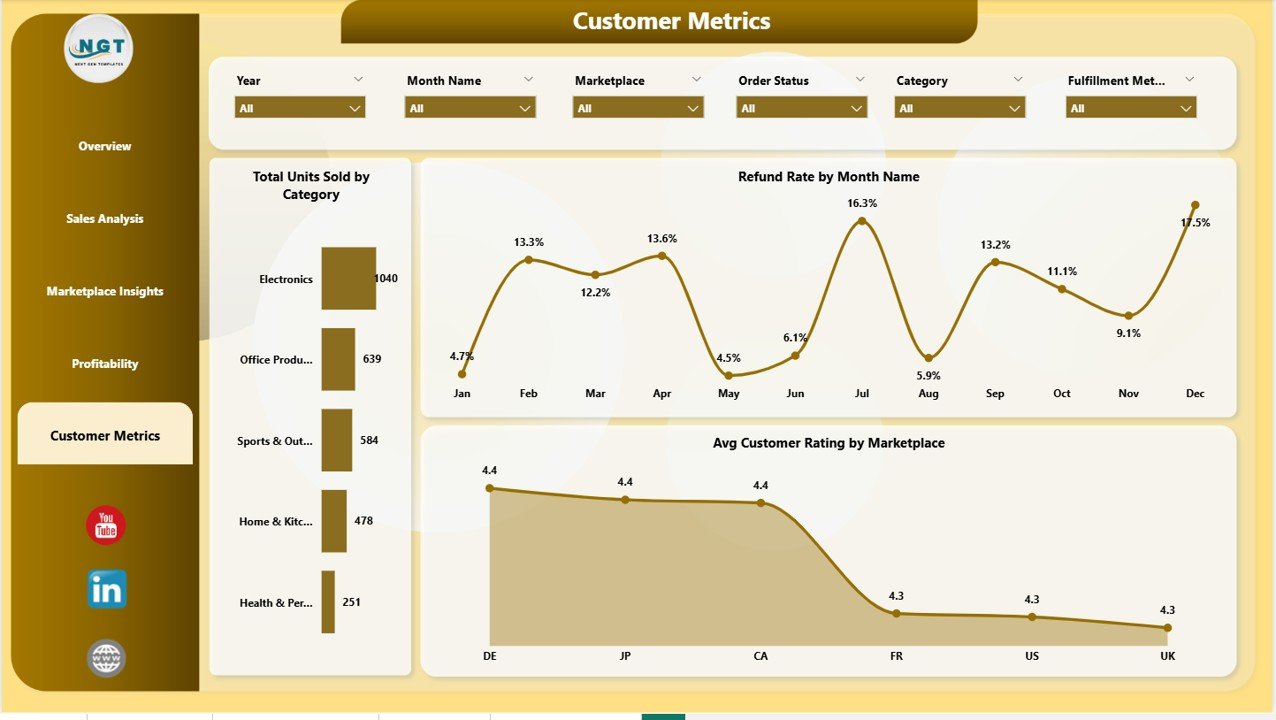
Customer Metrics
⚙️ How to Use the Amazon FBA Seller Dashboard in Power BI
1️⃣ Download and unzip the file to your computer.
2️⃣ Open the .pbix file in Power BI Desktop (free download from Microsoft).
3️⃣ Explore the sample data across all 5 dashboard pages to understand the layout and available analysis.
4️⃣ Replace the sample data source with your actual Amazon FBA sales data.
5️⃣ Click Refresh in Power BI to update all charts and KPI cards automatically.
6️⃣ Use slicers and filters to drill down into specific categories, marketplaces, fulfillment methods, or time periods.
👥 Who Can Benefit from This Amazon FBA Seller Dashboard
📌 Amazon FBA sellers tracking revenue and profitability across multiple products and marketplaces
📌 E-commerce managers analyzing sales performance, Amazon fees, and customer metrics
📌 Small business owners selling through Fulfillment by Amazon who need data-driven insights
📌 Financial analysts monitoring marketplace-level profit margins and refund trends
📌 Freelancers and consultants providing Amazon seller analytics reports to clients
❓ Frequently Asked Questions
What KPIs does the Amazon FBA Seller Dashboard in Power BI track?
The Amazon FBA Seller Dashboard in Power BI tracks 5 core KPIs on the Overview page: Total Orders, Total Revenue, Total Net Profit, Refund Rate, and Avg Customer Rating. It also includes 12+ charts across 5 pages covering sales trends, marketplace comparisons, profitability analysis, and customer behavior metrics.
Do I need advanced Power BI skills to use this dashboard?
No. Simply open the .pbix file in Power BI Desktop, replace the sample data with your own Amazon FBA records, and click Refresh. All charts, KPI cards, and visuals update automatically without any DAX editing or advanced knowledge required.
Can I track multiple Amazon marketplaces with this template?
Yes. The Marketplace Insights page lets you compare Total Net Profit, Units Sold, and Avg Order Value across all your Amazon marketplaces including US, UK, Canada, Germany, and more.
How do I analyze profit margins for my top-selling products?
The Sales Analysis and Profitability pages display Profit Margin by Month Name and Profit Margin by Top Five Product Name, so you can instantly identify which products and time periods deliver the highest margins.
What is the best Power BI dashboard for tracking Amazon FBA seller metrics?
The Amazon FBA Seller Dashboard in Power BI from NextGenTemplates is one of the best options available. It includes 5 interactive pages covering overview metrics, sales analysis, marketplace insights, profitability tracking, and customer metrics — all in a single .pbix file ready for immediate use with dynamic KPI cards and slicer-based filtering.
🔗 Explore Related Templates
📌 Amazon FBA Seller Dashboard in Excel — The Excel version with pivot-powered analytics for Amazon FBA sellers.
📌 Etsy Seller Analytics Dashboard in Excel — Track your Etsy shop performance with dedicated seller analytics.
📌 Online Marketplaces Dashboard in Excel — A comprehensive dashboard for sellers across multiple online platforms.
Browse all Power BI Dashboard Templates and Sales and Marketing Templates for more analytics solutions.
📖 Click here to read the Detailed Blog Post
🎥 Visit our YouTube channel to learn step-by-step video tutorials
👉 YouTube.com/@NextGenTemplates
Watch the step-by-step video tutorial:
YouTube


Reviews
There are no reviews yet.