


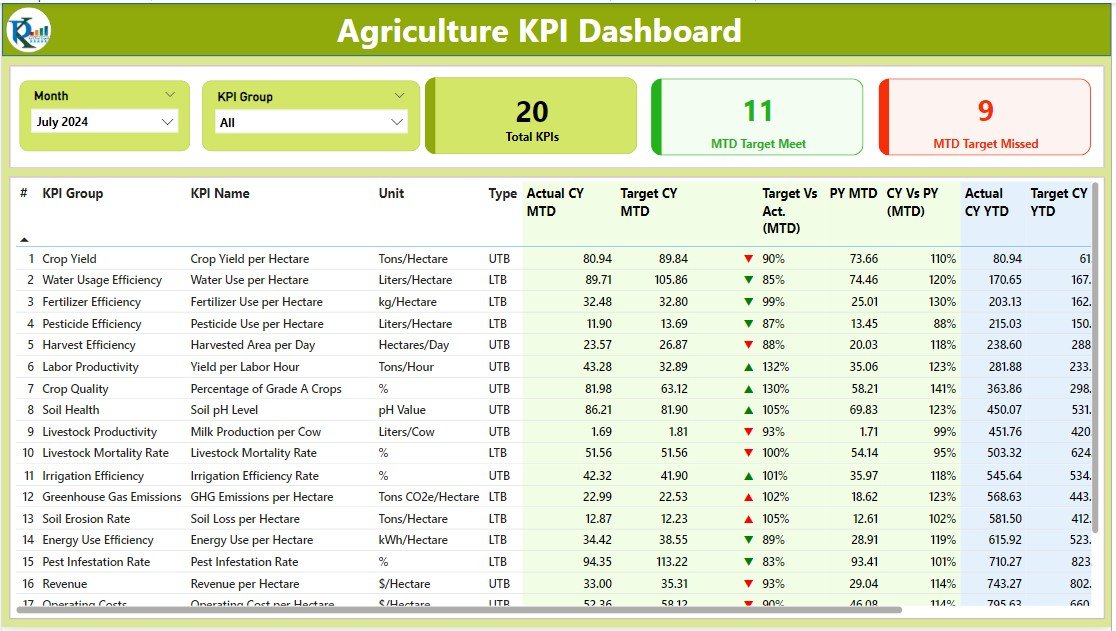
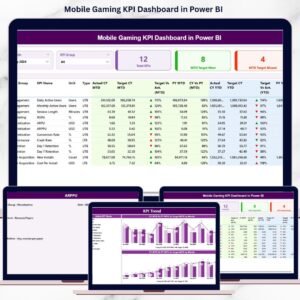
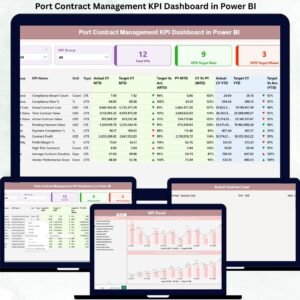
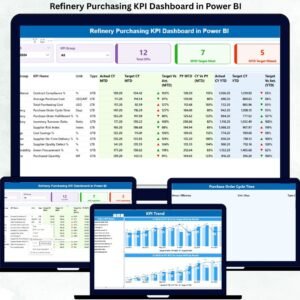
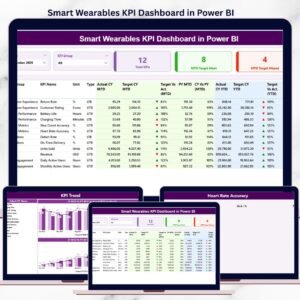
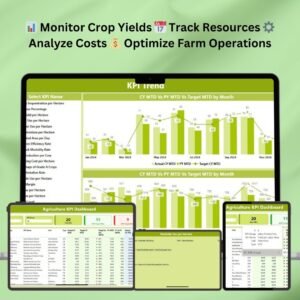
The Agriculture KPI Dashboard in Power BI is a specialized tool designed to provide detailed insights into agricultural operations. It allows stakeholders to monitor, analyze, and visualize key performance indicators (KPIs) such as crop yields, resource utilization, operational costs, and revenue, all in one interactive dashboard.
With this Power BI dashboard, farmers, agricultural managers, and stakeholders can make data-driven decisions to optimize farm management practices. The dashboard presents data in a clear and interactive format, helping users track performance, forecast trends, and identify opportunities for improving operational efficiency.
Key Features of the Agriculture KPI Dashboard in Power BI
📊 Real-Time Data Monitoring: Track important KPIs like crop yields, operational costs, and resources in real-time.
⚙️ Customizable KPIs: Adapt the dashboard to monitor the most relevant agricultural metrics specific to your farm or business.
📈 Performance Analytics: Analyze trends in crop growth, yield production, and other critical metrics to make informed decisions.
📅 Time-Based Insights: View and compare data across various time periods (daily, weekly, monthly) to assess long-term performance.
📉 Comparative Data: Compare KPIs across different regions, crops, or time frames to assess performance and identify areas for improvement.
🔄 Interactive Dashboard: Use the interactive features to explore your data and drill down into specific KPIs.
🧑💼 User-Friendly Interface: A simple, intuitive layout makes the dashboard easy to navigate for users of all experience levels.
Why You’ll Love the Agriculture KPI Dashboard in Power BI
✅ Optimizes Farm Management: Monitor key metrics like crop yields and resources for better management and decision-making.
✅ Customizable to Your Needs: Modify the dashboard to suit specific crop types, regions, and business needs.
✅ Data-Driven Decisions: Analyze trends and performance to drive informed decision-making.
✅ Real-Time Updates: Access up-to-date data, ensuring that you always have the latest information for monitoring farm performance.
✅ Easy-to-Use Interface: Navigate the dashboard effortlessly with clear visuals and interactive features.
What’s Inside the Agriculture KPI Dashboard in Power BI?
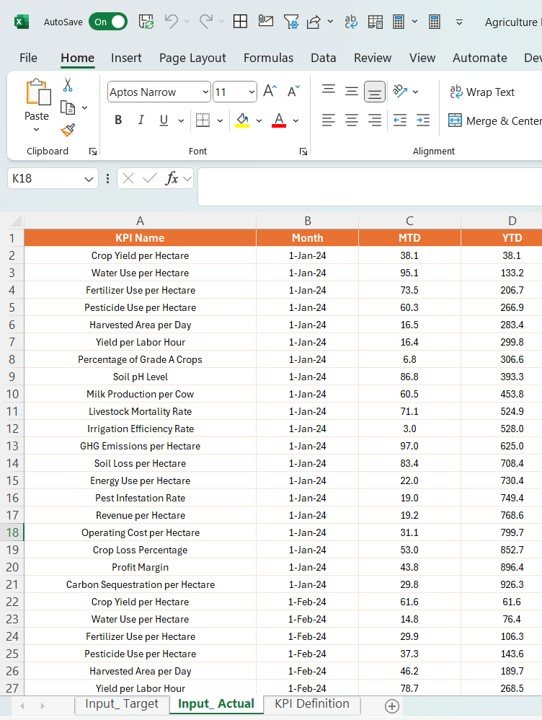
📊 Crop Yield Monitoring: Track and visualize crop yields across different areas and time periods.
📈 Resource Utilization Tracking: Analyze resource use (water, fertilizers, etc.) and optimize efficiency.
⚙️ Cost and Revenue Analysis: Compare operational costs against revenues to evaluate profitability.
📅 Time-Based Performance Metrics: Track farm performance over time and visualize trends.
🔄 Interactive Data Analysis: Drill down into specific regions, crops, or KPIs for more detailed insights.
How to Use the Agriculture KPI Dashboard in Power BI
1️⃣ Download the Dashboard Template – Gain instant access to the Power BI file.
2️⃣ Customize the KPIs: Modify the dashboard to fit your unique agricultural operations.
3️⃣ Input Your Data: Connect your data sources to the dashboard and start monitoring your KPIs.
4️⃣ Track and Analyze Performance: Use the interactive features to assess trends and performance.
5️⃣ Generate Reports: Create customized reports for stakeholders and management.
Who Can Benefit from the Agriculture KPI Dashboard in Power BI?
🔹 Farm Managers
🔹 Agricultural Consultants
🔹 Agricultural Operations Teams
🔹 Farm Owners
🔹 Agribusinesses
🔹 Government and Regulatory Bodies
This Agriculture KPI Dashboard is the perfect tool for managing agricultural operations, improving farm management, and making data-driven decisions to boost productivity.
Click here to read the detailed blog post
Visit our YouTube channel to learn step-by-step video tutorials
Also check our Expense Tracking Dashboard in Power BI


Reviews
There are no reviews yet.