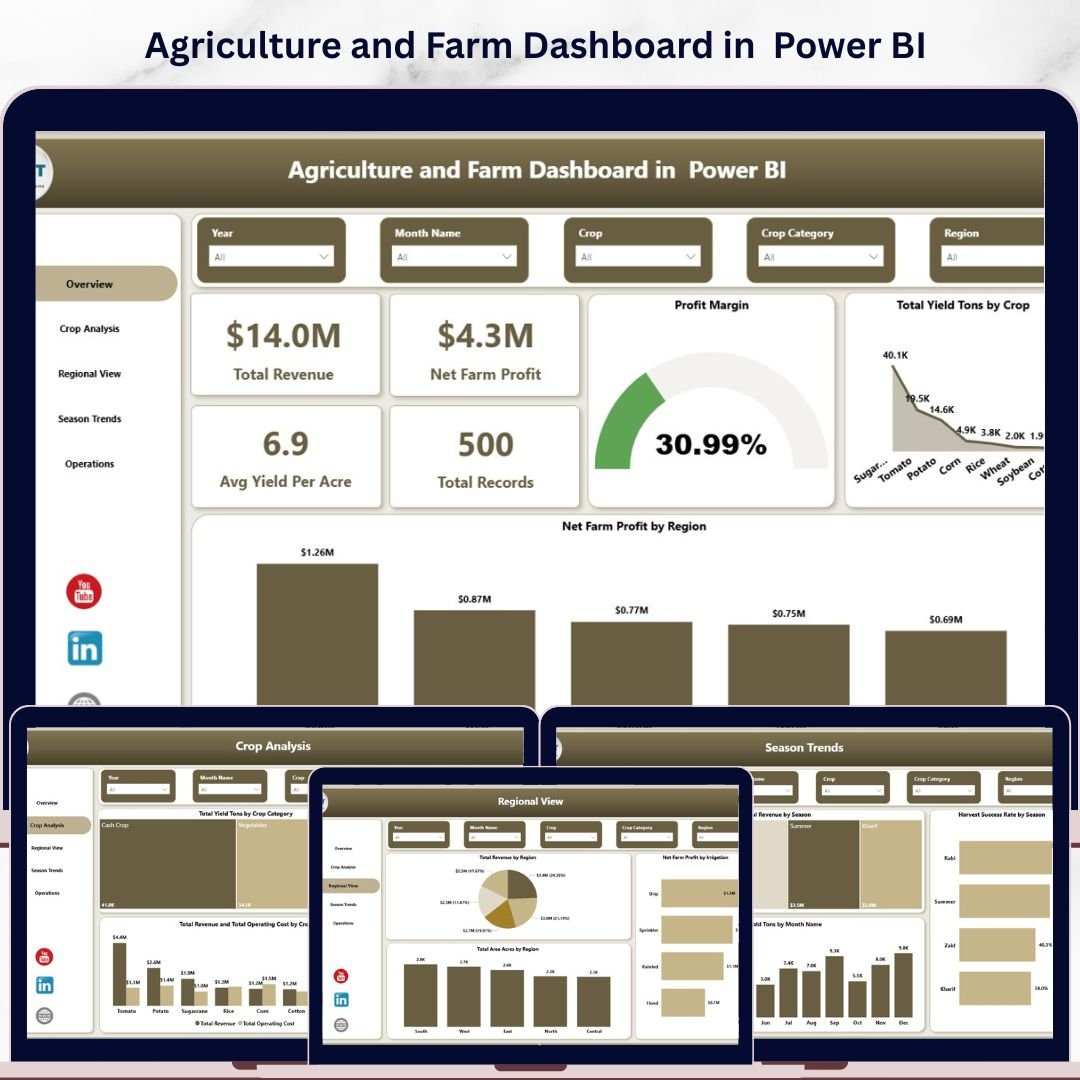
Agriculture and Farm Dashboard in Power BI is a comprehensive, interactive analytical tool designed for farmers, agronomists, and agricultural business managers who want to monitor farm revenue, crop yield, operating costs, and profit margins — all from a single Power BI report. This dashboard includes 5 interactive analysis pages that cover everything from high-level KPIs to detailed crop analysis, regional views, seasonal trends, and operational breakdowns. It tracks 5 critical KPIs including Total Revenue, Net Farm Profit, Avg Yield Per Acre, Total Records, and Profit Margin. Whether you manage a small family farm or a large-scale commercial agriculture operation, this template helps you make data-driven farming decisions quickly and confidently.
📌 Built entirely in Microsoft Power BI — simply connect or import your farm data and the dashboard updates dynamically with clear, professional visuals and interactive slicers on every page.
📌 Includes dynamic slicers so you can filter by Region, Crop, Season, Irrigation Type, Soil Type, Buyer Type, and more — giving you a customized view in seconds.
📌 Designed with clean, modern visuals that make complex agricultural data simple to understand and act upon. If you are looking for more agriculture and farming analytics templates, explore our full collection of Power BI Dashboard Templates at NextGenTemplates.
🔑 Key Features of Agriculture and Farm Dashboard in Power BI
🌾 5 Interactive Dashboard Pages — This template includes five professionally designed analysis pages covering Overview, Crop Analysis, Regional View, Season Trends, and Operations for a complete 360-degree view of your farming operations.
📊 5 High-Level KPI Cards — Instantly monitor Total Revenue, Net Farm Profit, Avg Yield Per Acre, Total Records, and Profit Margin right from the Overview page.
📈 Advanced Visual Analytics — Explore your farming data through powerful charts showing Total Yield Tons by Crop, Net Farm Profit by Region, Total Revenue by Season, Harvest Success Rate by Season, and much more across all 5 pages.
🎛️ Dynamic Slicers and Filters — Apply filters instantly to explore specific data segments such as crop, region, season, irrigation type, soil type, and buyer type for highly focused decision-making.
🌍 Regional Performance Insights — Compare Total Revenue by Region, Net Farm Profit by Irrigation, and Total Area Acres by Region to identify top-performing geographic areas.
🌱 Crop-Level Deep Dive — Analyze Total Yield Tons by Crop Category, Avg Yield Per Acre by Crop, and Total Revenue vs Total Operating Cost by Crop to determine which crops deliver the best returns.
📅 Seasonal Trend Monitoring — Track Total Revenue by Season, Harvest Success Rate by Season, and Total Yield Tons by Month to understand seasonal productivity patterns and plan ahead.
⚙️ Operations Analysis — Monitor Avg Yield Per Acre by Soil Type, Total Records by Month Name, and Total Revenue by Buyer Type to optimize resource allocation and sales channels.
🚀 Professional and Ready-to-Use — Simply connect or import your agricultural data into the Power BI file and the dashboard updates automatically with clear insights for planning, reporting, and decision-making.
📦 What’s Inside the Agriculture and Farm Dashboard in Power BI
This dashboard contains 5 interactive pages designed to cover every aspect of your farming operations:
📊 Overview Page — Your central command center displaying Total Revenue, Net Farm Profit, Avg Yield Per Acre, Total Records, and Profit Margin as KPI cards. Charts include Total Yield Tons by Crop and Net Farm Profit by Region. Interactive slicers let you filter the entire dashboard instantly.
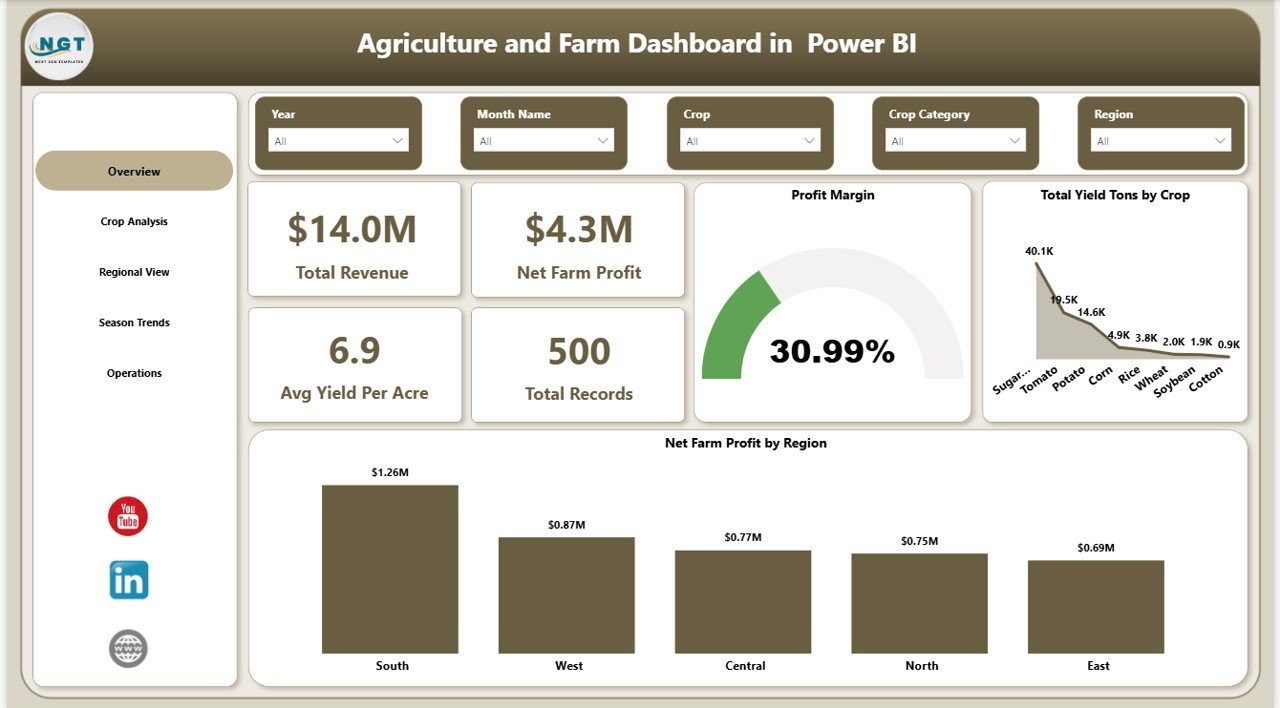 Overview Page
📊 Crop Analysis — Deep-dive into crop-level performance with charts showing Total Yield Tons by Crop Category, Avg Yield Per Acre by Crop, and Total Revenue and Total Operating Cost by Crop. Identify your most and least profitable crops at a glance.
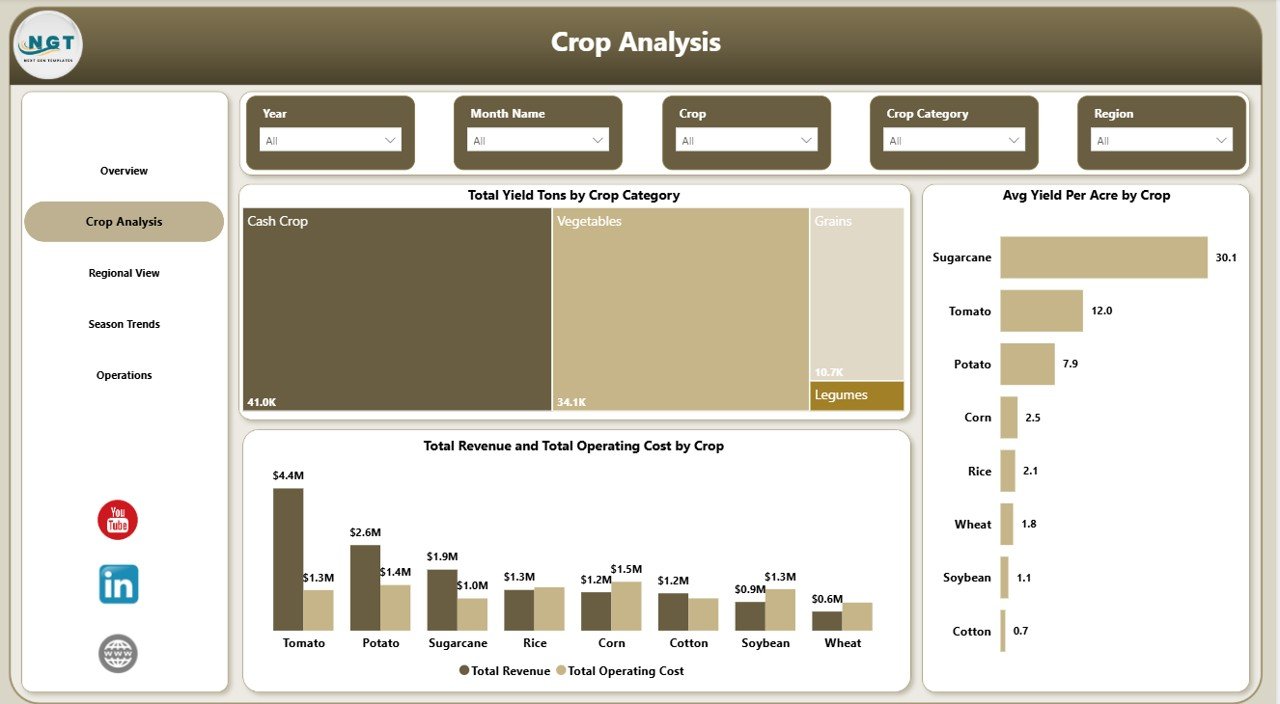 Crop Analysis
📊 Regional View — Analyze geographic performance with Total Revenue by Region, Net Farm Profit by Irrigation, and Total Area Acres by Region. Understand which regions deliver the best returns on your farming investments.
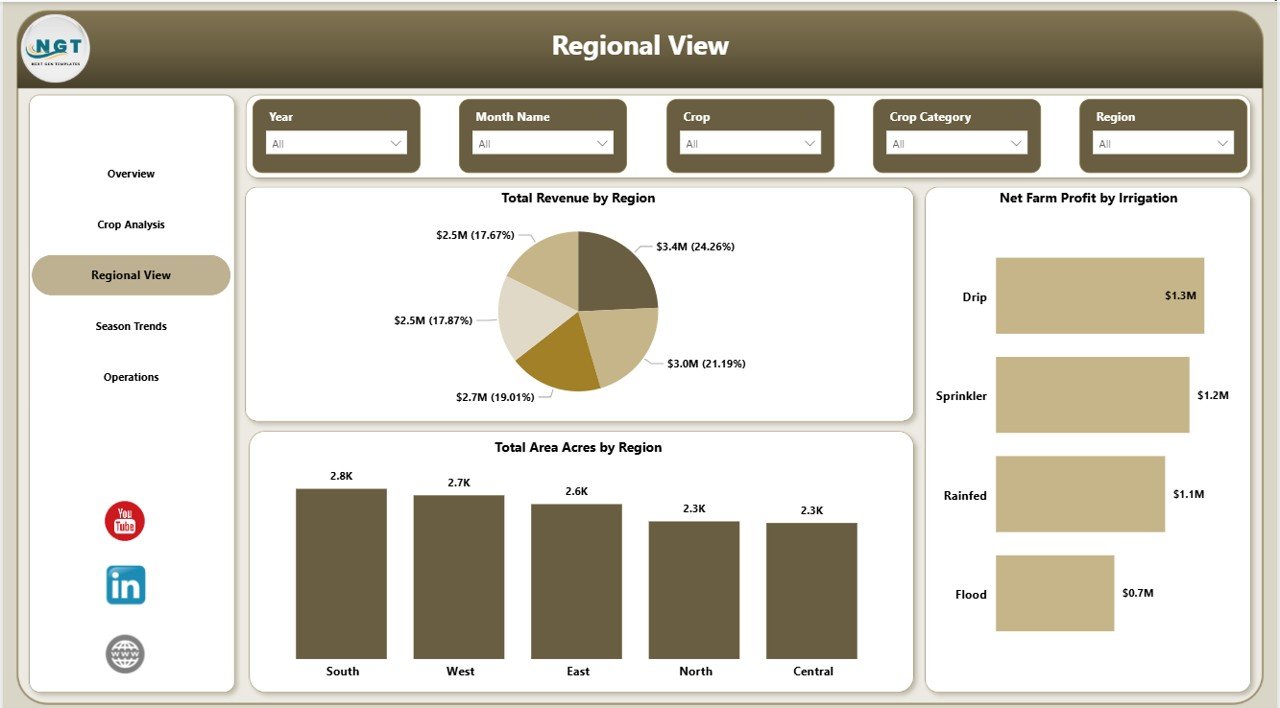 Regional View
📊 Season Trends — Track seasonal patterns with Total Revenue by Season, Harvest Success Rate by Season, and Total Yield Tons by Month Name. Plan your planting and harvesting cycles based on real data trends.
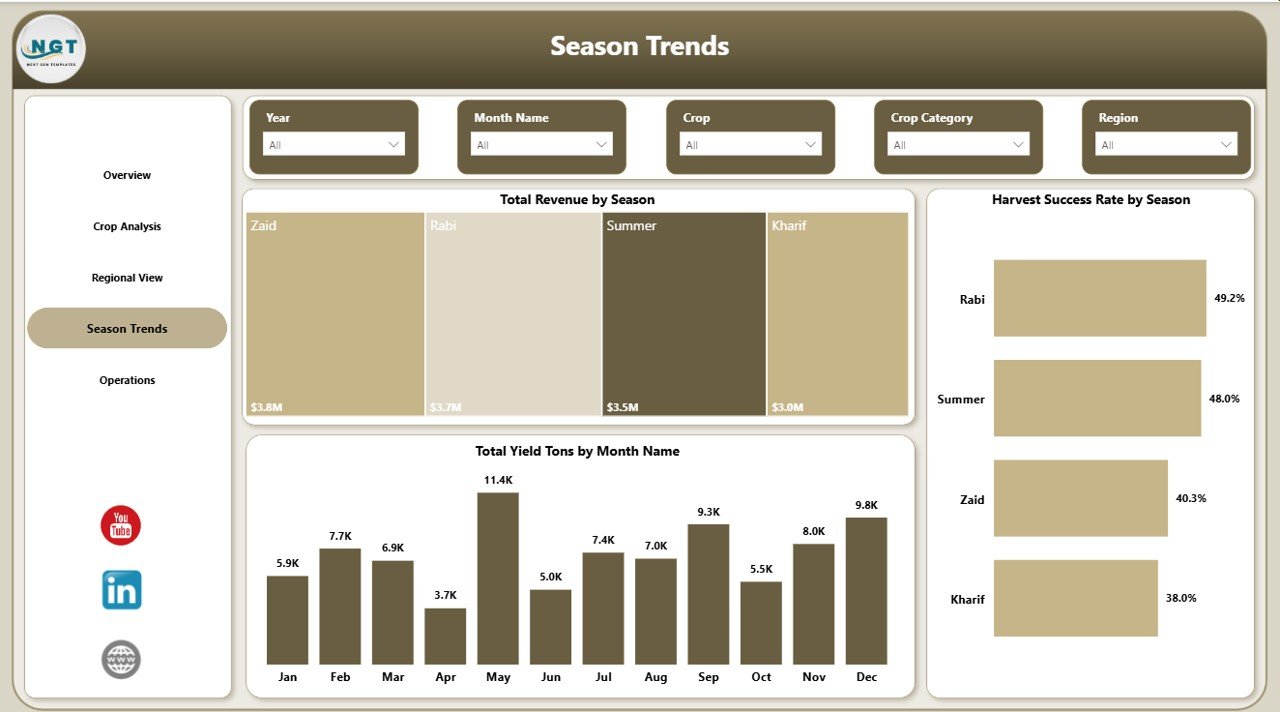 Season Trends
📊 Operations — Monitor operational efficiency with Avg Yield Per Acre by Soil Type, Total Records by Month Name, and Total Revenue by Buyer Type. Optimize your resource allocation for maximum yield and profitability.
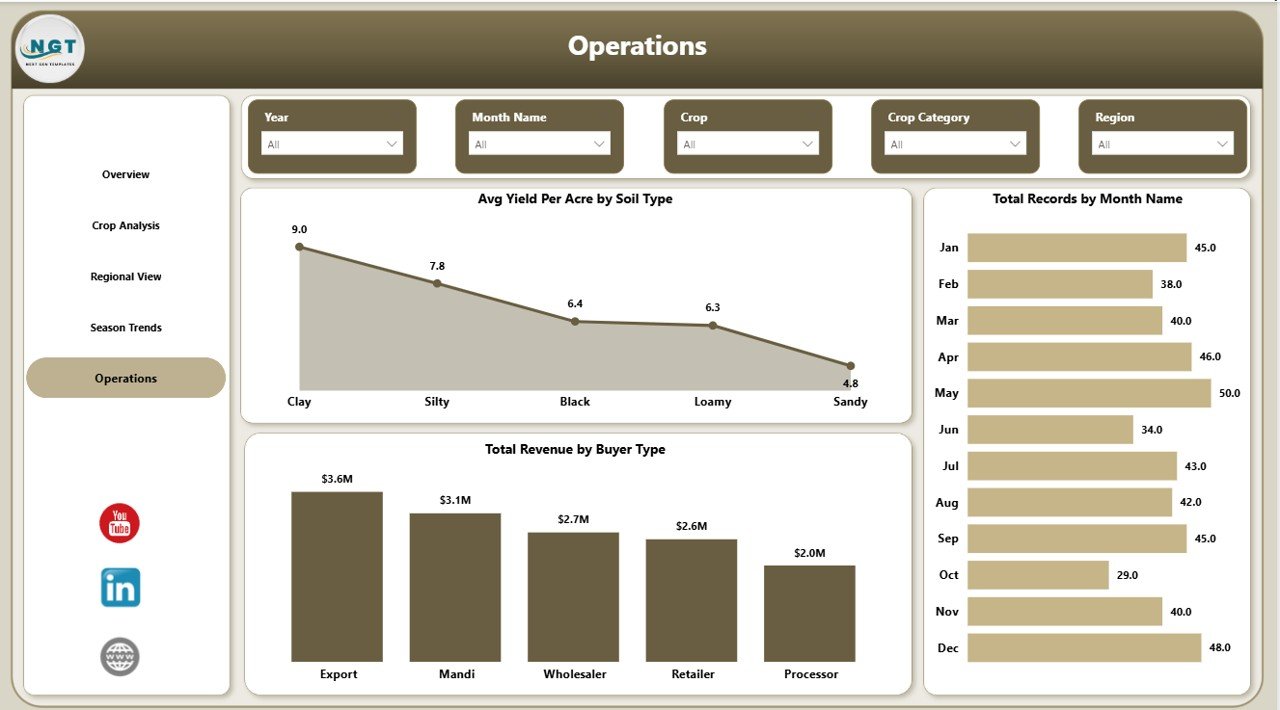 Operations
Looking for a similar dashboard in other platforms? Check out the Agriculture and Farm Dashboard in Excel, the Agriculture and Farm Dashboard in HTML, or the Farm Production Dashboard in Google Sheets.
⚙️ How to Use the Agriculture and Farm Dashboard in Power BI
Getting started is simple:
1️⃣ Download the .pbix file and open it in Power BI Desktop (free download from Microsoft).
2️⃣ Review the sample data across all 5 dashboard pages to understand the layout and KPIs.
3️⃣ Replace the sample data source with your own farm records — keep the same column format for seamless refresh.
4️⃣ Click Refresh in Power BI to update all visuals, KPI cards, and charts with your data.
5️⃣ Use the slicers on each page to filter by Region, Crop, Season, Irrigation Type, Soil Type, Buyer Type, and other dimensions.
6️⃣ Use insights from the dashboard in team meetings, planning sessions, budgeting reviews, and growth strategies to make better farming decisions.
👥 Who Can Benefit from This Agriculture and Farm Dashboard in Power BI
🌾 Farmers and Farm Owners — Track revenue, costs, and profitability across crops and seasons in a centralized Power BI report.
🌾 Agronomists and Agricultural Consultants — Analyze crop yield, soil type performance, and regional trends for clients using interactive visuals.
🌾 Agricultural Businesses and Cooperatives — Monitor multi-farm operations with centralized data and dynamic slicers.
🌾 Agricultural Students and Researchers — Use real-world data structures for academic projects and data visualization research.
🌾 Government and NGO Agricultural Programs — Track program outcomes, regional performance, and resource allocation effectively.
Also explore the Vertical Farming Dashboard in Power BI and the Agriculture Dashboard in Power BI for more agricultural analytics solutions.
❓ Frequently Asked Questions
What KPIs does the Agriculture and Farm Dashboard in Power BI track?
The Agriculture and Farm Dashboard in Power BI tracks 5 key performance indicators: Total Revenue, Net Farm Profit, Avg Yield Per Acre, Total Records, and Profit Margin. Additionally, it provides analysis across crops, regions, seasons, soil types, irrigation methods, and buyer types across 5 interactive pages.
Do I need advanced Power BI skills to use this dashboard?
No. Simply open the .pbix file in Power BI Desktop, replace the sample data with your own farm records, and click Refresh. All charts, KPI cards, and slicers update automatically. No DAX formulas or data modeling knowledge is required.
Can I customize the crops, regions, and seasons in this dashboard?
Yes. The dashboard is fully data-driven. When you update the data source with your own crop names, regions, seasons, and other fields, the dashboard adapts automatically to reflect your unique farm data.
What is the best Power BI dashboard template for agriculture and farming?
The Agriculture and Farm Dashboard in Power BI by NextGenTemplates is one of the best options available. It includes 5 interactive pages covering overview, crop analysis, regional view, season trends, and operations — providing comprehensive farm analytics in one report.
How do I track farm revenue and crop yield in Power BI?
You can use the Agriculture and Farm Dashboard in Power BI to track farm revenue and crop yield. Import your farming data into the .pbix file, and the dashboard automatically generates charts showing revenue by region, yield by crop, profit margins, and seasonal trends across all 5 analysis pages.
Is this template compatible with Excel data?
Yes. The Power BI dashboard can connect directly to Excel files as a data source. Simply point the data connection to your Excel workbook and click Refresh to update all dashboard visuals. For a native Excel version, check out our Agriculture and Farm Dashboard in Excel.
🔗 Explore Related Templates
🔹 Agriculture and Farm Dashboard in Excel — Same agricultural analytics in a Microsoft Excel format with pivot tables and slicers.
🔹 Agriculture and Farm Dashboard in HTML — Browser-based agriculture dashboard with light/dark theme and CSV upload.
🔹 Vertical Farming Dashboard in Power BI — Advanced vertical farming analytics with Power BI visuals for indoor farming operations.


Reviews
There are no reviews yet.