Managing performance in adhesives and sealants manufacturing is no longer optional — it is essential for survival in today’s competitive industrial environment. Production efficiency, quality consistency, cost control, and operational visibility directly impact profitability. However, many companies still rely on disconnected spreadsheets and manual reporting methods that slow decision-making.
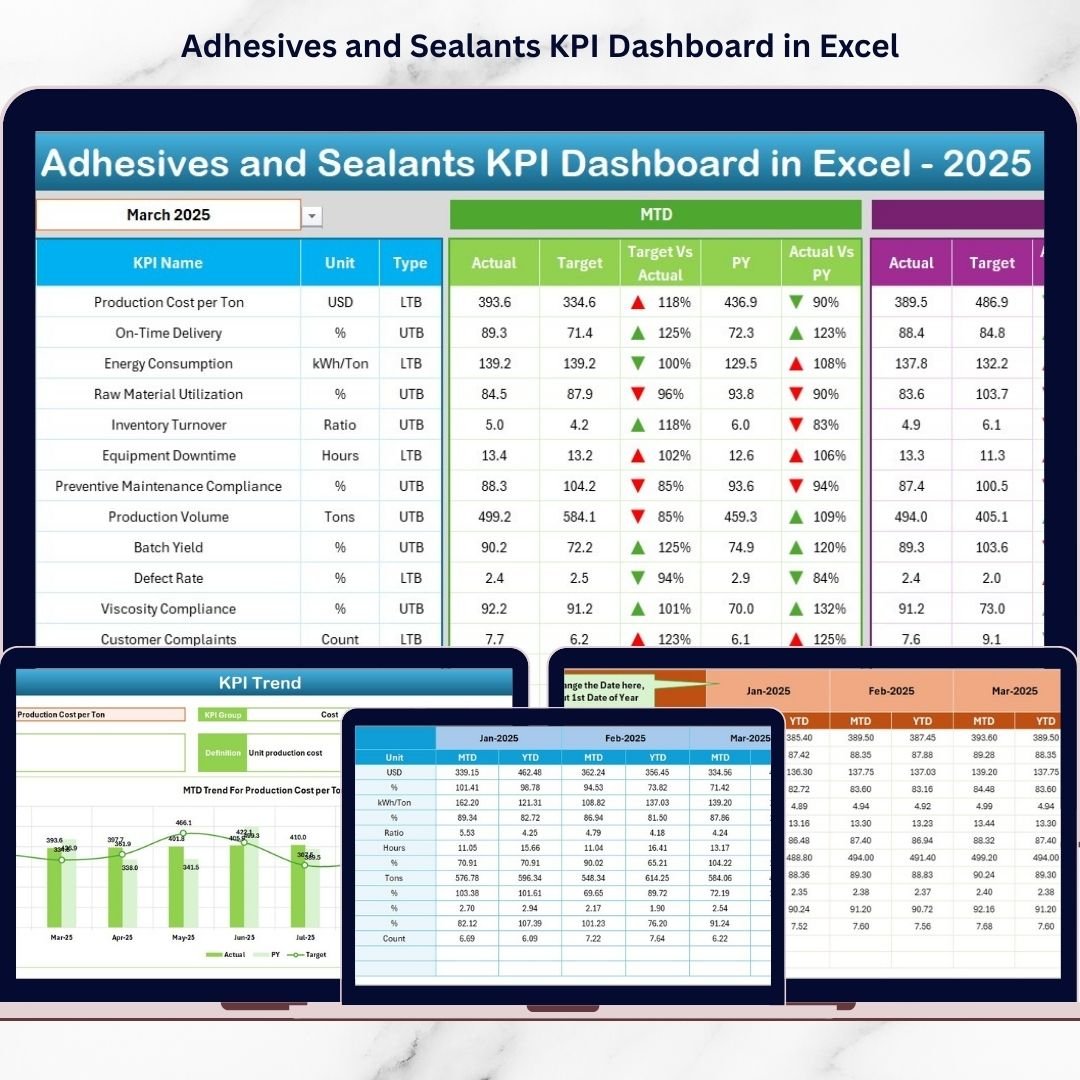
The Adhesives and Sealants KPI Dashboard in Excel is a powerful, ready-to-use performance management solution designed to transform raw operational data into actionable insights. Instead of analyzing multiple reports separately, this dashboard centralizes all Key Performance Indicators (KPIs) into one interactive Excel environment.
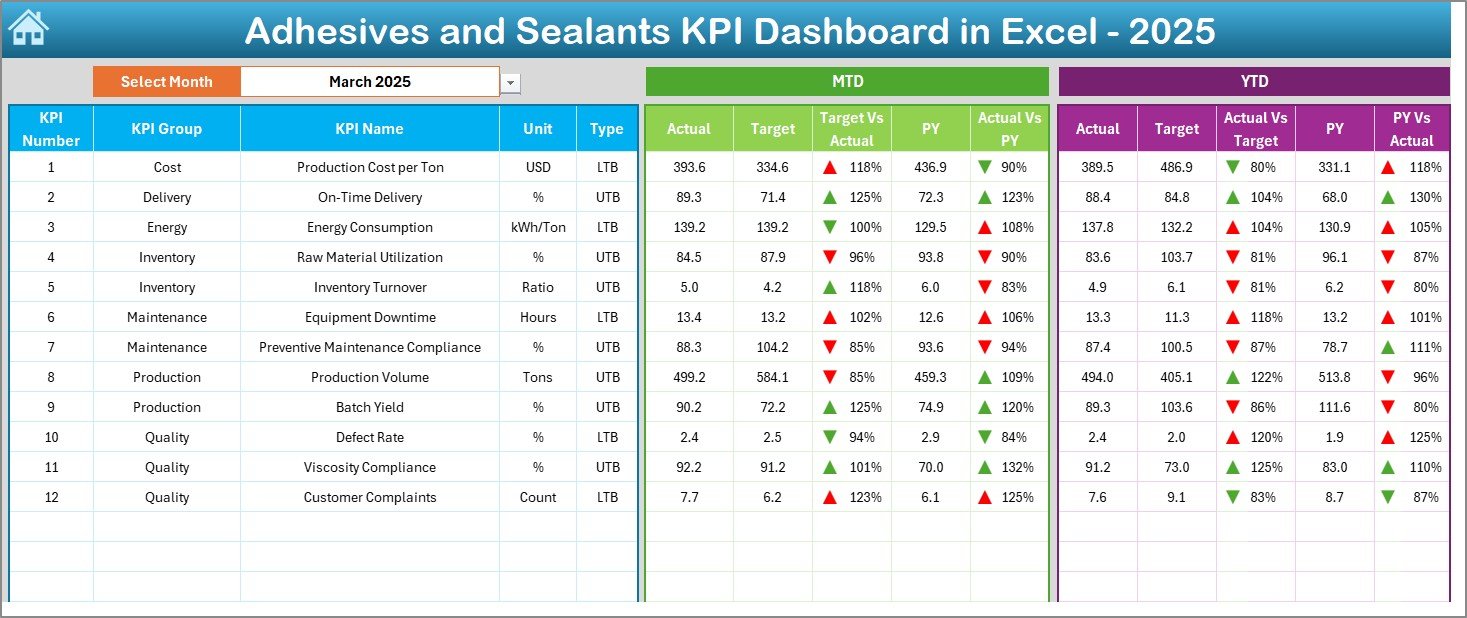
With automated calculations, dynamic visuals, and structured KPI tracking, managers can instantly monitor performance trends, compare targets, and identify improvement opportunities — all without complex software or technical expertise.
Whether you manage production, quality assurance, supply chain operations, or executive reporting, this dashboard helps you move from guesswork to data-driven decision-making.
🚀 Key Features of Adhesives and Sealants KPI Dashboard in Excel
✅ Interactive KPI dashboard with automated calculations
✅ Month selection control for instant performance updates
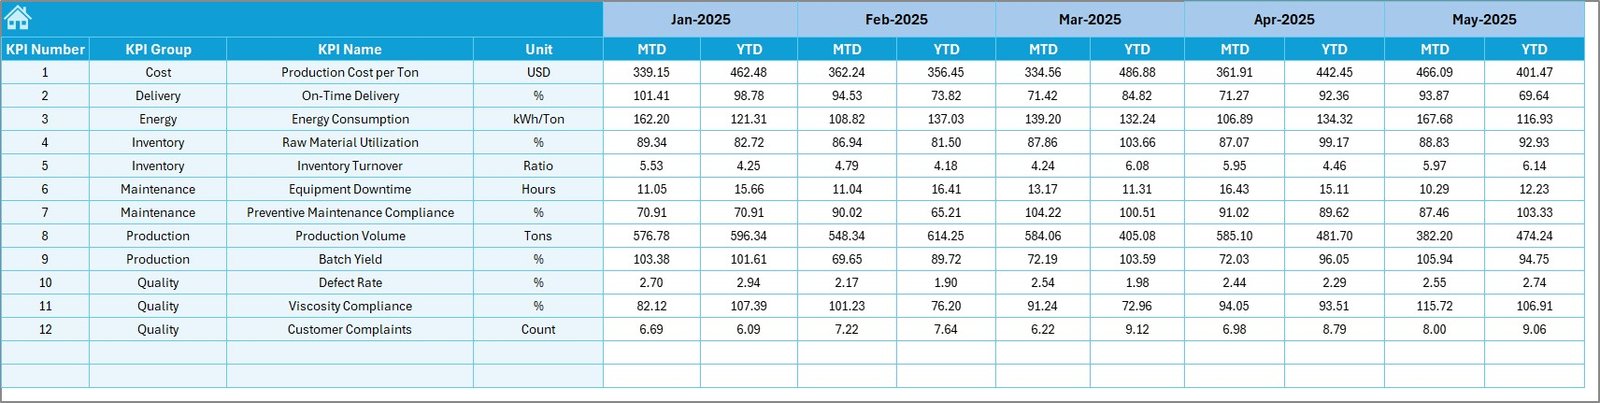
✅ MTD and YTD performance comparison analysis
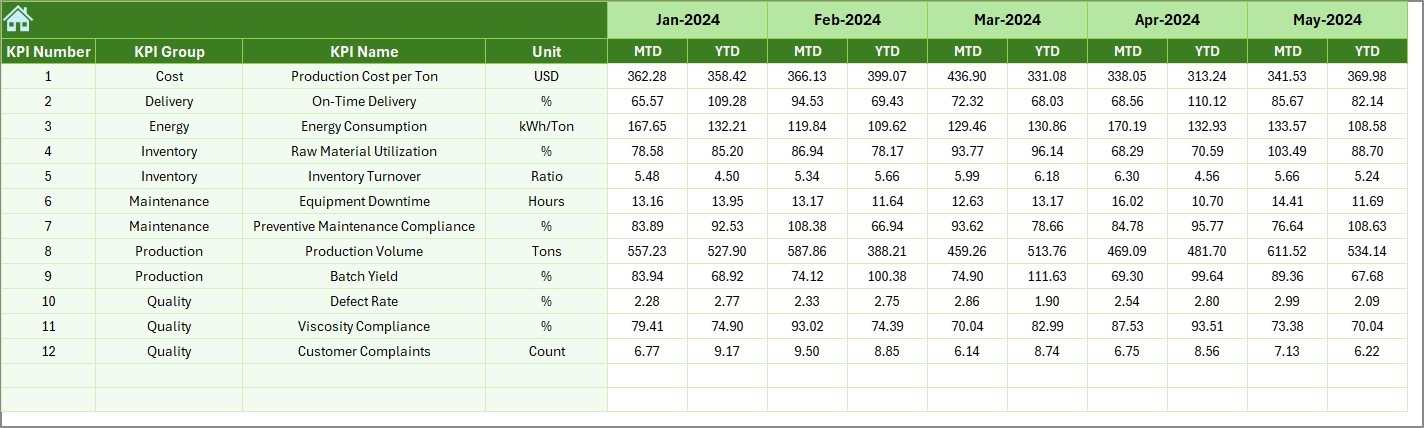
✅ Target vs Actual and Previous Year comparisons
✅ Visual indicators using arrows and color formatting
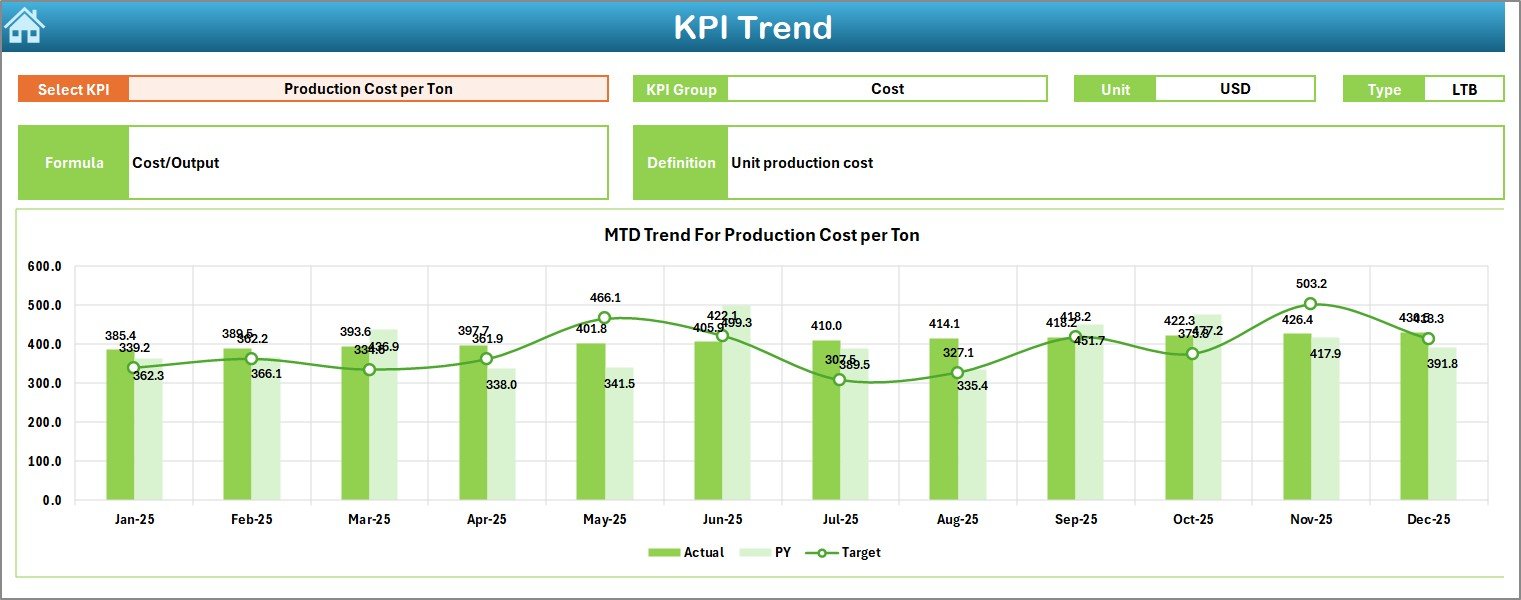
✅ Dynamic KPI trend analysis charts
✅ Structured data input sheets for easy updates
✅ Historical performance tracking capability
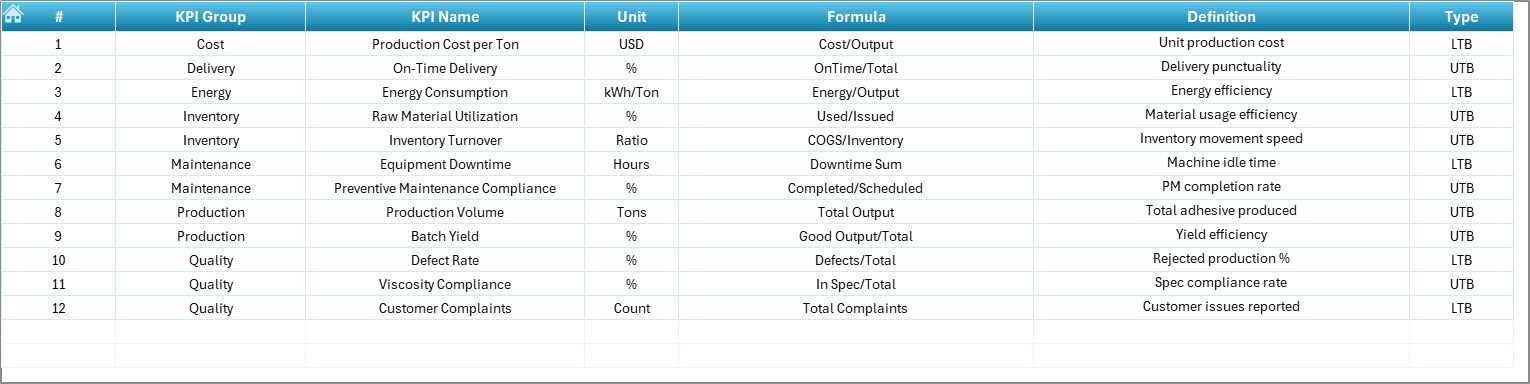
✅ KPI documentation and definition management
✅ Professional and user-friendly navigation system
These features allow users to quickly understand operational performance without spending hours analyzing complex reports.
📦 What’s Inside the Adhesives and Sealants KPI Dashboard in Excel
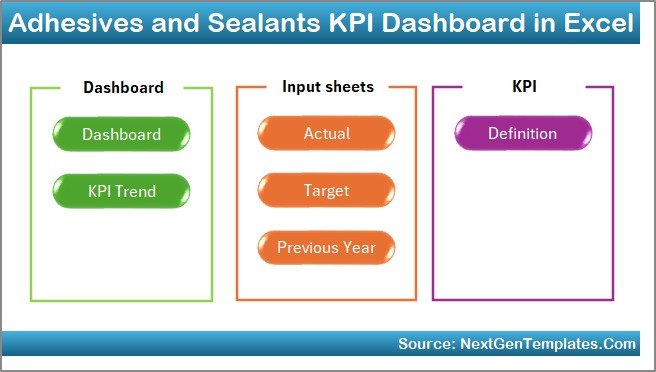
This ready-to-use system includes 7 professionally designed worksheets:
📊 Home Sheet – Central navigation hub with one-click accesses buttons.
📈 Dashboard Sheet – Main KPI overview displaying performance metrics instantly.
📉 KPI Trend Sheet – Detailed trend analysis with dynamic KPI selection.
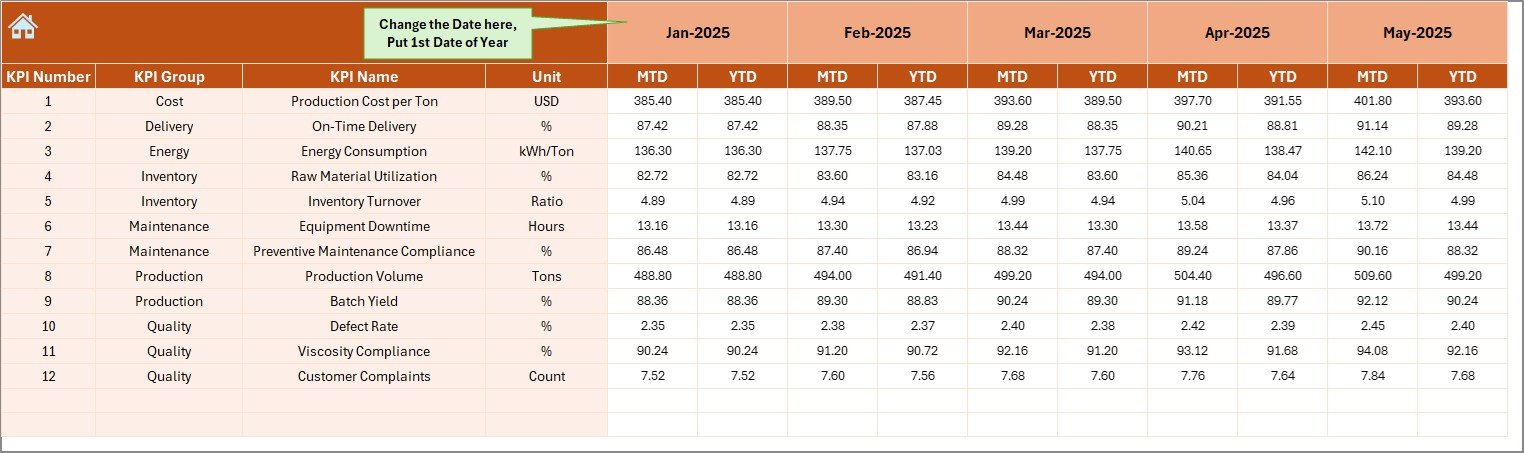
🧾 Actual Numbers Input Sheet – Simple data entry area for operational values.
🎯 Target Sheet – Define and manage KPI goals efficiently.
📅 Previous Year Data Sheet – Historical comparison for growth analysis.
📘 KPI Definition Sheet – Master database containing KPI formulas and descriptions.
Together, these sheets create a complete performance monitoring ecosystem.
⚙️ How to Use the Adhesives and Sealants KPI Dashboard in Excel
Using this dashboard is simple and requires no advanced Excel skills:
1️⃣ Enter operational data in the Actual Numbers Input Sheet.
2️⃣ Define targets in the Target Sheet.
3️⃣ Store historical values in the Previous Year Sheet.
4️⃣ Select the desired month from the dropdown menu.
5️⃣ Instantly analyze KPIs through automated charts and indicators.
Because calculations update automatically, users save time while maintaining reporting accuracy.
👥 Who Can Benefit from This Adhesives and Sealants KPI Dashboard in Excel
This dashboard is ideal for:
🏭 Adhesives & sealants manufacturers
📊 Production managers and plant supervisors
🔬 Quality assurance teams
📦 Supply chain and operations professionals
💼 Business analysts and executives
📈 Manufacturing consultants
🏢 Small and medium industrial companies
Anyone responsible for monitoring manufacturing performance can use this dashboard to improve efficiency and accountability.
Organizations using structured KPI monitoring gain significant advantages such as improved visibility, faster decision-making, reduced reporting effort, and better alignment between operational goals and business strategy. Instead of reacting to problems late, teams can proactively manage performance using clear visual insights.
Excel’s familiar interface ensures quick adoption across departments while still delivering powerful analytics capabilities. As manufacturing continues evolving toward data-driven operations, this dashboard provides the perfect foundation for performance excellence.
By implementing the Adhesives and Sealants KPI Dashboard in Excel, companies establish a structured system that promotes continuous improvement, operational transparency, and smarter decision-making.
Click here to read the Detailed blog post
Visit our YouTube channel to learn step-by-step video tutorials
👉 Youtube.com/@PKAnExcelExpert