Managing production, costs, and profitability in the adhesives and sealants industry can be extremely complex. Companies must track raw material costs, plant performance, regional demand, and product category profitability while ensuring efficient manufacturing operations.
To simplify this process, we created the Adhesives and Sealants Dashboard in Power BI — a powerful and interactive analytics solution designed to help manufacturers transform raw operational data into meaningful business insights.
This ready-to-use Power BI dashboard enables companies to monitor revenue, production costs, raw material expenses, and profit margins while analyzing plant performance, regional sales trends, and product category performance — all from one centralized platform.
With interactive slicers, dynamic charts, and clear KPI indicators, decision-makers can quickly identify trends, detect inefficiencies, and make smarter strategic decisions.
🚀 Key Feature of Adhesives and Sealants Dashboard in Power BI
The dashboard is designed to provide powerful manufacturing insights through an intuitive and interactive Power BI interface.
✨ Interactive KPI Monitoring
Instantly track important KPIs such as Revenue, Production Cost, Raw Material Cost, Profit Amount, and Profit Margin %.
📊 Multiple Analytical Pages
The dashboard includes five powerful analysis pages to help managers evaluate performance from different business perspectives.
🏭 Plant Performance Analysis
Compare revenue, production costs, and profit margins across multiple plant locations.
🌍 Regional Sales Insights
Understand how different regions contribute to revenue and profitability.
📦 Product Category Performance Tracking
Analyze which adhesive or sealant product categories generate the highest revenue and profits.
📅 Monthly Performance Trends
Track profit margin trends and production cost patterns across months.
⚡ Interactive Power BI Filters & Slicers
Users can filter data dynamically by region, product category, plant location, and time period.
📈 Clear Data Visualization
Interactive charts and visual reports make complex manufacturing data easy to understand.
💡 Better Strategic Decision-Making
Managers can quickly identify profitable segments, operational inefficiencies, and growth opportunities.
📊 What’s Inside the Adhesives and Sealants Dashboard in Power BI
This dashboard contains five fully interactive pages designed to provide complete operational visibility.
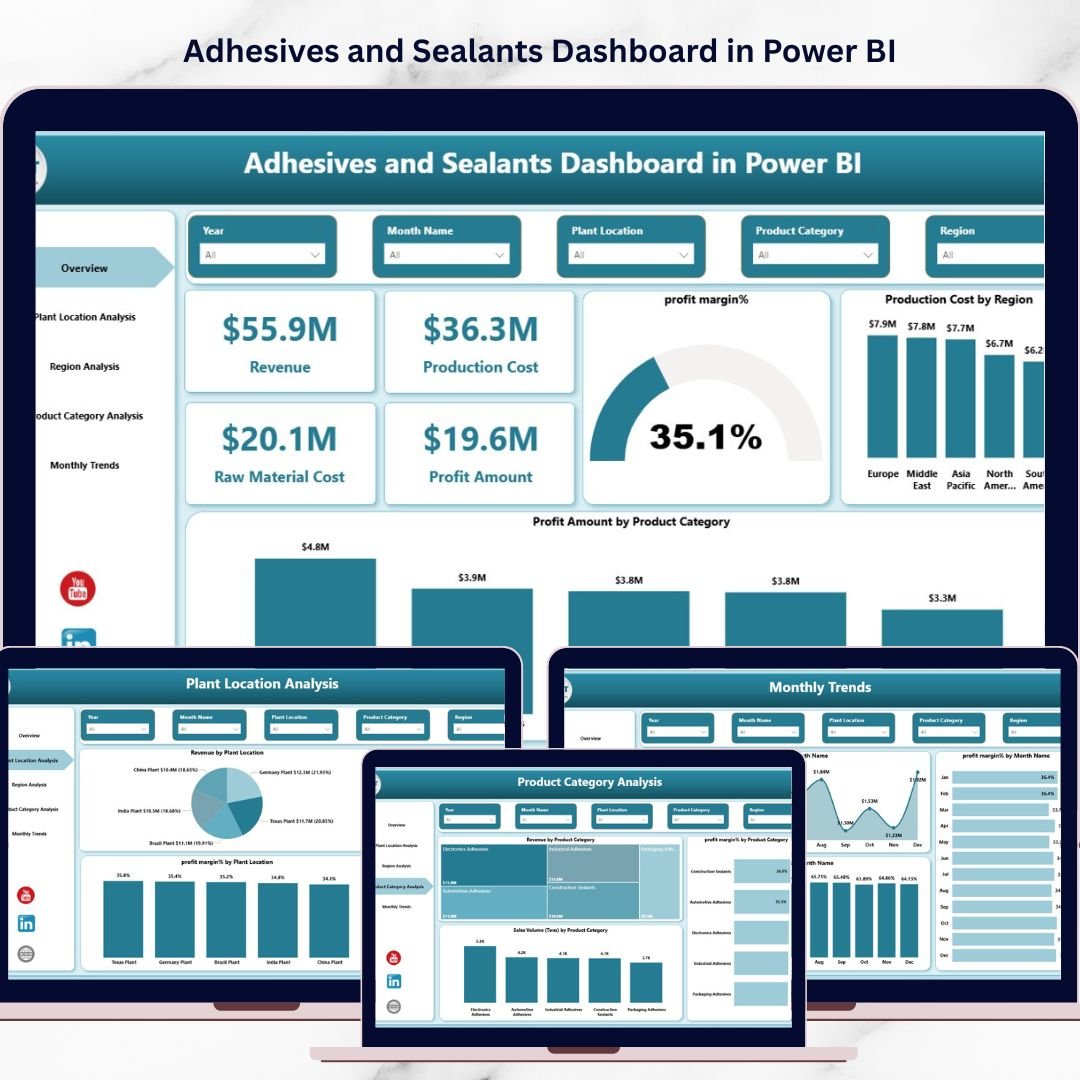
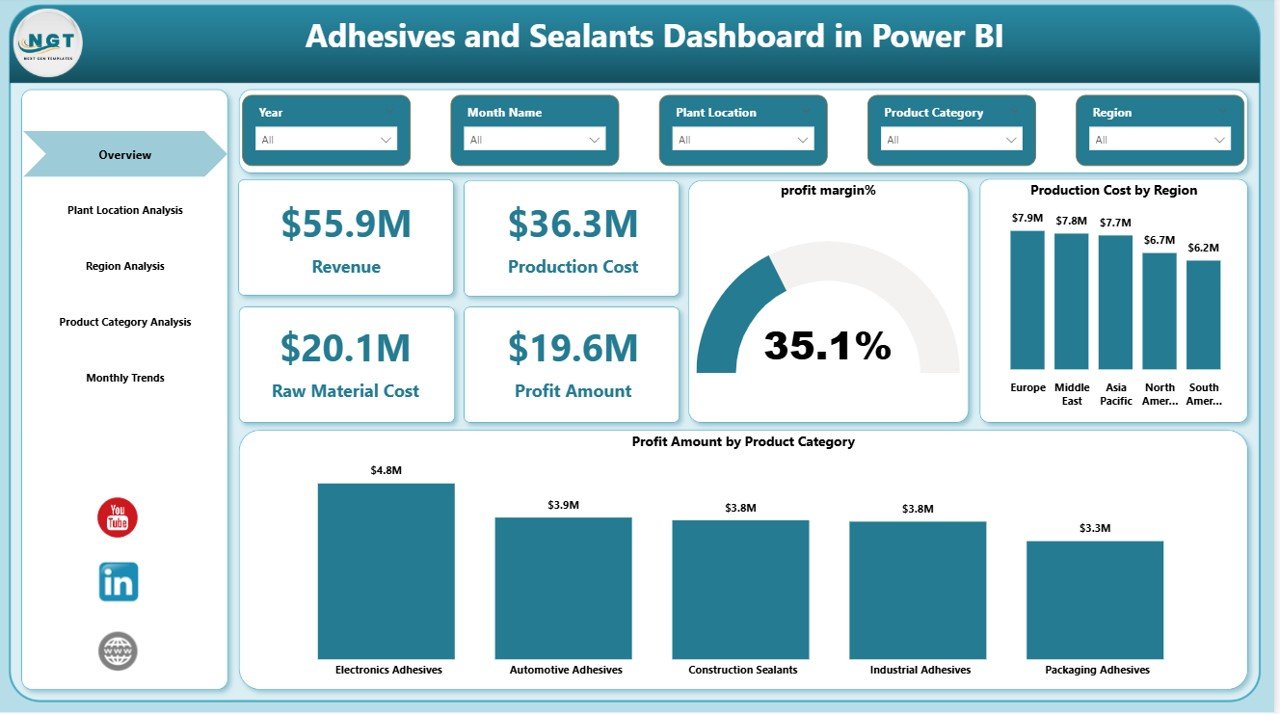
1️⃣ Overview Page
The Overview Page provides a quick snapshot of overall business performance.
Key KPI Cards include:
-
Revenue
-
Production Cost
-
Raw Material Cost
-
Profit Amount
-
Profit Margin %
Charts included:
-
Profit Margin %
-
Production Cost by Region
-
Profit Amount by Product Category
This page allows managers to quickly understand profitability trends and cost distribution.
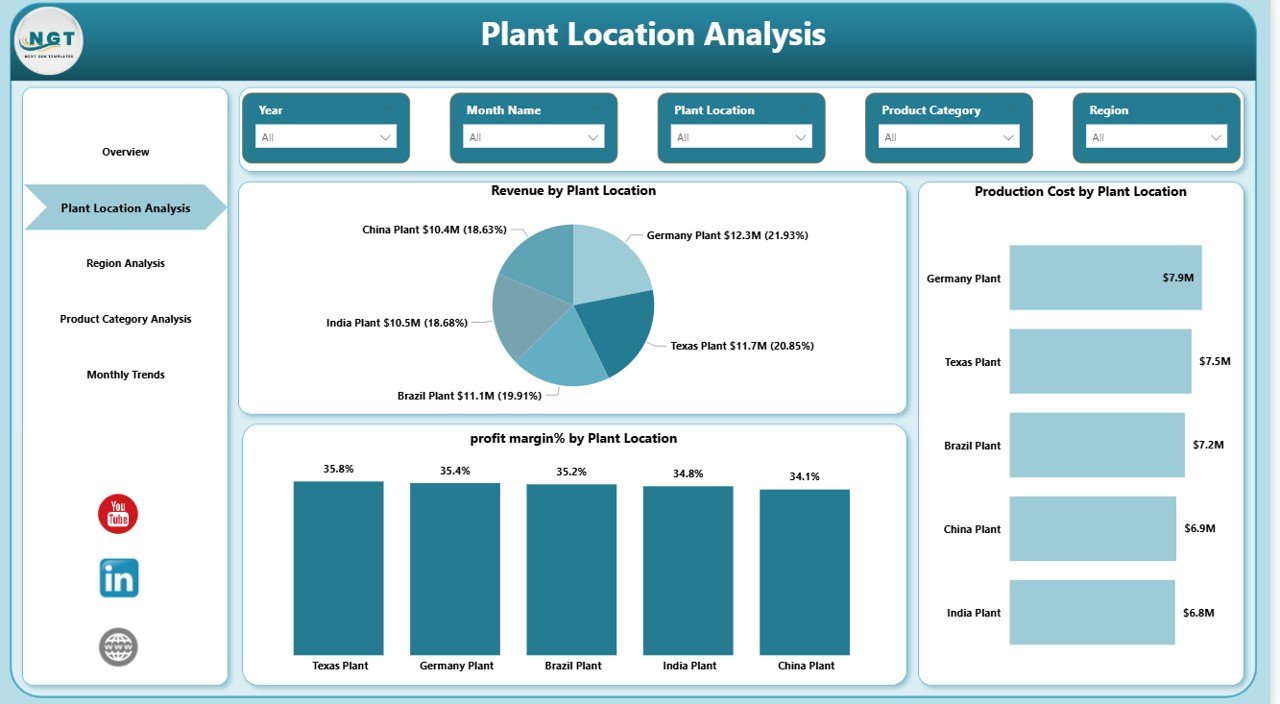
2️⃣ Plant Location Analysis
Manufacturing companies often operate multiple plants. This page helps evaluate plant-level efficiency and profitability.
Charts include:
-
Revenue by Plant Location
-
Production Cost by Plant Location
-
Profit Margin % by Plant Location
These insights allow companies to compare plant performance and identify operational inefficiencies.
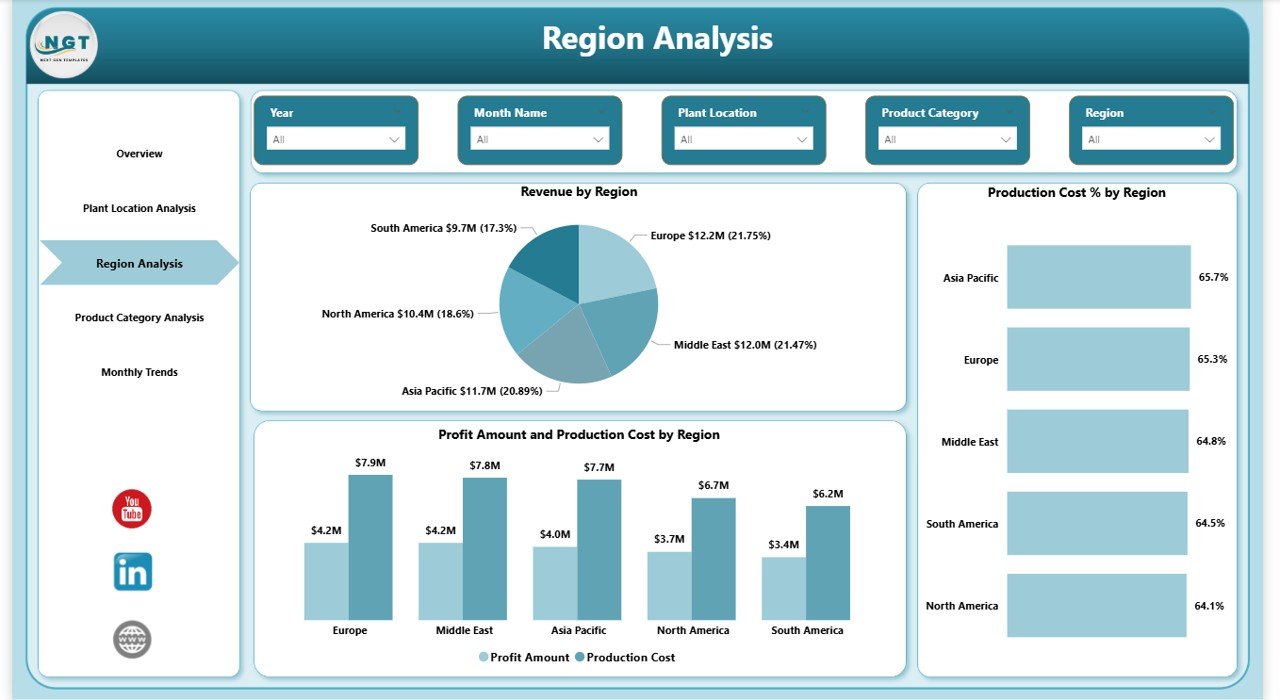
3️⃣ Region Analysis
The Region Analysis Page helps businesses monitor market performance across different regions.
Charts include:
-
Revenue by Region
-
Production Cost % by Region
-
Profit Amount and Production Cost by Region
Managers can easily identify strong and weak markets using these insights.
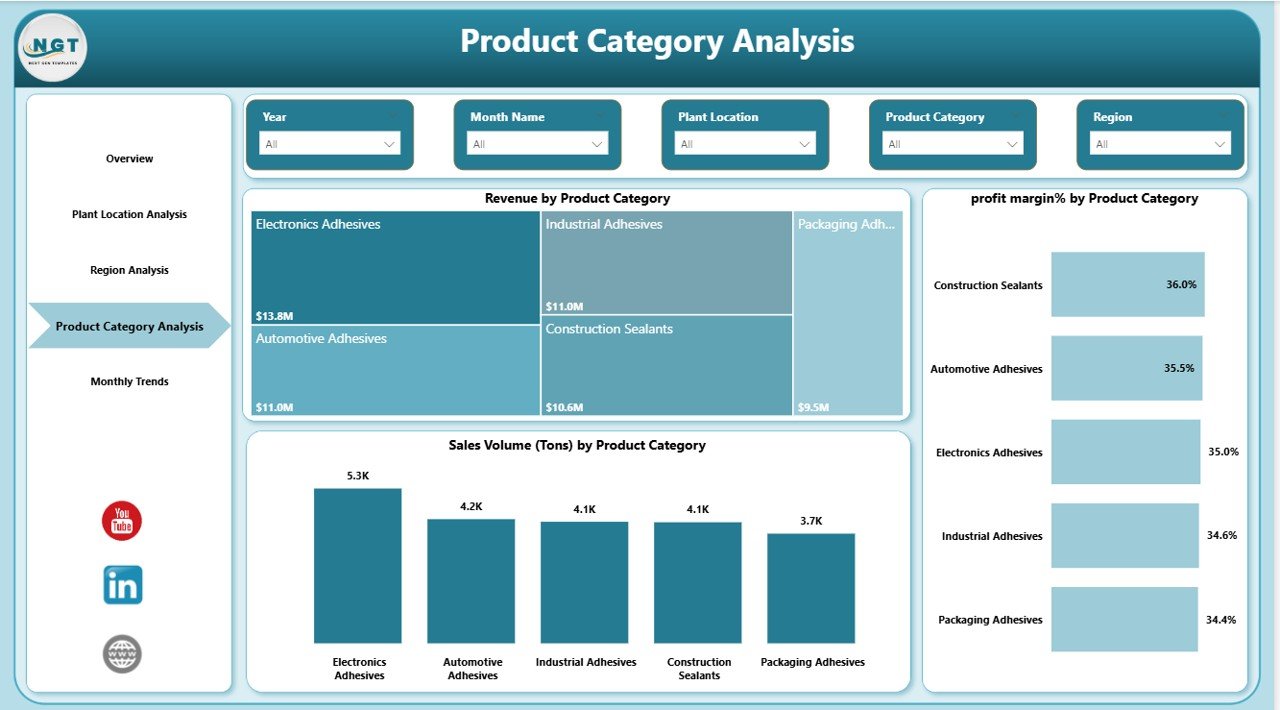
4️⃣ Product Category Analysis
Adhesives and sealants manufacturers often produce multiple product types. This page helps analyze product-level profitability.
Charts include:
-
Revenue by Product Category
-
Profit Margin % by Product Category
-
Sales Volume (Tons) by Product Category
Companies can quickly determine which product categories generate the highest revenue and profits.
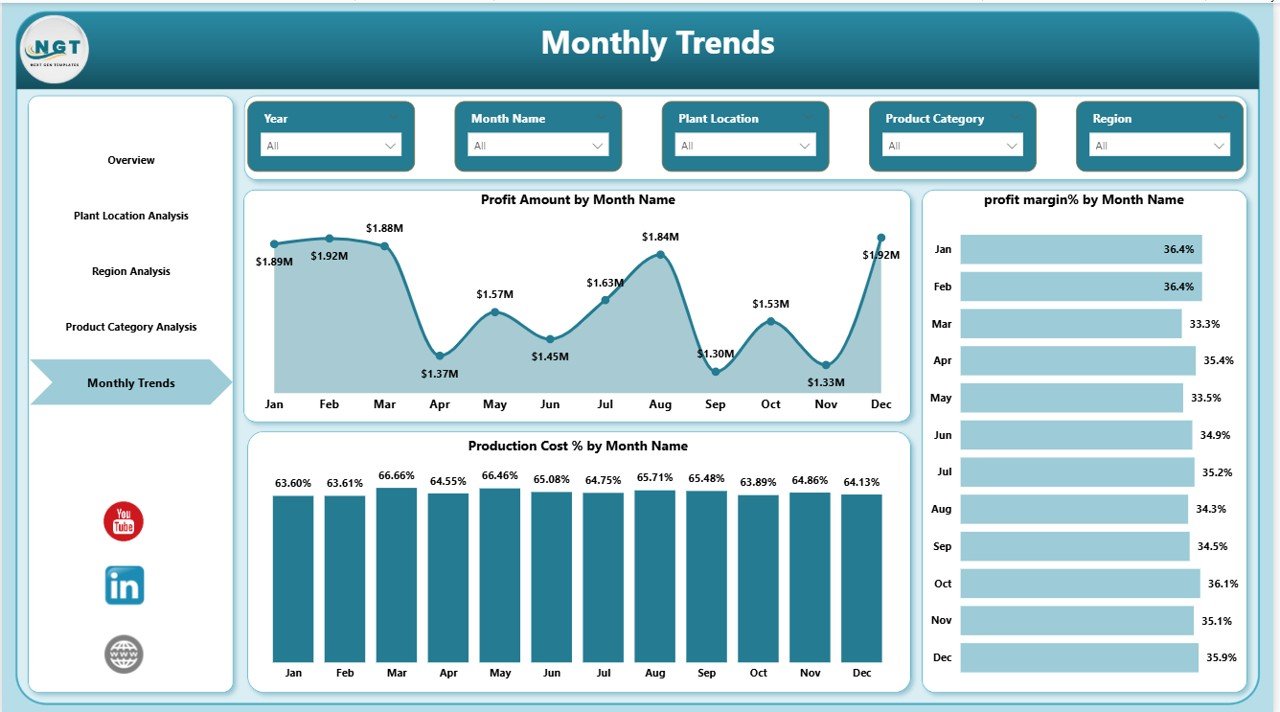
5️⃣ Month Analysis
Tracking monthly trends is essential for identifying cost fluctuations and seasonal demand.
Charts include:
-
Profit Amount by Month
-
Profit Margin % by Month
-
Production Cost % by Month
This page helps businesses monitor financial trends and respond quickly to cost changes.
⚙️ How to Use the Adhesives and Sealants Dashboard in Power BI
Using this dashboard is simple and efficient.
1️⃣ Import your manufacturing or sales dataset into Power BI.
2️⃣ Connect the data model to the dashboard template.
3️⃣ Use interactive slicers to filter data by region, plant, product category, or month.
4️⃣ Monitor KPI cards and charts to evaluate operational performance.
5️⃣ Identify profitability trends and optimize production strategies.
Even users with basic Power BI knowledge can quickly start analyzing their manufacturing data.
👥 Who Can Benefit from This Adhesives and Sealants Dashboard
This dashboard is ideal for professionals working in manufacturing and industrial sectors.
🏭 Manufacturing Managers – Monitor plant performance and production efficiency.
💰 Finance Teams – Track revenue, production costs, and profitability.
⚙️ Operations Managers – Analyze operational performance across plants.
📊 Business Analysts – Identify trends and strategic growth opportunities.
🌍 Sales Managers – Monitor regional sales performance and product demand.
🏢 Executive Leadership Teams – Make data-driven strategic decisions.
Click here to read the Detailed blog post
Watch the step-by-step video tutorial:
Visit our YouTube channel to learn step-by-step video tutorials
<a href=”https://www.youtube.com/@PKAnExcelExpert”>YouTube channel</a>


