Modern additive manufacturing operations generate massive amounts of production data every day. However, without a structured analytics system, this data often remains unused. That is exactly where the Additive Manufacturing KPI Dashboard in Power BI becomes a game-changer.This professionally designed, ready-to-use dashboard helps manufacturing teams monitor performance, track production KPIs, and make faster data-driven decisions — all from one centralized platform.
Instead of reviewing scattered spreadsheets or manual machine reports, this dashboard transforms Excel data into powerful interactive Power BI visuals. As a result, managers instantly identify performance gaps, monitor efficiency, and improve operational outcomes.
Whether you manage 3D printing production, quality control, or operational performance, this dashboard gives you complete visibility into your manufacturing KPIs.
⭐ Key Features of Additive Manufacturing KPI Dashboard in Power BI
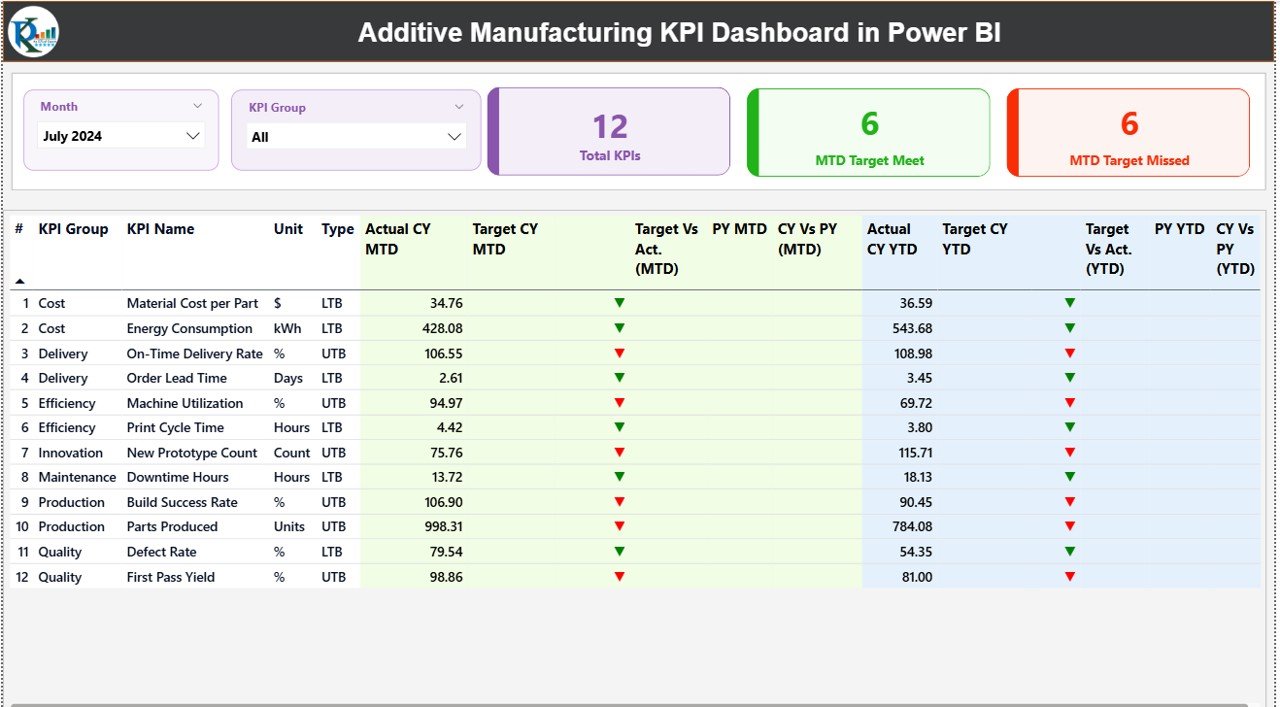
✅ Interactive Summary Page providing complete KPI performance overview
✅ Dynamic slicers for Month and KPI Group filtering
✅ Automatic comparison of Actual vs Target performance
✅ MTD (Month-to-Date) and YTD (Year-to-Date) analysis in one view
✅ Previous Year comparison for historical performance tracking
✅ Visual performance indicators using ▲ and ▼ icons
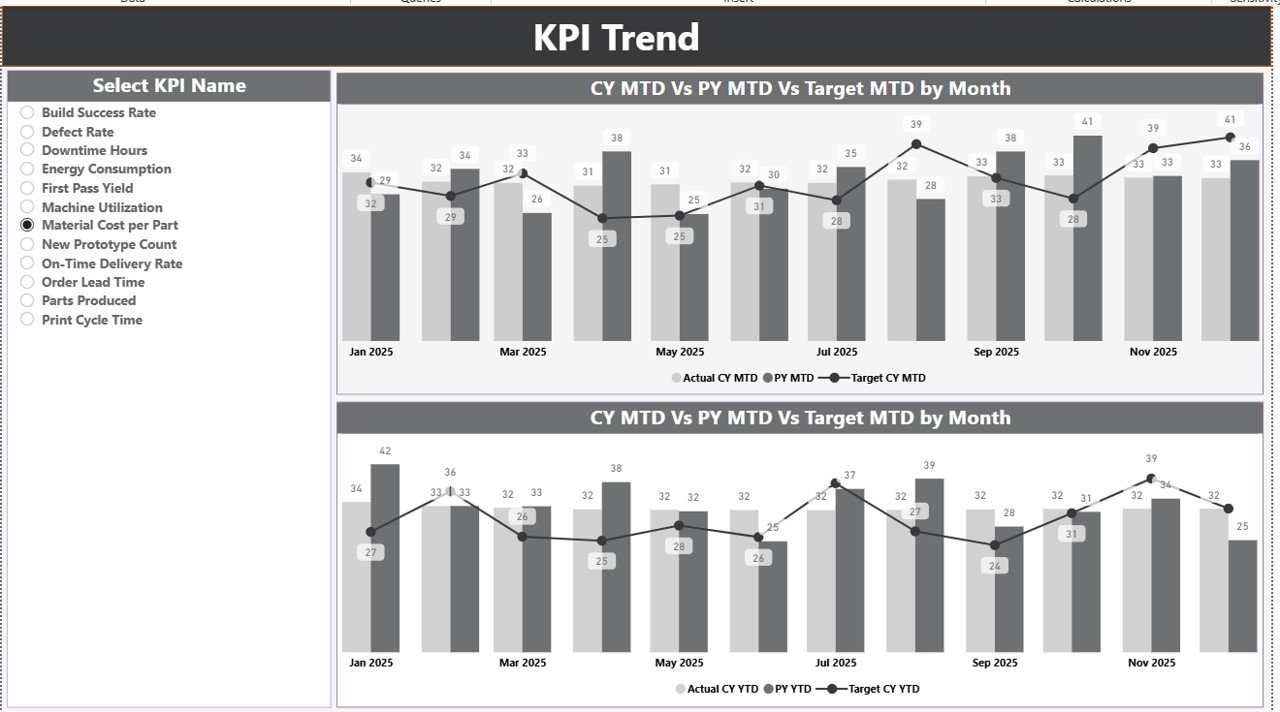
✅ KPI Trend analysis with interactive combo charts
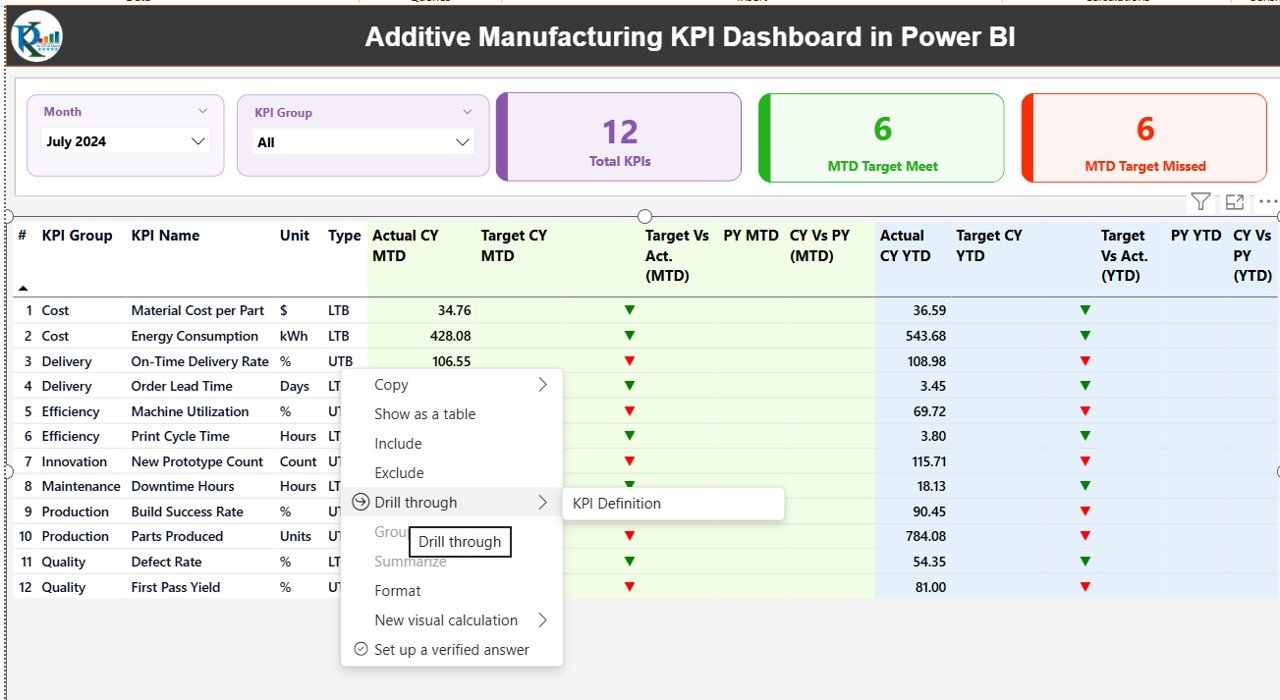
✅ Drill-through KPI Definition page for detailed insights
✅ Excel-based data entry for easy implementation
✅ Fully customizable KPI structure for any manufacturing setup
This dashboard allows decision-makers to move from reactive reporting to proactive performance management.
📦 What’s Inside the Additive Manufacturing KPI Dashboard
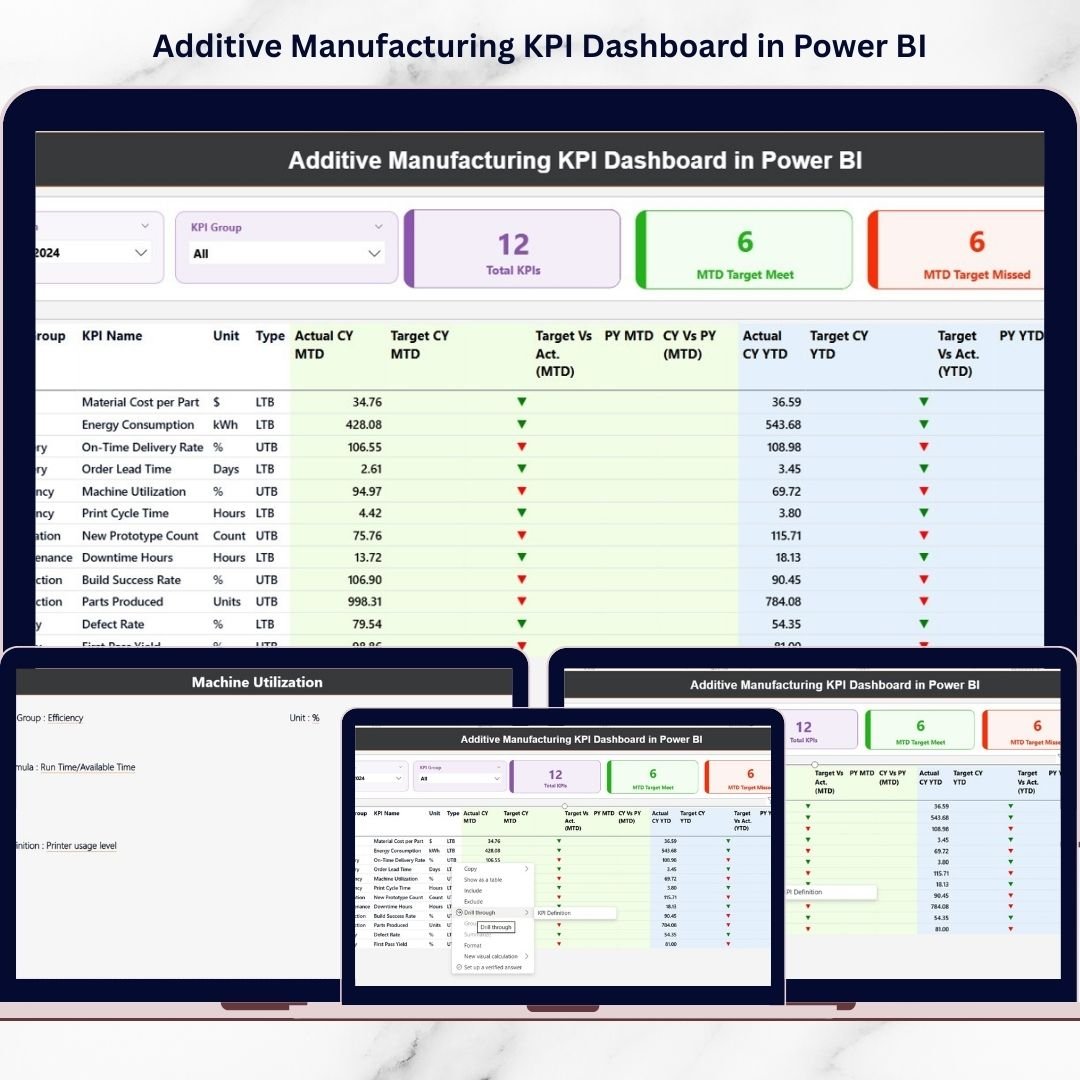
The dashboard includes three powerful analytical pages designed for different levels of analysis:
1️⃣ Summary Page – Performance Control Center
View KPI counts, target achievements, and detailed performance tables in one place. Quickly identify which KPIs meet or miss targets.
2️⃣ KPI Trend Page – Performance Movement Analysis
Analyze monthly trends using interactive charts comparing Current Year, Previous Year, and Target values.
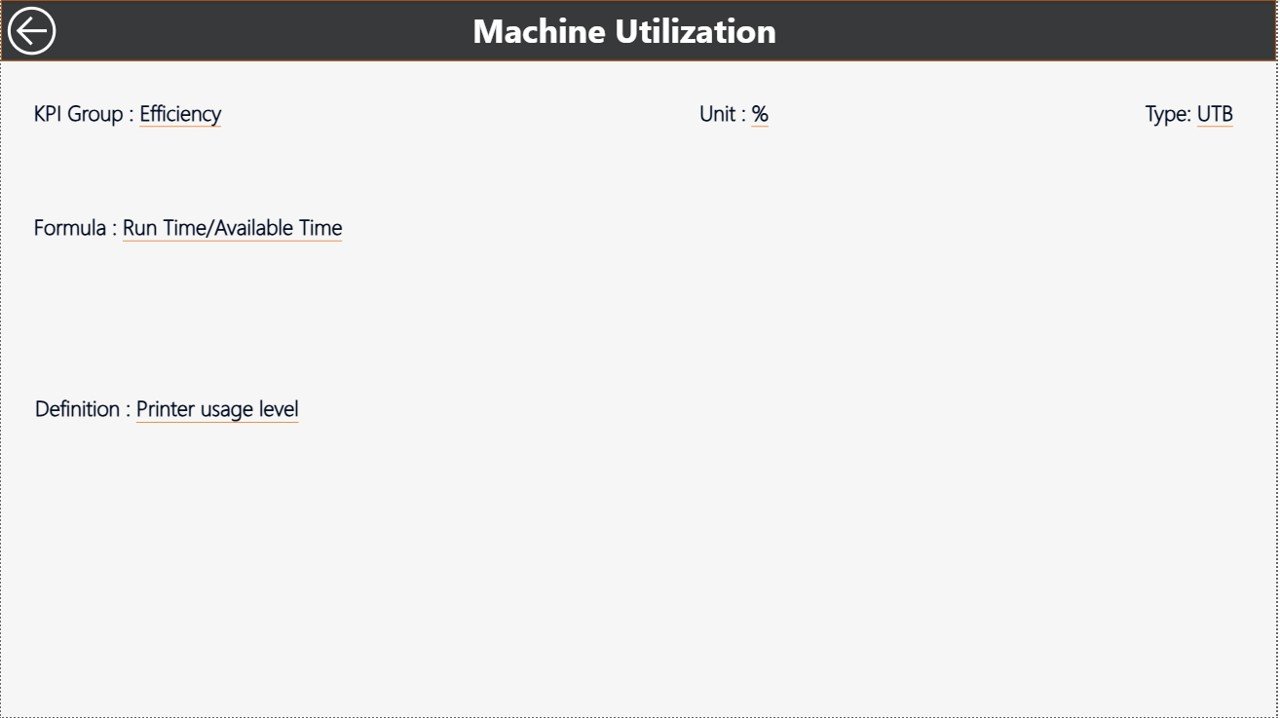
3️⃣ KPI Definition Drill-Through Page
Right-click any KPI to view formulas, definitions, units, and KPI logic for complete clarity.
Additionally, the dashboard connects to an organized Excel data source containing:
-
Input_Actual Sheet
-
Input_Target Sheet
-
KPI Definition Sheet
Simply update Excel data and refresh Power BI — visuals update automatically.
🚀 How to Use the Additive Manufacturing KPI Dashboard
Using the dashboard requires no advanced Power BI expertise.
1️⃣ Open the Excel data file
2️⃣ Enter actual KPI values in Input_Actual sheet
3️⃣ Add targets in Input_Target sheet
4️⃣ Maintain KPI definitions
5️⃣ Refresh Power BI dataset
6️⃣ Select Month or KPI Group using slicers
7️⃣ Review Summary insights
8️⃣ Analyze trends on KPI Trend page
9️⃣ Drill through KPIs for deeper understanding
Within minutes, you gain a complete performance overview of your additive manufacturing operations.
👥 Who Can Benefit from This Additive Manufacturing KPI Dashboard
This dashboard is ideal for:
-
Manufacturing Managers
-
Production Engineers
-
Operations Leaders
-
Quality Assurance Teams
-
Plant Directors
-
Data Analysts
-
Smart Factory Teams
Both technical and non-technical users can easily monitor KPIs thanks to intuitive visuals and structured reporting.
Organizations using this dashboard can:
✔ Improve production efficiency
✔ Track quality performance
✔ Monitor machine utilization
✔ Control manufacturing costs
✔ Support strategic decision-making
By combining Excel simplicity with Power BI intelligence, this solution delivers a powerful yet easy-to-use manufacturing analytics system. It helps organizations reduce inefficiencies, improve accountability, and achieve continuous operational improvement.
If you want real-time clarity instead of manual reporting confusion, this dashboard is your perfect manufacturing analytics companion.
Click here to read the Detailed blog post
Watch the step-by-step video tutorial: