Additive Manufacturing Dashboard, commonly known as 3D printing, has revolutionized modern manufacturing processes. Industries such as aerospace, automotive, healthcare, and consumer goods increasingly rely on additive manufacturing to produce complex components with greater speed and efficiency. However, managing these advanced manufacturing operations requires continuous monitoring of production performance, machine efficiency, material usage, and maintenance costs.
Because additive manufacturing environments generate large volumes of operational data, organizations must organize this information effectively. Without a centralized analytics system, managers often struggle to identify production inefficiencies, monitor cost trends, or evaluate product quality.
This is where the Additive Manufacturing Dashboard in Power BI becomes extremely valuable.
This ready-to-use Power BI dashboard transforms manufacturing data into interactive visual insights. Instead of reviewing multiple spreadsheets or reports, managers can monitor production performance, analyze costs, track build quality, and evaluate operational efficiency from a single centralized dashboard.
Because Power BI provides powerful visualization tools, dynamic filters, and advanced analytics capabilities, manufacturers can quickly detect inefficiencies and make data-driven decisions that improve productivity and profitability.
⚙️ Key Feature of Additive Manufacturing Dashboard in Power BI
This Power BI dashboard includes powerful analytical capabilities designed to monitor additive manufacturing operations effectively.
📊 Centralized Manufacturing Performance Dashboard – Monitor key production metrics in one interactive interface.
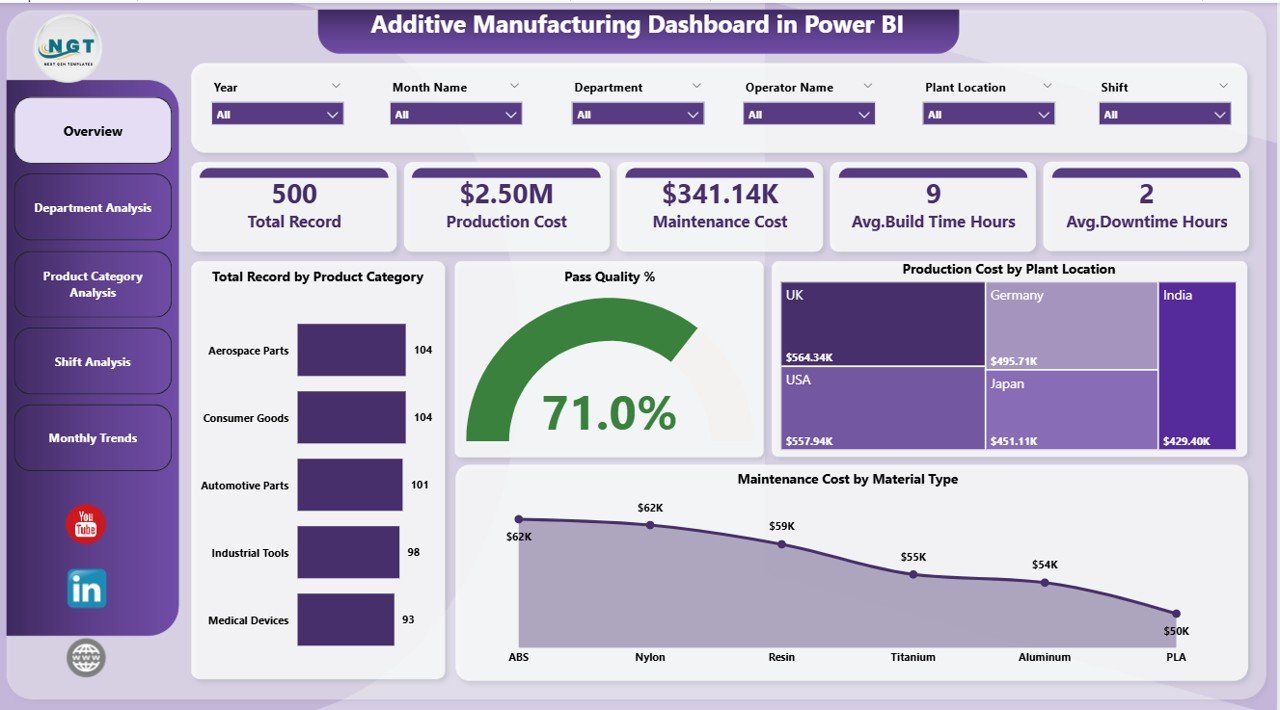
📈 Production Cost Monitoring by Plant Location – Identify plants with higher manufacturing expenses.
⭐ Pass Quality Performance Tracking – Evaluate product quality and production success rates.
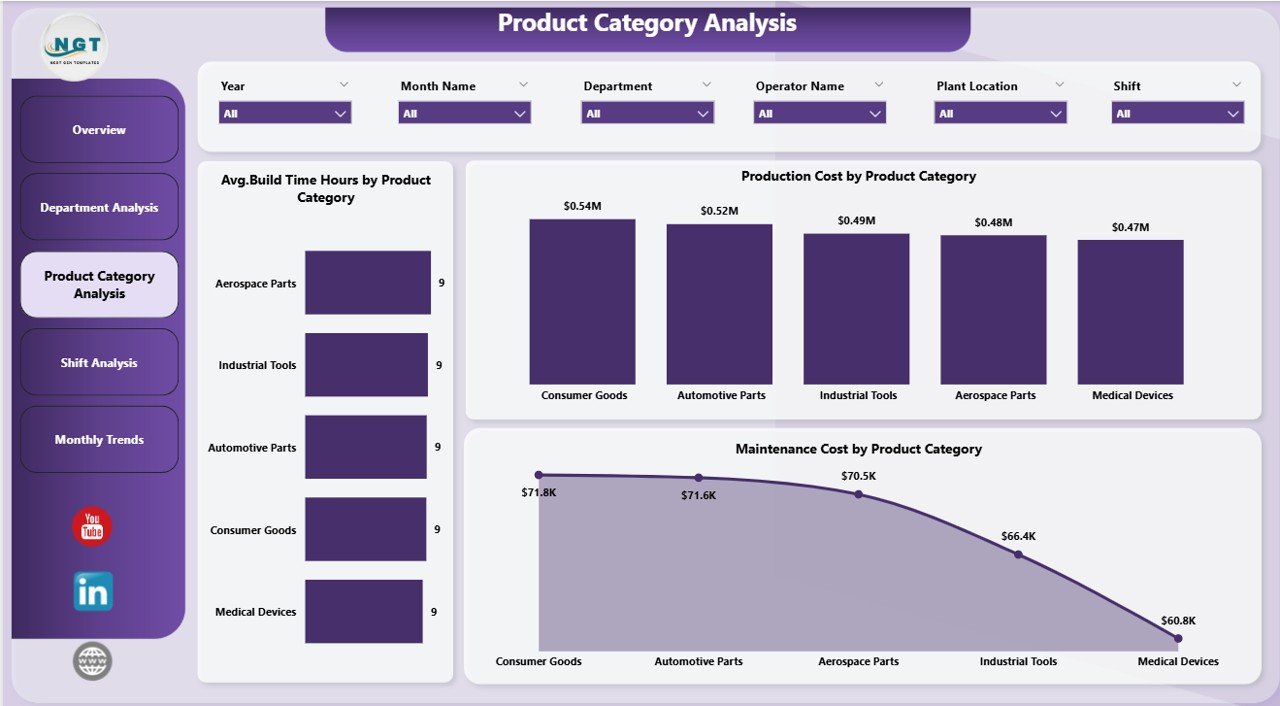
📦 Product Category Performance Analysis – Compare manufacturing metrics across product categories.
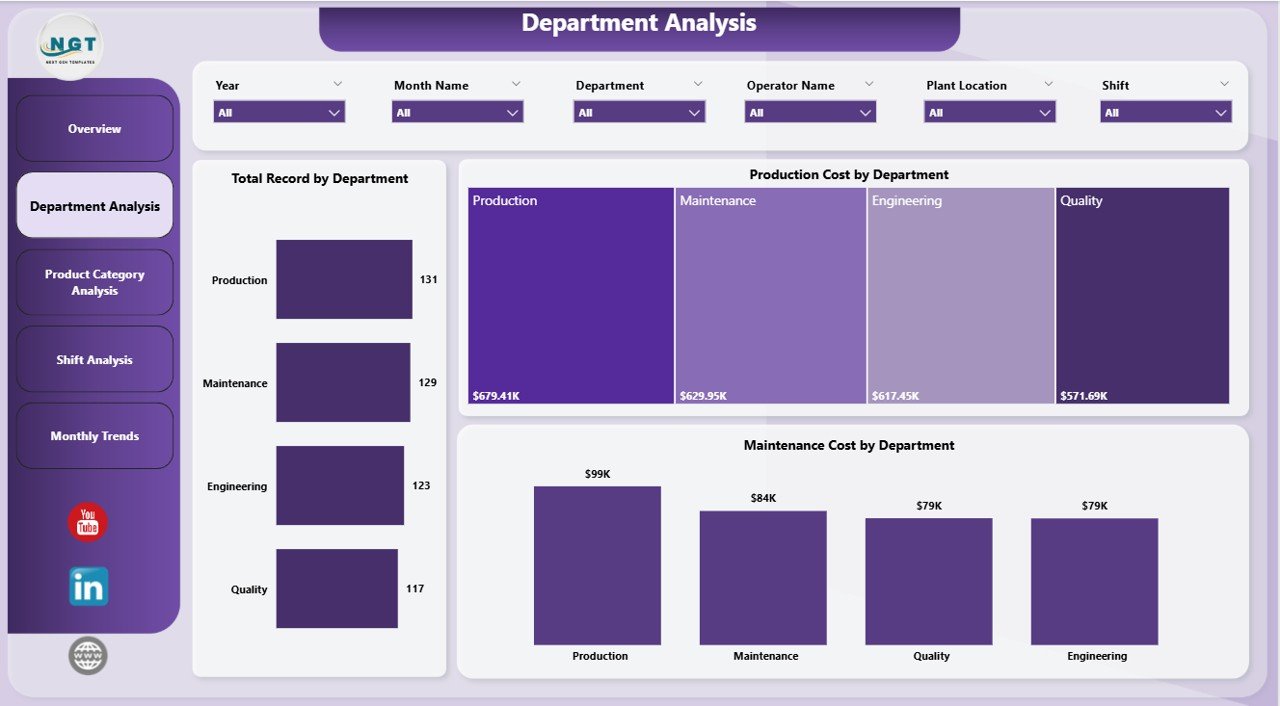
🏢 Department-Level Production Insights – Analyze operational performance across different departments.
⚙️ Maintenance Cost Monitoring by Material Type – Track maintenance expenses related to different materials.
⏱ Average Build Time Analysis – Monitor build time efficiency for different product categories.
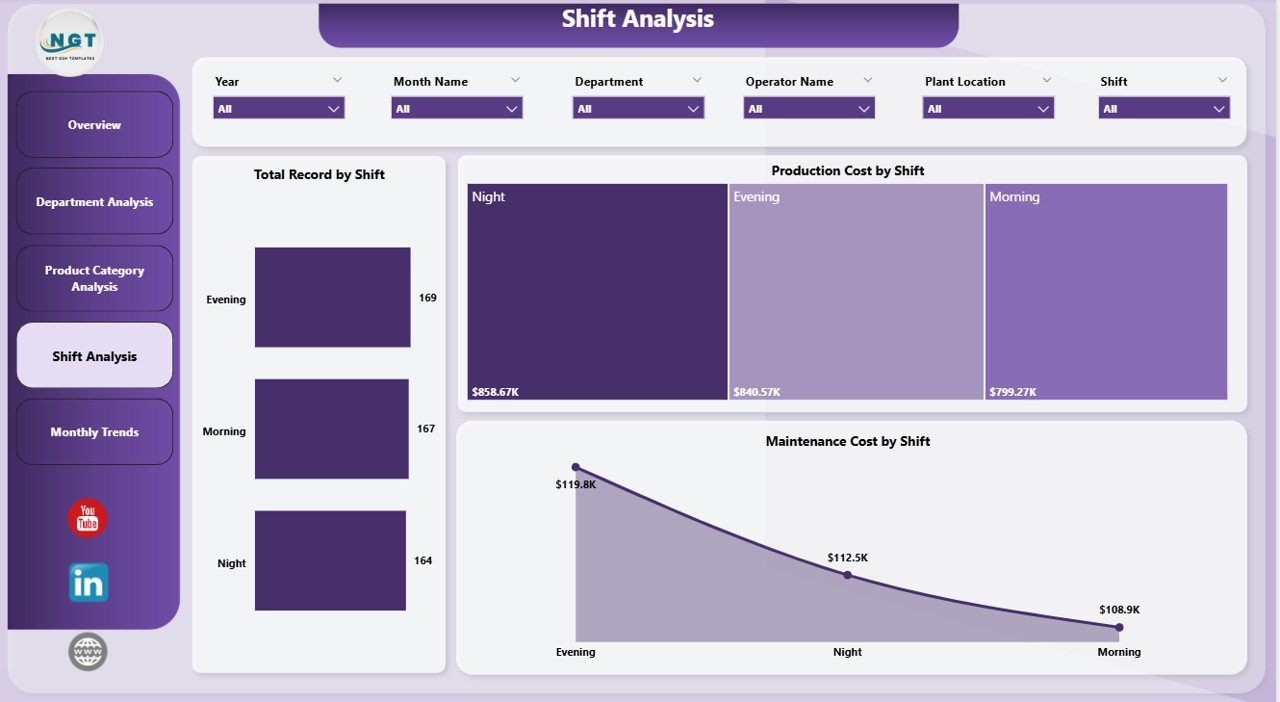
👷 Shift-Based Production Monitoring – Evaluate productivity differences between operational shifts.
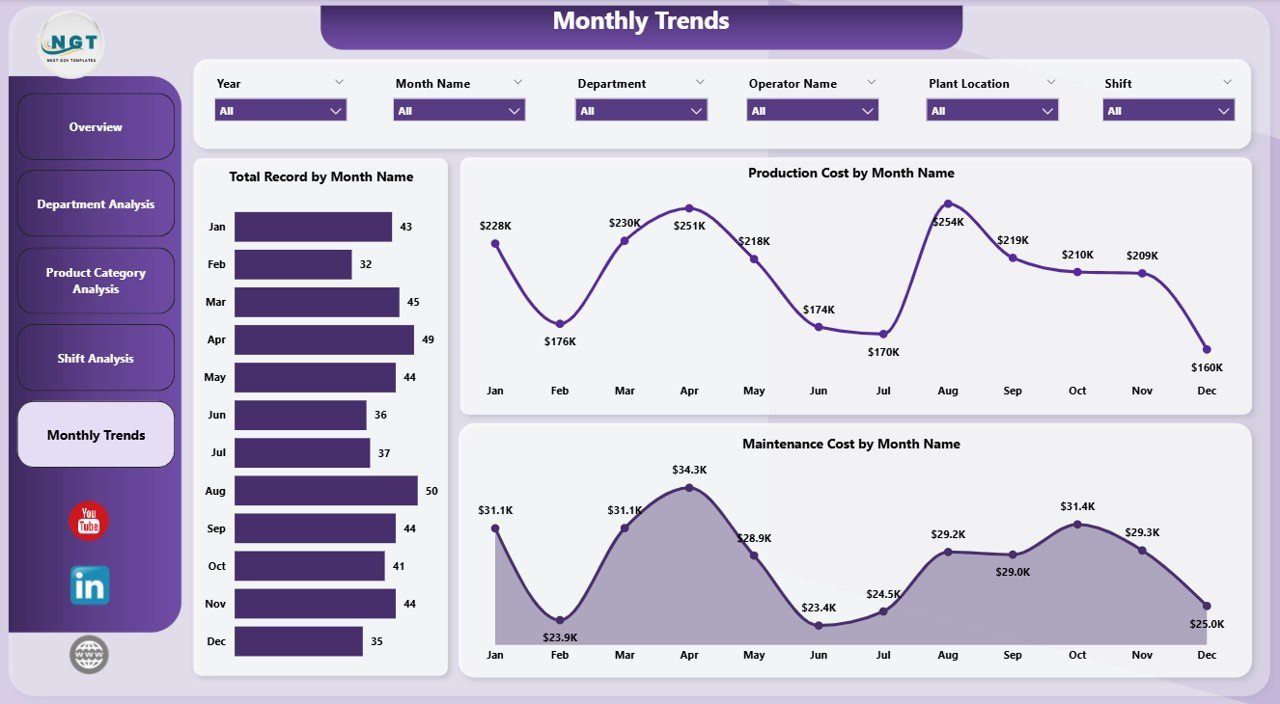
📅 Monthly Production Trend Analysis – Track manufacturing activity, maintenance costs, and production expenses over time.
🔎 Interactive Filters and Drill-Down Analysis – Explore insights dynamically using slicers for plants, departments, shifts, or product categories.
Because of these features, manufacturing managers gain complete operational visibility into additive manufacturing processes.
📦 What’s Inside the Additive Manufacturing Dashboard in Power BI
This dashboard is designed using Power BI for visualization and Excel as the data source.
Inside the dashboard you will find five analytical pages:
✅ Overview Page – High-level manufacturing performance monitoring
✅ Department Analysis Page – Department-level production insights
✅ Product Category Analysis Page – Product-specific manufacturing analysis
✅ Shift Analysis Page – Operational shift performance comparison
✅ Month Analysis Page – Monthly production and cost trends
The dashboard tracks important manufacturing KPIs such as:
Production Cost
Maintenance Cost
Pass Quality %
Average Build Time
Production Records
Department Productivity
Shift Performance
Material Usage
Because the dashboard organizes these metrics visually, manufacturing teams can quickly identify operational bottlenecks and optimize production performance.
⚙️ How to Use the Additive Manufacturing Dashboard in Power BI
Using this dashboard is straightforward and efficient.
1️⃣ Enter production data into the Excel data source file.
2️⃣ Update manufacturing records such as production cost, maintenance cost, product category, and department.
3️⃣ Refresh the Power BI dashboard to update all visual analytics.
4️⃣ Use slicers to filter insights by plant, department, product category, shift, or month.
5️⃣ Analyze charts and KPI cards to evaluate manufacturing performance.
Within seconds, managers can understand production efficiency, identify operational issues, and implement improvement strategies.
Because Power BI updates visuals automatically after data refresh, organizations can monitor manufacturing performance continuously.
👥 Who Can Benefit from This Additive Manufacturing Dashboard
This dashboard is designed for professionals responsible for managing manufacturing operations and production analytics.
It is particularly useful for:
🏭 Manufacturing Managers
⚙️ Production Engineers
📊 Manufacturing Analysts
🛠 Maintenance Teams
📈 Operations Managers
🏢 Plant Supervisors
Because the dashboard combines operational, financial, and quality metrics, multiple teams can use it simultaneously.
💡 Why Manufacturers Use Additive Manufacturing Dashboards
✔ Centralized monitoring of manufacturing operations
✔ Faster identification of production inefficiencies
✔ Improved machine maintenance tracking
✔ Better production cost control across plants and departments
✔ Data-driven manufacturing decision-making
✔ Clear performance comparison across shifts and departments
✔ Improved product quality monitoring
✔ Enhanced operational transparency
Instead of relying on manual reports, manufacturing organizations can analyze operations using interactive visual analytics.
This dashboard converts manufacturing data into actionable insights that help companies improve productivity, reduce costs, and enhance production quality.
### Click here to read the Detailed blog post
Visit our YouTube channel to learn step-by-step video tutorials
Youtube.com/@PKAnExcelExpert