Academic publishing involves multiple processes—manuscript submissions, peer reviews, acceptance decisions, publication types, access models, costs, and revenue tracking. However, when this information is spread across multiple spreadsheets and reports, institutions and publishers struggle to get a clear picture of performance. As a result, decision-making becomes slow and inefficient.
That is exactly where the Academic Publishing Dashboard in Excel becomes a powerful solution.
This ready-to-use Excel dashboard converts raw academic publishing data into clear, interactive, and decision-ready insights. Instead of manually analyzing scattered files, you can track submissions, acceptance rates, costs, revenue, and profit margins from one centralized dashboard. Because it is built entirely in Microsoft Excel, it remains simple, flexible, and cost-effective for institutions of all sizes.
With dynamic slicers, KPI cards, and structured charts, stakeholders can instantly understand publishing performance, identify trends, and improve editorial and financial strategies.
🚀 Key Features of the Academic Publishing Dashboard in Excel
This dashboard is designed specifically for academic publishers, universities, and research organizations.
📥 Submission & Acceptance Tracking
Monitor total submissions and accepted reviews with clarity.
💰 Cost, Revenue & Profit Analysis
Track publishing costs, revenue generation, and profit margins.
📊 Publisher, Journal & Publication Insights
Analyze performance across publishers, journal types, and publication formats.
🔍 Access Model Comparison
Compare costs between open access and subscription-based publishing.
📅 Monthly Trend Analysis
Identify seasonal trends and long-term performance patterns.
🎛 Interactive Slicers & Charts
Filter data instantly by region, publisher, journal type, access type, or month.
📦 What’s Inside the Academic Publishing Dashboard
The dashboard contains five professionally structured analytical pages, each answering a critical publishing question.
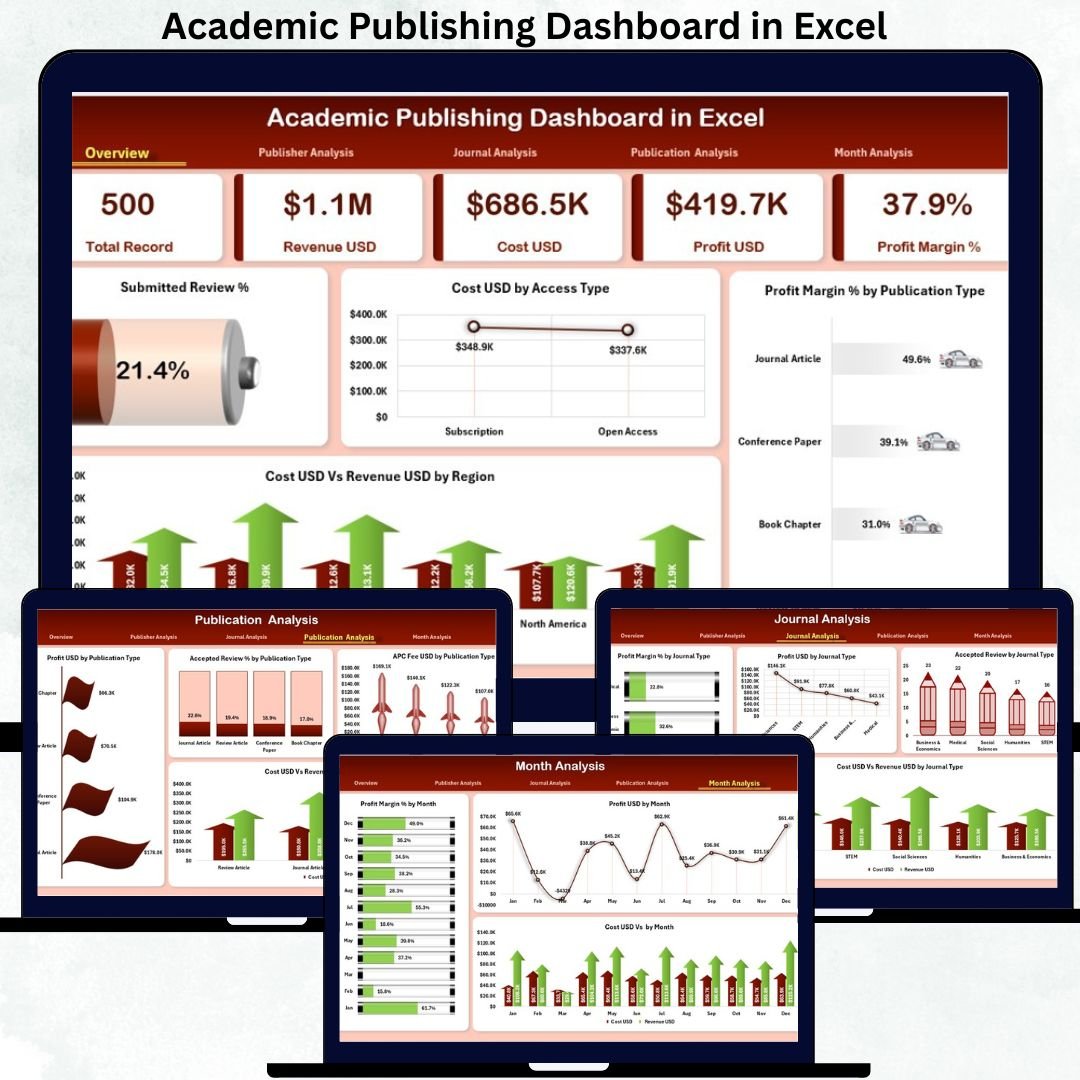
📊 Overview Page – Complete Publishing Snapshot
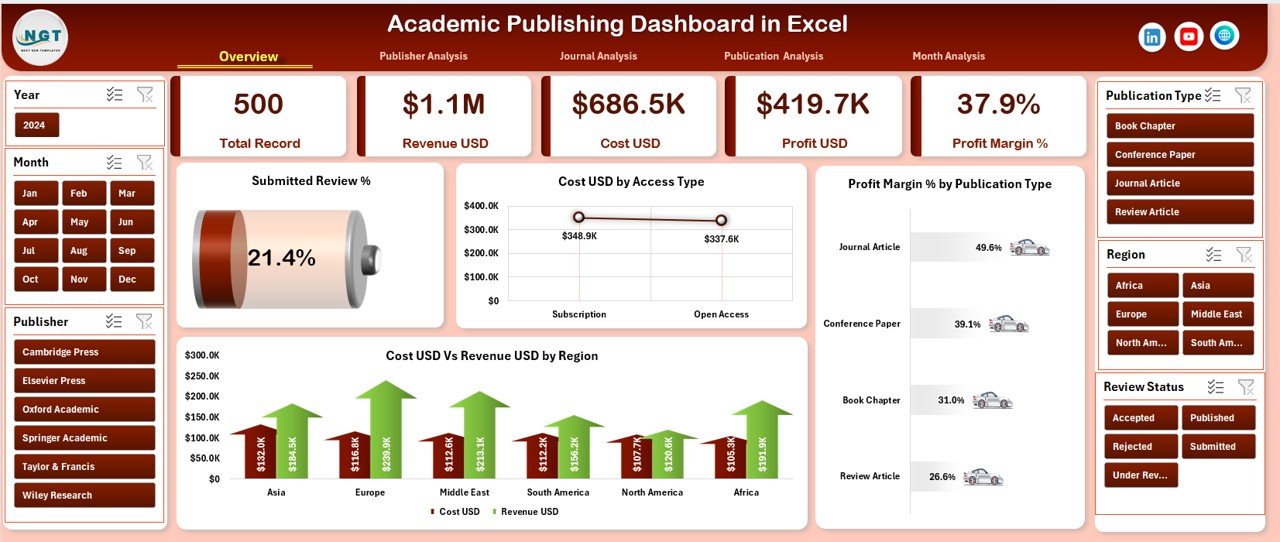
This is the main landing page of the dashboard.
KPI Cards Included
-
Total Submissions
-
Accepted Reviews
-
Total Cost
-
Total Revenue
-
Overall Profit / Margin
Key Charts
-
Submitted Review %
-
Cost USD by Access Type
-
Profit Margin % by Publication Type
-
Cost USD vs Revenue USD by Region
This page gives leadership an instant overview of editorial efficiency and financial health.
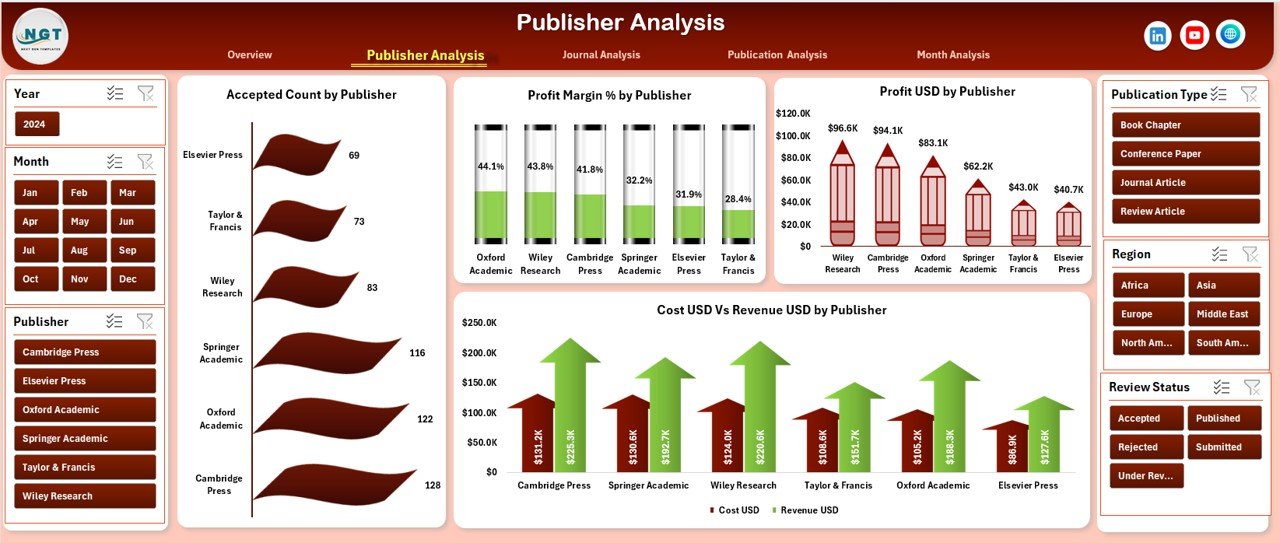
🏢 Publisher Analysis – Publisher-Wise Performance
This page compares performance across different publishers.
Charts Included
-
Accepted Count by Publisher
-
Profit Margin % by Publisher
-
Profit USD by Publisher
-
Cost USD vs Revenue USD by Publisher
It helps identify top-performing publishers and areas needing improvement.
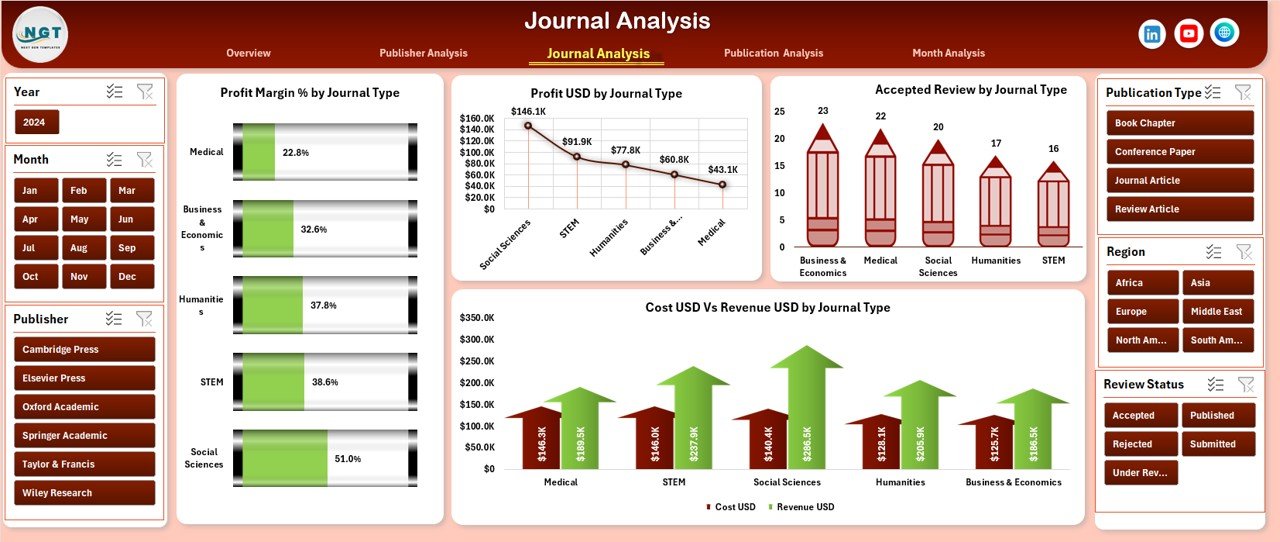
📚 Journal Analysis – Journal Type Comparison
The Journal Analysis page focuses on journal categories.
Charts Included
-
Profit Margin % by Journal Type
-
Profit USD by Journal Type
-
Accepted Review by Journal Type
-
Cost USD vs Revenue USD by Journal Type
This analysis supports better journal portfolio planning and pricing decisions.
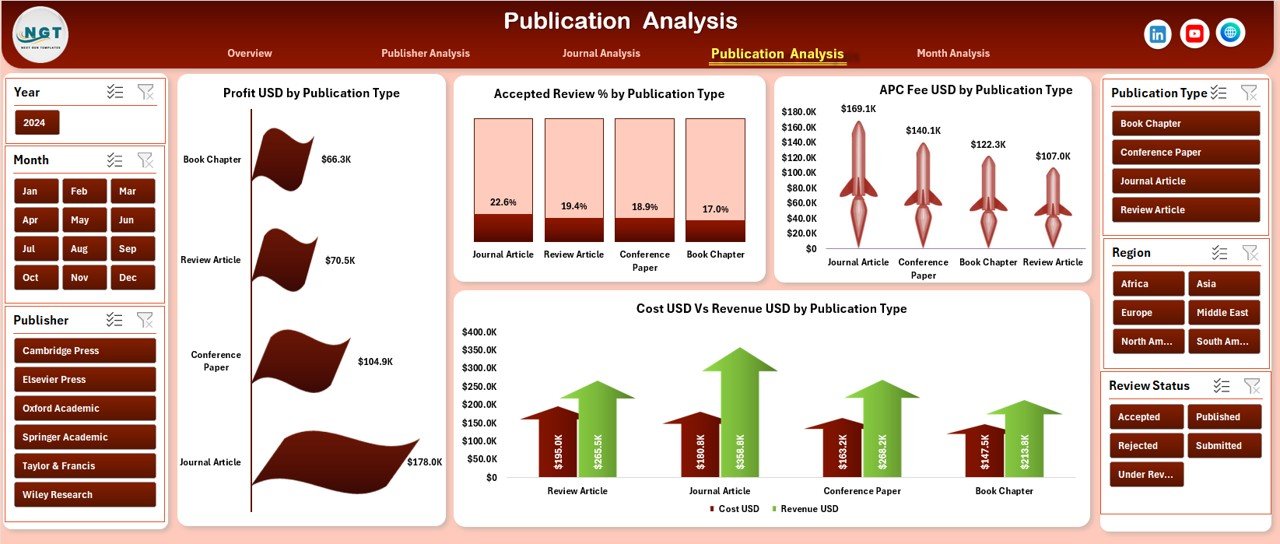
📝 Publication Analysis – Format-Wise Insights
This page evaluates publication formats such as articles, journals, books, and proceedings.
Charts Included
-
Profit USD by Publication Type
-
Accepted Review % by Publication Type
-
APC Fee USD by Publication Type
-
Cost USD vs Revenue USD by Publication Type
It helps organizations understand which formats generate the highest returns.
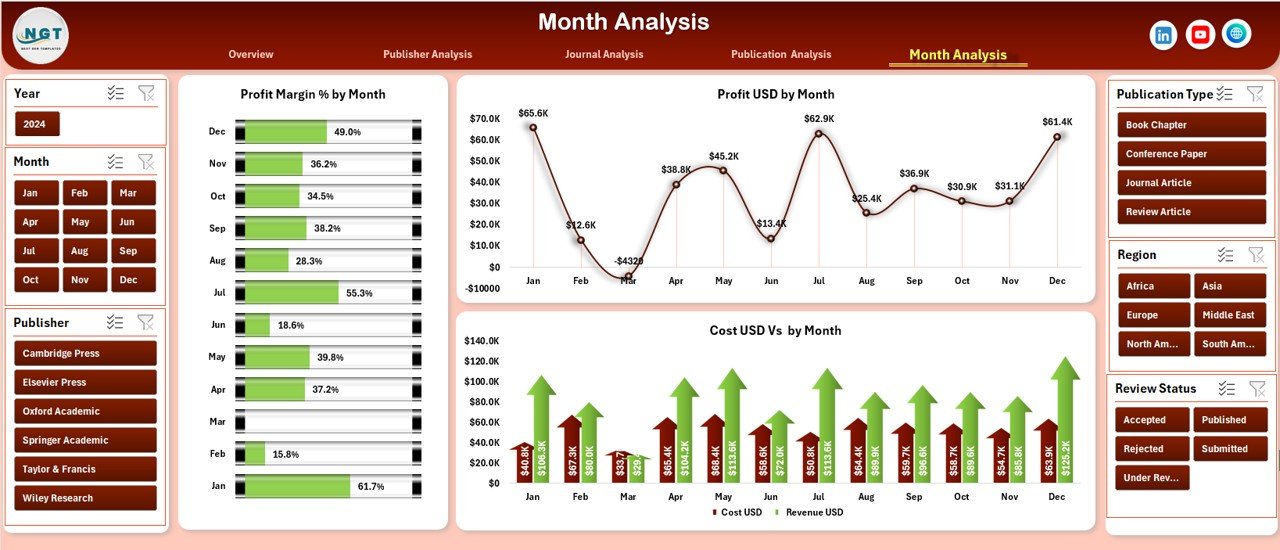
📆 Month Analysis – Time-Based Trends
The Month Analysis page tracks publishing performance over time.
Charts Included
-
Profit Margin % by Month
-
Profit USD by Month
-
Cost USD vs Revenue USD by Month
This page supports forecasting, budgeting, and long-term planning.
⚙️ How to Use the Academic Publishing Dashboard
1️⃣ Enter publishing data into the structured Data Sheet
2️⃣ Refresh pivot tables (if required)
3️⃣ Use slicers to filter by publisher, journal type, access model, or time
4️⃣ Review KPIs and charts instantly
5️⃣ Identify trends, gaps, and opportunities
6️⃣ Make faster editorial and financial decisions
No coding. No complex setup.
👥 Who Can Benefit from This Dashboard?
This dashboard is ideal for:
-
🎓 Universities & Research Institutions
-
🏢 Academic Publishers
-
📚 Editorial Boards
-
💰 Finance & Revenue Teams
-
📊 Research Administrators
-
🧠 Scholarly Publishing Consultants
Anyone managing academic publishing data will benefit immediately.
### Click here to read the Detailed blog post
Visit our YouTube channel to learn step-by-step video tutorials
👉 Youtube.com/@PKAnExcelExpert


Reviews
There are no reviews yet.