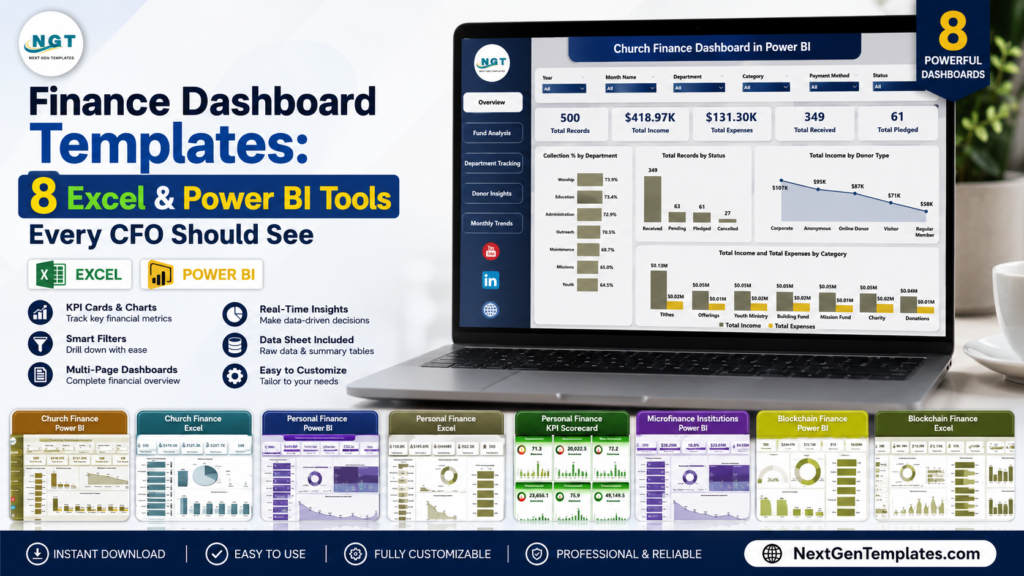
A finance dashboard Excel file is often the fastest way for a CFO, controller, nonprofit treasurer, or finance manager to turn messy transaction exports into board-ready reporting. In the U.S. market, many finance teams still have to defend margins, cash reserves, working capital, and budget variance with spreadsheets assembled under deadline pressure. A full SaaS reporting stack can be useful, but it is not always the right first move: Microsoft lists Power BI Pro at $14.00 per user/month, paid yearly, while finance reporting platforms such as Fathom show plans starting at $65/month. The templates in this roundup start at $13.99 to $17.99, making them practical when you need a CFO dashboard template quickly without a long subscription decision. Below, we compare 8 finance dashboard Excel and Power BI tools from NextGenTemplates, with special attention to P&L style reporting, balance sheet thinking, finance summaries, KPI monitoring, working capital signals, and cash flow visibility.
Finance Dashboard Excel and Power BI Template Comparison
| Template | Format | Best For | Price |
|---|---|---|---|
| Church Finance Dashboard in Power BI | Power BI | Church boards, treasurers, donation and fund analysis | $17.99 |
| Church Finance Dashboard in Excel | Excel | Excel-based ministry finance, expense tracking, fund reports | $17.99 |
| Personal Finance Dashboard in Power BI | Power BI | Cash flow, savings, spending, executive personal finance | $17.99 |
| Personal Finance Dashboard in Excel | Excel | Budget review, income tracking, household or freelancer finance | $17.99 |
| Blockchain Finance Dashboard in Power BI | Power BI | Crypto transaction analytics, wallet monitoring, risk review | $17.99 |
| Blockchain Finance Dashboard in Excel | Excel | Spreadsheet-based blockchain finance analysis and risk checks | $13.99 |
| Personal Finance KPI Scorecard in Excel | Excel | KPI targets, trend analysis, actual vs target finance scorecards | $14.99 |
| Microfinance Institutions Dashboard in Power BI | Power BI | Loan portfolios, branch performance, repayment and outstanding balance | $17.99 |
Why CFO-Level Finance Dashboards Matter
- Recurring BI cost adds up: Power BI Pro is listed at $14.00 per user/month, paid yearly. A five-user finance team is looking at $840 per year before adding any specialist reporting software.
- Premium BI can double the user-license baseline: Microsoft lists Power BI Premium Per User at $24.00 per user/month, paid yearly, so a five-user team reaches $1,440 per year.
- Finance reporting SaaS is a bigger jump: Fathom displays a Starter plan at $65/month for one company and a Silver plan at $390/month for 10 companies. That can be worth it for advisory firms, but it is not always needed for a simple reporting layer.
- Refresh and storage limits shape reporting design: Microsoft lists Power BI Pro dataset refresh at 8 per day and Premium Per User at 48 per day, with storage moving from 10 GB per Pro license to much larger Premium/Fabric limits. CFO dashboards should match the real reporting cadence.
- Template pricing is a low-friction pilot: The 8 NextGenTemplates finance dashboard tools in this post run from $13.99 to $17.99, making them useful for testing a finance KPI dashboard before committing to a larger analytics stack.
The CFO-level value is not just prettier charts. A good finance dashboard forces the team to define which numbers matter: revenue and expense categories for P&L review, assets and liabilities for balance sheet thinking, receivables and repayments for working capital, and actual-vs-target KPIs for accountability. That is why this roundup mixes Excel and Power BI formats instead of treating one platform as universally better.
8 Finance Dashboard Templates Worth Reviewing
1. Church Finance Dashboard in Power BI
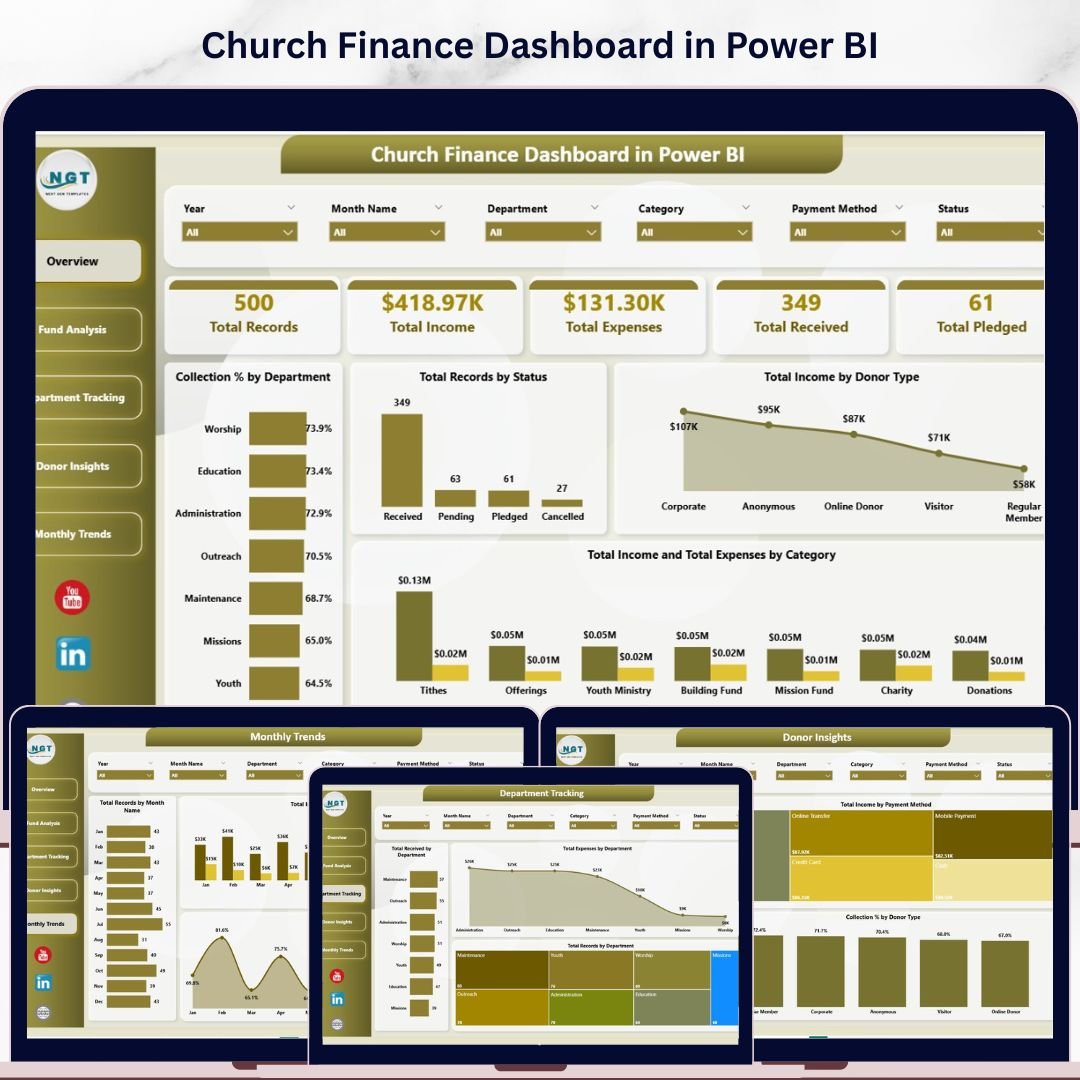
The Church Finance Dashboard in Power BI is the strongest fit when a church, ministry, or faith-based nonprofit wants finance committee reporting with interactive slicers. For CFO-level review, its value is in separating income, expenses, received funds, pledged funds, donors, departments, and monthly trends without forcing every board member to open a spreadsheet.
Screenshot preview: The product image shows a polished Power BI finance summary with KPI cards and chart panels. Inside the file, the pages cover Overview, Fund Analysis, Department Tracking, Donor Insights, and Monthly Trends. The Overview page focuses on Total Records, Total Income, Total Expenses, Total Received, and Total Pledged, which makes it practical for monthly board packets and restricted-fund discussions.
- Use it to brief a church finance committee before budget approval.
- Use department tracking to compare ministry expenses by program owner.
- Use donor insights to study giving mix and payment methods.
- Use monthly trends to plan cash reserves and seasonal giving expectations.
Price: $17.99. View the Church Finance Dashboard in Power BI.
2. Church Finance Dashboard in Excel
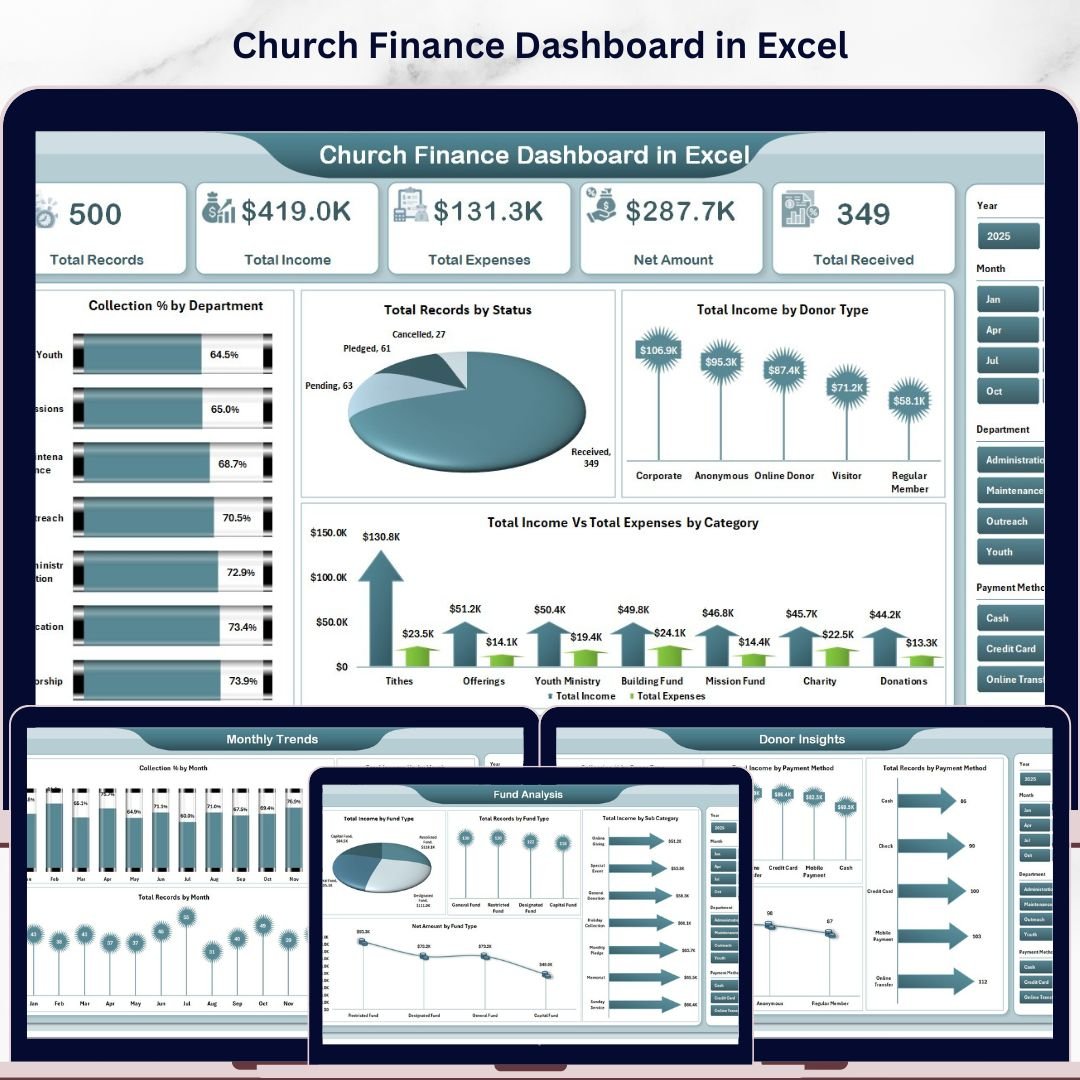
The Church Finance Dashboard in Excel is the more familiar option for treasurers and finance managers who already work in Microsoft Excel. It is especially useful where the finance workflow depends on monthly exports, manual review, and a final report that can be emailed, printed, or attached to board notes.
Screenshot preview: The featured image shows the Excel dashboard design, while the full product includes 5 dashboard pages plus a Data sheet and Support sheet. The dashboard tracks Total Records, Total Income, Total Expenses, Net Amount, and Total Received, with fund analysis, department tracking, donor insights, and monthly trend views. The pivot-powered backend lets the user update the data sheet and refresh the dashboard instead of rebuilding charts every month.
- Use it for monthly P&L-style income and expense summaries.
- Use fund analysis to monitor restricted, designated, or campaign funds.
- Use department reporting to discuss budget variance with ministry leaders.
- Use the data sheet as a structured finance record before audit review.
Price: $17.99. Explore the Church Finance Dashboard in Excel.
3. Personal Finance Dashboard in Power BI
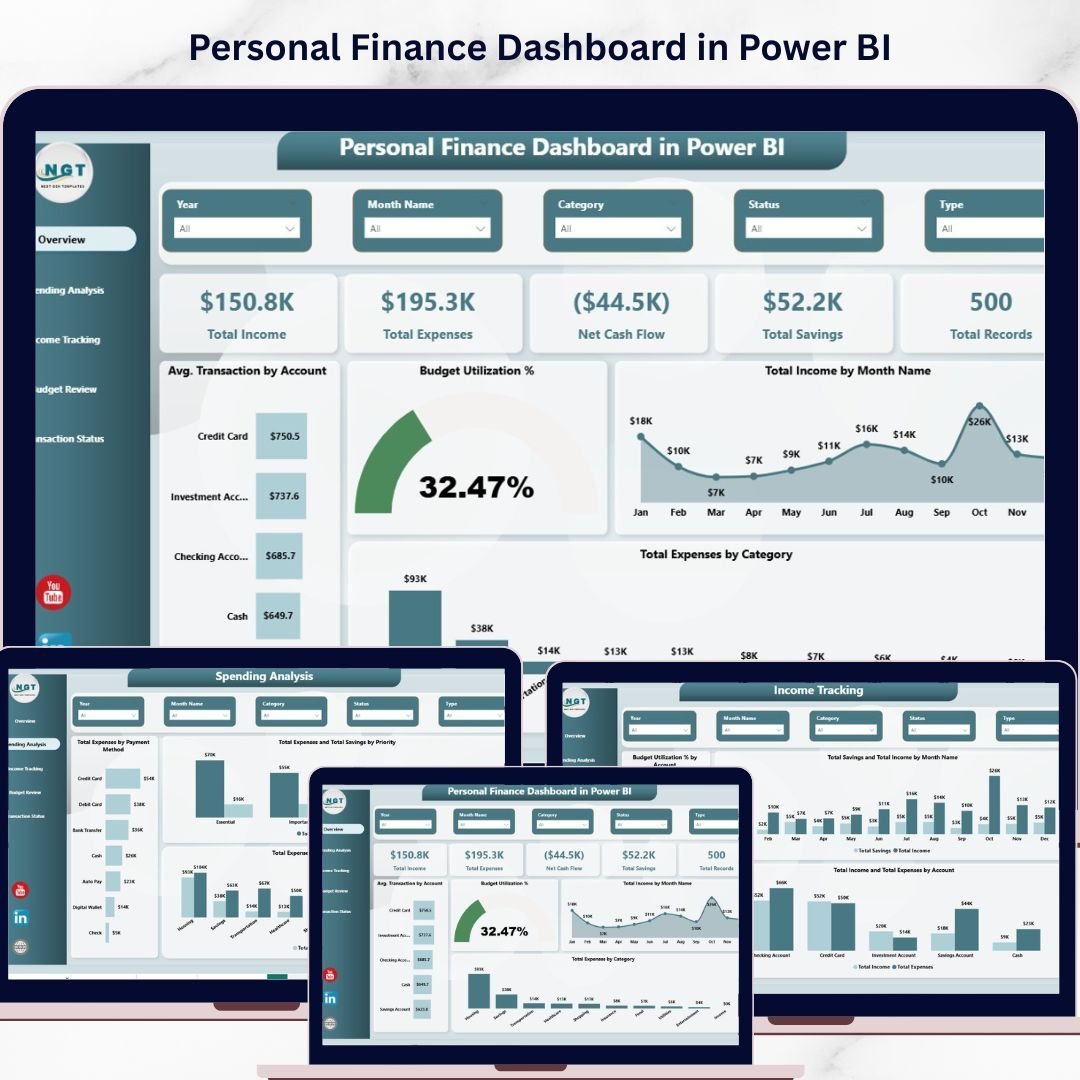
The Personal Finance Dashboard in Power BI is not a corporate general ledger system, but it can be very useful for executives, owners, freelancers, and financial coaches who want a modern finance summary. Think of it as a personal CFO view: income, expenses, savings, budget utilization, and transaction status in one interactive model.
Screenshot preview: The product screenshot presents a clean Power BI dashboard layout. The template includes Overview, Spending Analysis, Income Tracking, Budget Review, and Transaction Status pages. KPI cards track Total Income, Total Expenses, Net Cash Flow, Total Savings, and Total Records. That makes it easy to explain cash runway, spending concentration, and budget discipline without asking someone to read line-by-line transactions.
- Use it for an executive household finance review.
- Use it to analyze freelancer income and business-related spending.
- Use it as a client-facing model for personal finance coaching.
- Use it to learn Power BI dashboard design with realistic finance data.
Price: $17.99. Review the Personal Finance Dashboard in Power BI.
4. Personal Finance Dashboard in Excel
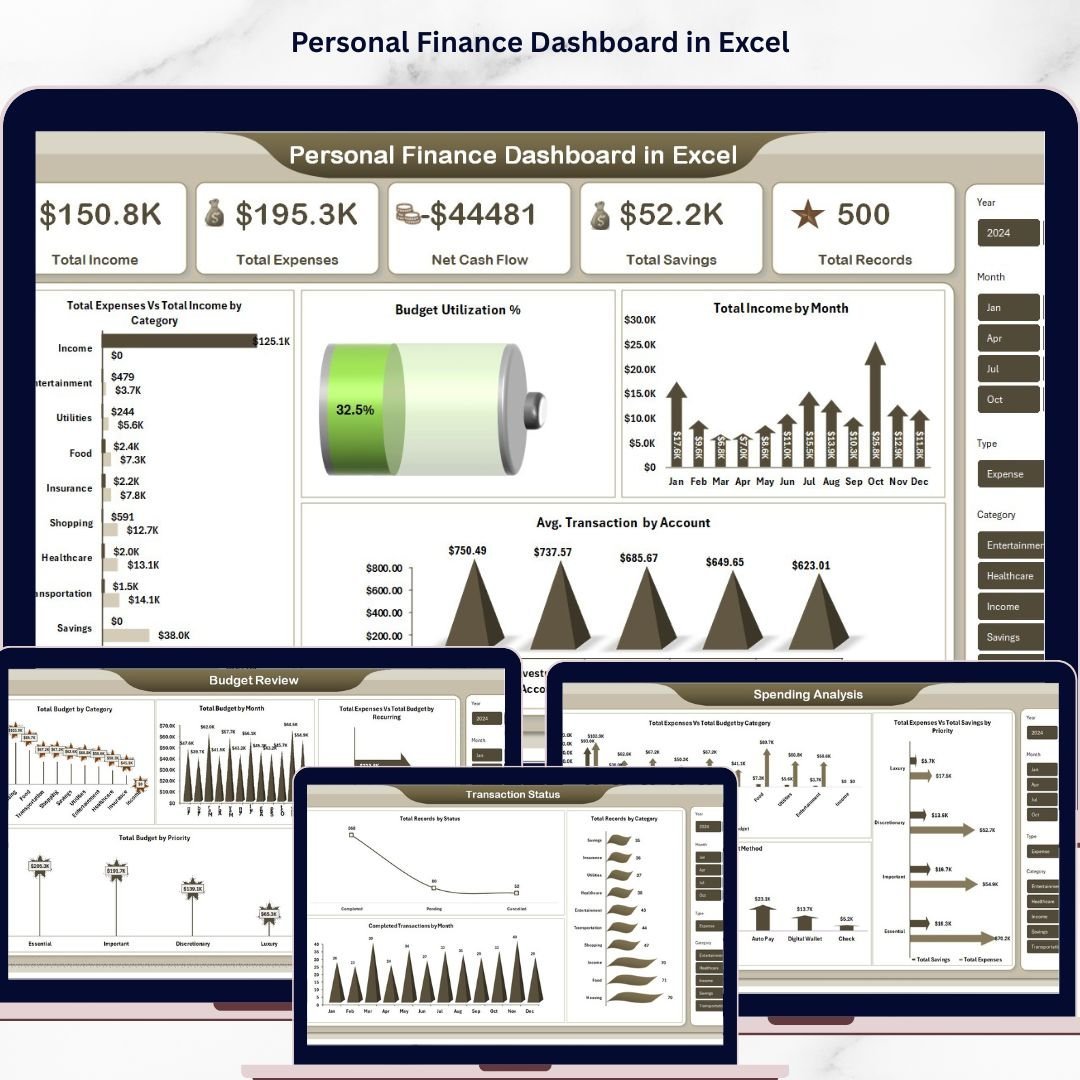
The Personal Finance Dashboard in Excel is the practical choice when the buyer wants a finance dashboard Excel workbook instead of a Power BI file. It is suitable for household budgeting, personal cash flow, self-employed income tracking, and any scenario where data entry and refresh should stay inside Excel.
Screenshot preview: The featured image shows the dashboard cover, and the template includes 5 dashboard pages plus Data and Support sheets. The key views cover Overview, Spending Analysis, Income Tracking, Budget Review, and Transaction Status. The KPI cards show Total Income, Total Expenses, Net Cash Flow, Total Savings, and Total Records, while supporting charts compare budget vs actual expenses, savings by priority, payment methods, account activity, and monthly trends.
- Use it to monitor monthly cash flow and savings progress.
- Use budget review charts to spot over-budget categories.
- Use transaction status tracking to clean up pending or missing records.
- Use account-level views as a lightweight balance sheet habit builder.
Price: $17.99. See the Personal Finance Dashboard in Excel.
5. Blockchain Finance Dashboard in Power BI
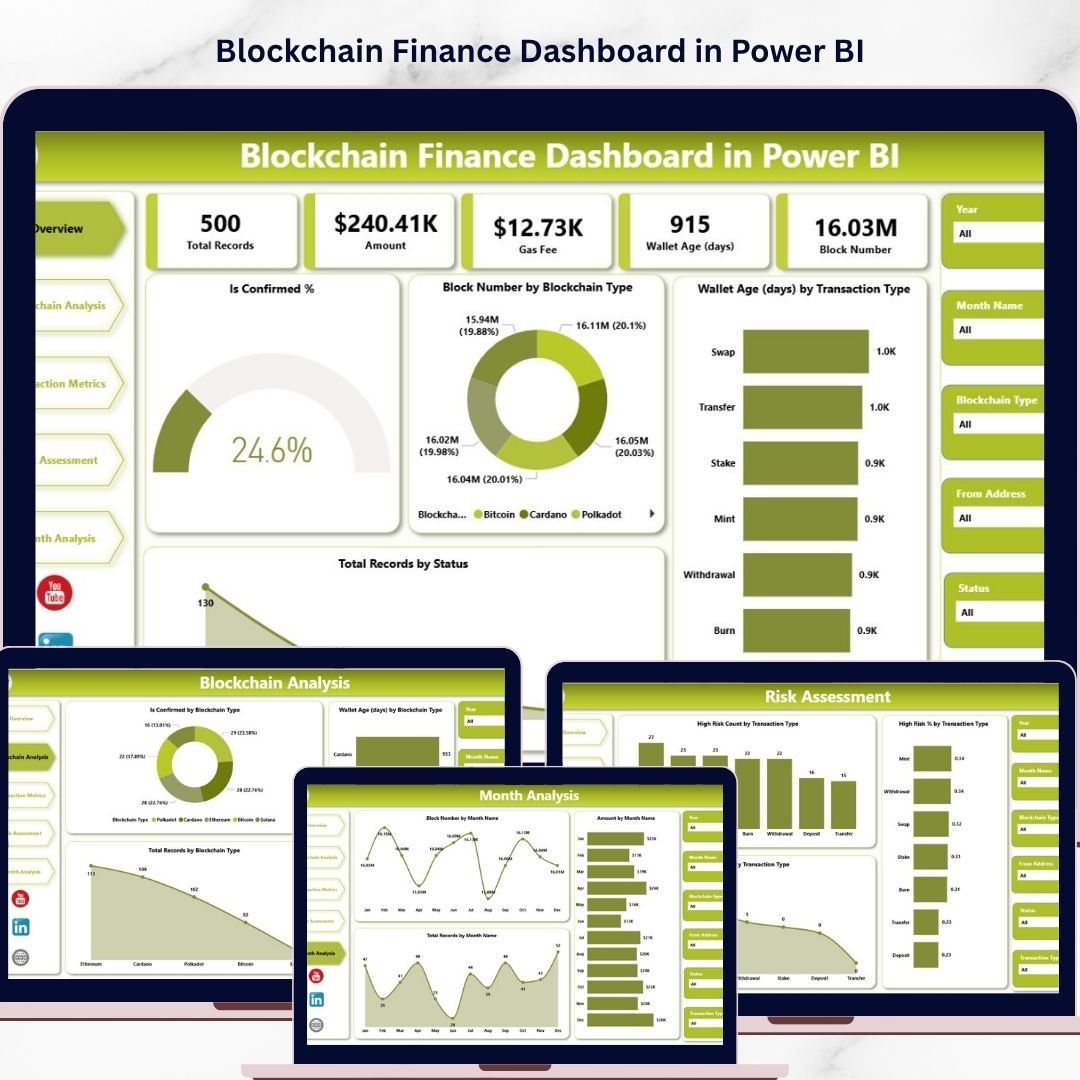
The Blockchain Finance Dashboard in Power BI is designed for finance teams working with crypto transactions, wallets, gas fees, blockchain networks, and risk indicators. For CFO-level users, the appeal is visibility: it turns complex blockchain activity into structured pages that can support treasury review, transaction monitoring, and risk conversations.
Screenshot preview: The featured image introduces the Power BI dashboard, while the template pages include Overview, Blockchain Analysis, Transaction Metrics, Risk Assessment, and Month Analysis. The product description highlights KPI monitoring, transaction values, gas fees, wallet behavior, blockchain type, transaction type, status filters, and high-risk transaction detection.
- Use it to review blockchain transaction activity by network.
- Use transaction metrics to analyze value, volume, and gas fee movement.
- Use risk assessment views to flag transactions that need investigation.
- Use month analysis to summarize trends for finance and compliance meetings.
Price: $17.99. Open the Blockchain Finance Dashboard in Power BI.
6. Blockchain Finance Dashboard in Excel
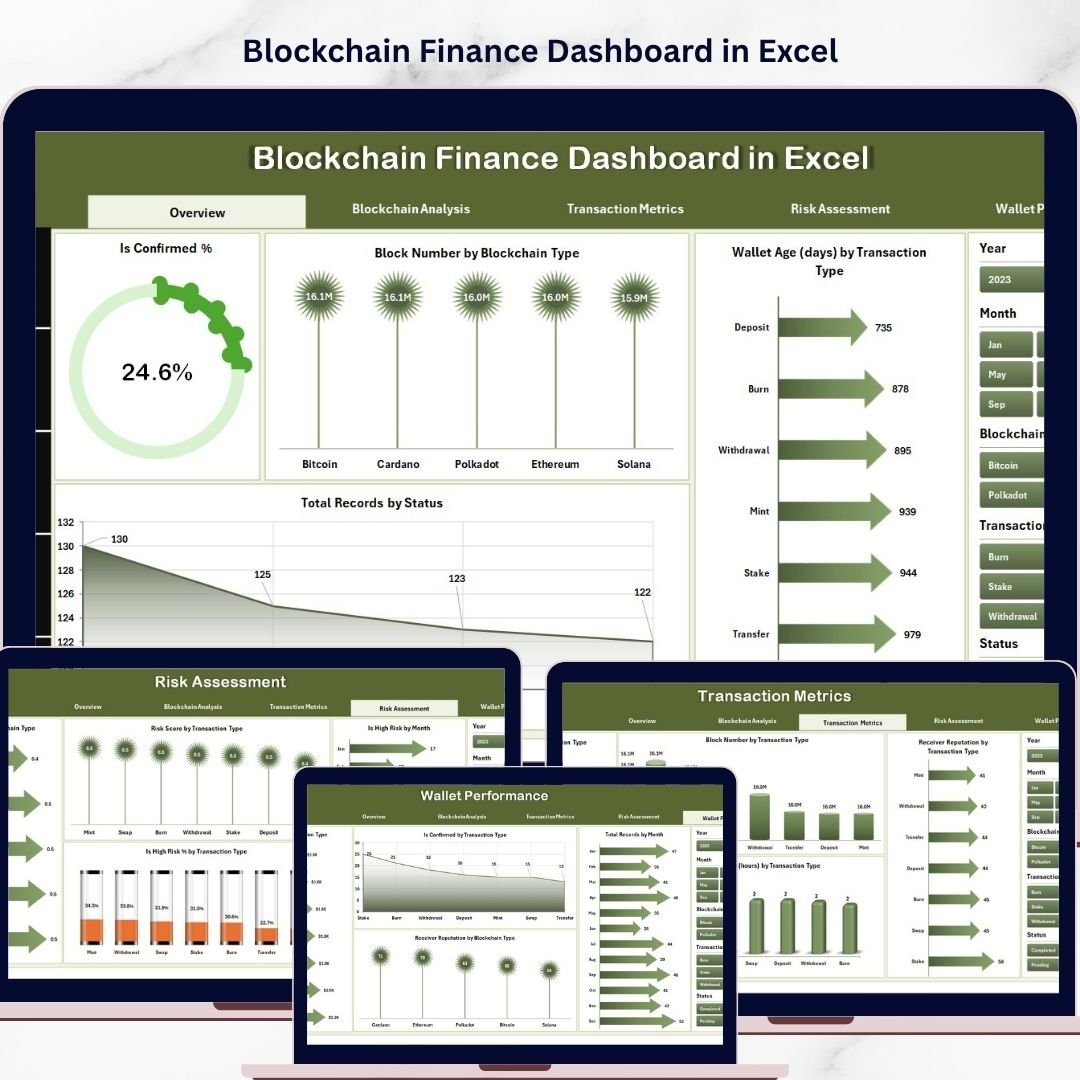
The Blockchain Finance Dashboard in Excel is a lower-cost option for analysts who need blockchain finance reporting but want to stay in Excel. It works well when the finance team is still shaping its source data, reconciling transaction exports, or building a repeatable review pack before moving to a live BI environment.
Screenshot preview: The featured image shows the Excel product cover. Inside, the dashboard includes 5 analytical pages with blockchain analysis, transaction metrics, risk assessment, wallet performance, Data sheet, and Support sheet. That structure is useful for finance operations because it keeps the raw data, calculations, and visuals separated instead of mixing everything on one crowded worksheet.
- Use it to reconcile exported blockchain transaction records.
- Use wallet performance views to compare activity across wallet groups.
- Use risk insights to prioritize transactions for follow-up.
- Use the Data sheet as a controlled input layer for recurring reviews.
Price: $13.99. Check the Blockchain Finance Dashboard in Excel.
7. Personal Finance KPI Scorecard in Excel

The Personal Finance KPI Scorecard in Excel is the closest match in this roundup for buyers searching for a finance KPI dashboard. Rather than focusing only on charts, it emphasizes actual vs target tracking, MTD and YTD views, KPI definitions, and trend analysis. That makes it useful for anyone who wants disciplined financial performance management.
Screenshot preview: The featured image shows the scorecard product, and the full workbook contains Scorecard, KPI Trend, Input Data, and KPI Definition sheets. The product tracks KPIs such as savings rate, expense ratio, investment growth, debt ratio, and net worth growth. The KPI Trend sheet lets users pick a metric and review actual, target, and prior-year movement.
- Use it for monthly personal finance performance reviews.
- Use actual vs target logic to measure budget discipline.
- Use KPI definitions to keep financial metrics consistent.
- Use trend analysis for coaching, family finance, or self-employed planning.
Price: $14.99. View the Personal Finance KPI Scorecard in Excel.
8. Microfinance Institutions Dashboard in Power BI
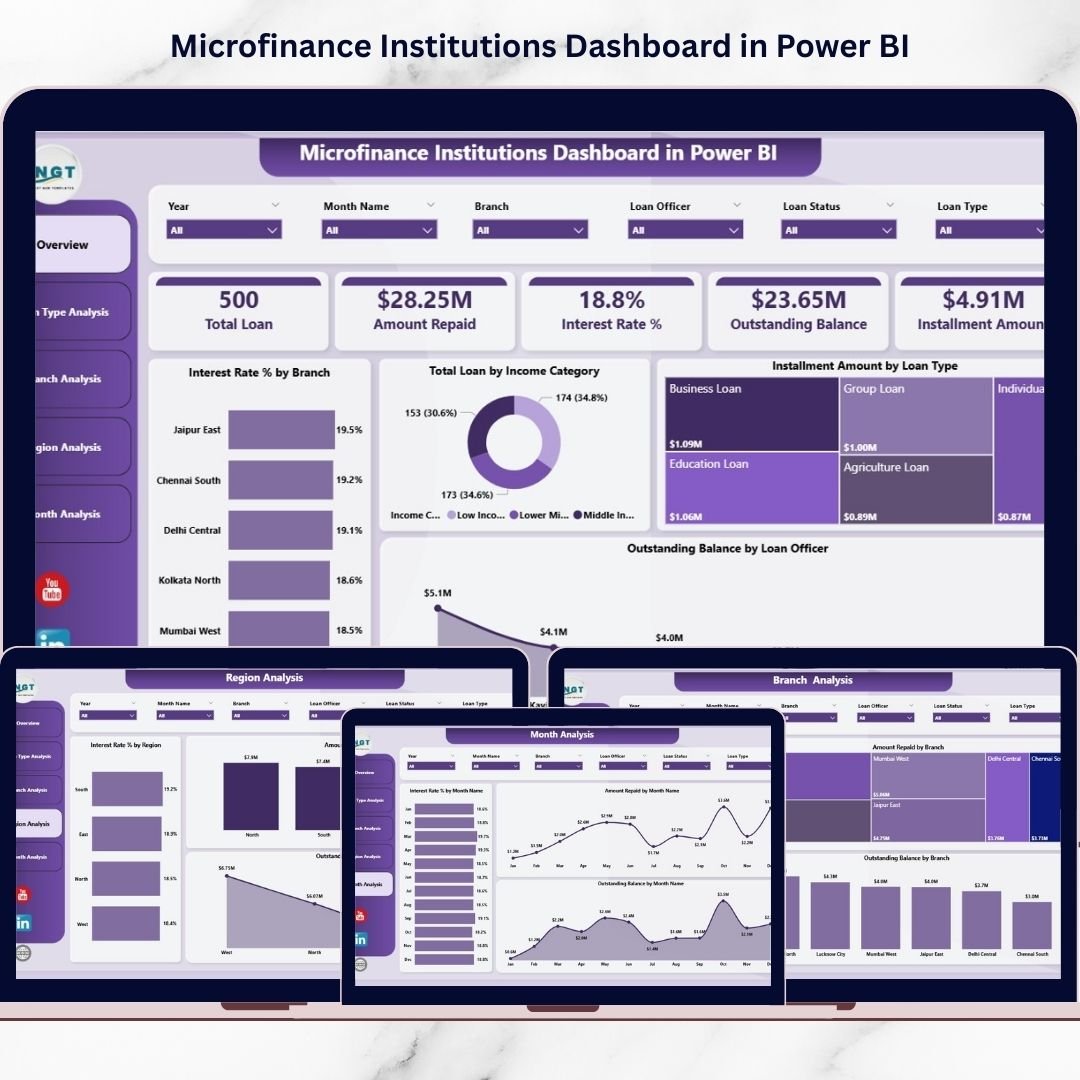
The Microfinance Institutions Dashboard in Power BI is the most CFO-like operational finance template in this list because it focuses on loans, repayments, interest rates, branches, regions, officers, and outstanding balances. If your finance team thinks in terms of portfolio health and working capital pressure, this dashboard deserves a close look.
Screenshot preview: The product image shows a Power BI dashboard cover, while the file includes 5 analytical pages: Overview, Loan Type Analysis, Branch Analysis, Region Analysis, and Month Analysis. The built-in visuals analyze interest rate percentage, amount repaid, total loan, installment amount, outstanding balance, and branch-level performance.
- Use it to monitor loan portfolio performance at the leadership level.
- Use outstanding balance views as a working capital risk signal.
- Use branch analysis to compare accountability across operating units.
- Use monthly repayment trends to brief executives and stakeholders.
Price: $17.99. Review the Microfinance Institutions Dashboard in Power BI.
How To Choose The Right CFO Dashboard Template
Start with the reporting decision, not the software. If the CFO or finance manager needs a monthly P&L style summary, choose a dashboard that clearly separates income, expenses, categories, departments, and monthly movement. The Church Finance Dashboard in Excel and Church Finance Dashboard in Power BI are the best examples here because they center on income, expenses, funds, departments, donors, and trends.
If the reporting question is closer to balance sheet tracking, look for assets, liabilities, net worth, debt, savings, outstanding balance, or portfolio exposure. The Personal Finance KPI Scorecard in Excel is useful for net worth, debt ratio, and savings rate, while the Microfinance Institutions Dashboard in Power BI is stronger for outstanding balances, repayment movement, and portfolio risk.
If working capital is the priority, choose the template that makes cash movement visible. Churches can use the church finance dashboards to compare total income, expenses, received amounts, and monthly patterns. Microfinance teams should use the loan and repayment views. Individuals and freelancers can use the Personal Finance Dashboard in Excel or Personal Finance Dashboard in Power BI to manage cash flow and savings behavior.
Choose Excel when the finance owner wants a file-based workflow, easy data entry, and a refreshable workbook. Choose Power BI when leadership needs slicers, interactive pages, and a more presentation-ready analytics layer. To browse more related tools, see the Finance Dashboard Templates, Excel Dashboard Templates, and Power BI Dashboard Templates categories on NextGenTemplates.
Frequently Asked Questions
What is the best finance dashboard Excel template for CFO reporting?
The best finance dashboard Excel template depends on the reporting job. For income, expenses, funds, and monthly finance summaries, the Church Finance Dashboard in Excel is the strongest business-style option. For KPI discipline, the Personal Finance KPI Scorecard in Excel is better because it tracks actual vs target performance.
Should I choose Excel or Power BI for a finance dashboard?
Choose Excel if the finance team owns spreadsheet exports, wants simple data entry, and needs a workbook that can be refreshed manually. Choose Power BI if the team wants interactive slicers, multi-page visuals, and stakeholder-friendly dashboards for review meetings.
Can these templates support P&L and balance sheet reporting?
They are not accounting systems, but they can support P&L style summaries and balance sheet thinking when mapped to the right source data. Income and expense dashboards support P&L review, while KPI, net worth, outstanding balance, debt, and savings views support balance sheet-style analysis.
What is a finance KPI dashboard?
A finance KPI dashboard tracks financial performance indicators such as income growth, expense ratio, savings rate, budget utilization, net cash flow, repayment performance, outstanding balance, and actual vs target results. The goal is to help leaders see performance quickly without reading raw transactions.
Which template is best for working capital monitoring?
For organizational working capital signals, the Microfinance Institutions Dashboard in Power BI is the best fit because it tracks loan amounts, repayments, and outstanding balances. For smaller teams, the church and personal finance dashboards can also help monitor cash inflow, outflow, and monthly trends.
Are these templates a replacement for accounting software?
No. These templates are reporting and analysis layers. You should still use accounting software, bank records, ERP exports, or a bookkeeping process as the source of truth. The dashboard turns that data into faster finance summaries and visual management reports.
How much do these dashboard templates cost compared with SaaS tools?
The templates in this roundup range from $13.99 to $17.99. By comparison, Microsoft lists Power BI Pro at $14.00 per user/month, paid yearly, and finance reporting SaaS platforms can start at a higher monthly price. Templates are useful when you want a low-cost pilot or a file-based reporting workflow.
Can I customize the KPIs and categories?
Yes, within the structure of each template. Excel dashboards can usually be adjusted by changing source data categories, refreshing pivot tables, and editing labels. Power BI dashboards can be customized further if the user is comfortable editing the data model, visuals, and relationships.
Which product is best for nonprofit finance reporting?
For churches and faith-based nonprofits, the Church Finance Dashboard in Excel and Church Finance Dashboard in Power BI are the most directly relevant. They include donor, fund, department, income, expense, and monthly trend views that match nonprofit finance committee needs.
Can a CFO use personal finance dashboards?
Yes, as long as expectations are clear. The personal finance dashboards are not corporate accounting dashboards, but they are useful for owner-operators, freelancers, financial coaches, executives managing household finance, and anyone who wants cash flow, savings, spending, and budget visibility.
Final Recommendation
If you need a CFO dashboard template for formal business reporting, begin with the reporting question: P&L summary, balance sheet-style tracking, working capital, KPI targets, or stakeholder presentation. For Excel-first finance teams, the Church Finance Dashboard in Excel and Personal Finance KPI Scorecard in Excel are the easiest starting points. For interactive executive review, the Church Finance Dashboard in Power BI and Microfinance Institutions Dashboard in Power BI are stronger. For specialized finance analytics, the blockchain templates give crypto and wallet activity a structure that is easier to review.
Built by PK – Microsoft Certified Professional with 15+ years of Excel, Google Sheets, and Power BI experience. Founder of NextGenTemplates, reaching 300K+ subscribers across YouTube channels. Every template is hand-built and tested before release.
For walkthroughs and dashboard tutorials, visit the NextGenTemplates YouTube channel.