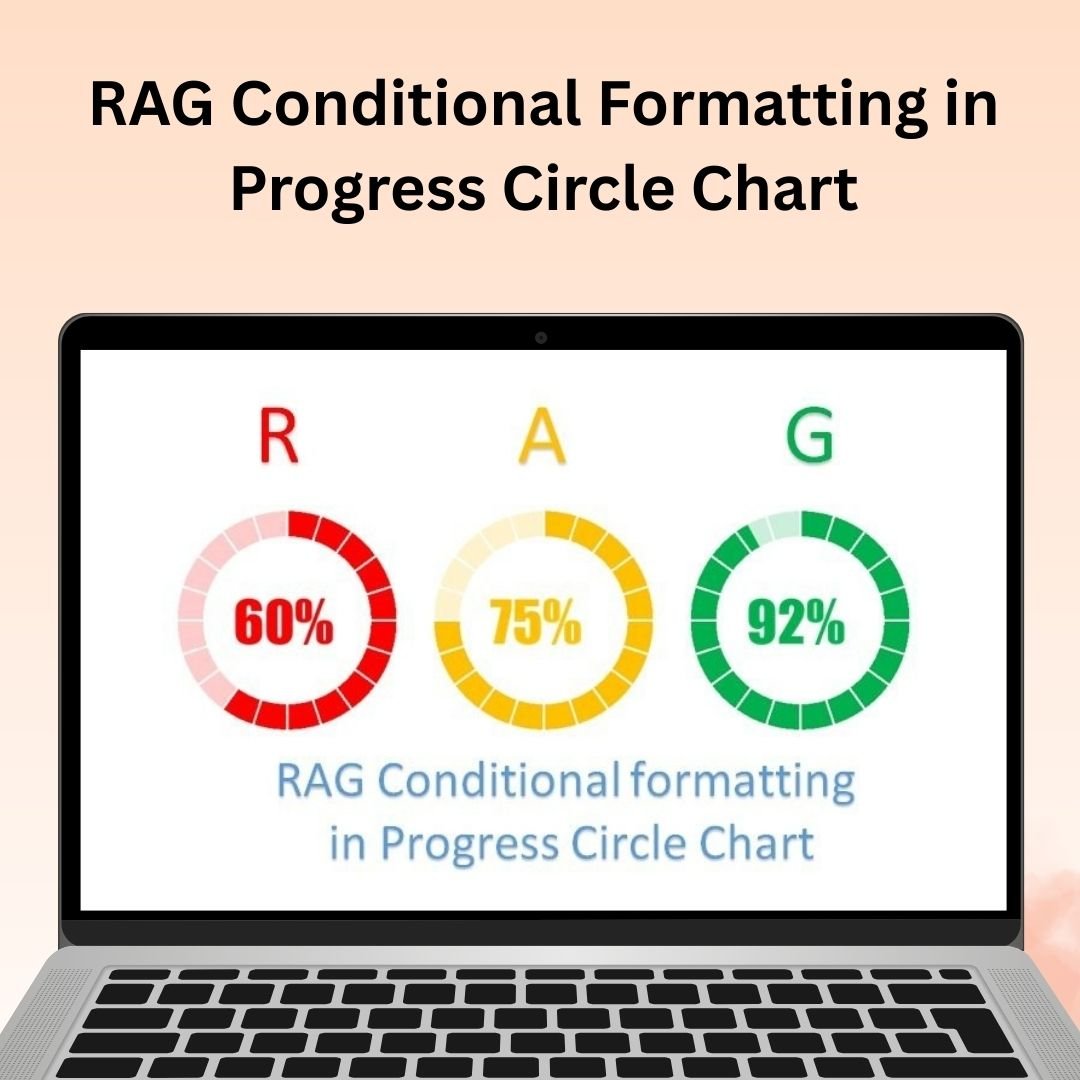
The RAG Conditional Formatting in Progress Circle Chart is a dynamic and visually appealing Excel tool designed to help you track and display performance metrics in a clear, engaging way. This chart incorporates the Red, Amber, and Green (RAG) conditional formatting system, allowing you to easily assess the status of key performance indicators (KPIs) based on predefined thresholds. Whether you’re managing projects, tracking sales, or monitoring any other metrics, this tool makes it easy to visualize progress and quickly identify areas that need attention.
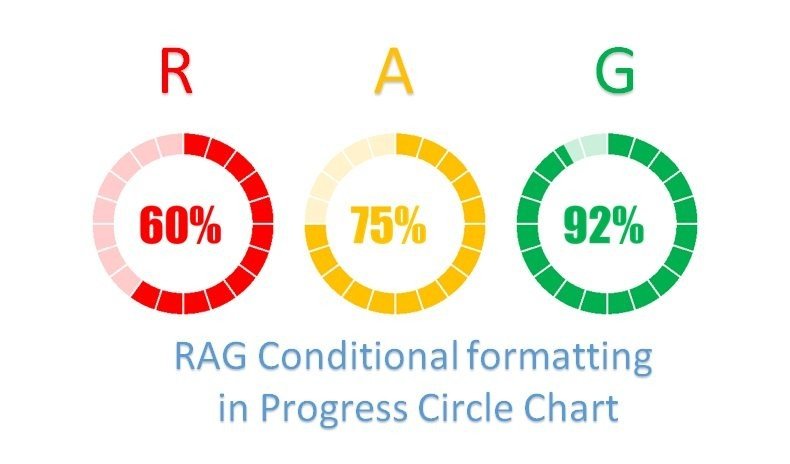
The Progress Circle Chart combines the simplicity of a circular progress indicator with the effectiveness of RAG conditional formatting. Each section of the circle is color-coded (red for underperformance, amber for caution, and green for success), offering an immediate, intuitive understanding of progress. It’s ideal for use in performance dashboards, reports, and presentations.
Key Features of the RAG Conditional Formatting in Progress Circle Chart:
🔵 Color-Coded Progress Indicator
The chart utilizes RAG (Red, Amber, Green) conditional formatting, with each color representing a different performance status. Green indicates that the target has been met, amber represents caution, and red signals that attention is needed.
⚙️ Dynamic Data Updates
As you input new data, the chart automatically updates and recalculates the performance, adjusting the color and progress to reflect the most current status. This ensures that your chart is always up-to-date.
📈 Customizable Thresholds
Set your own performance thresholds to define what constitutes red, amber, or green statuses. Whether you’re tracking sales, project completion, or any other KPIs, you can customize the limits based on your specific needs.
💡 User-Friendly Interface
With an easy-to-use setup, this chart is simple to integrate into any Excel dashboard. The intuitive design allows you to quickly input data, track progress, and generate real-time visual updates.
📊 Versatile KPI Tracking
This chart is perfect for tracking a wide variety of KPIs, such as sales targets, project milestones, team performance, or financial goals. Use it for individual KPIs or create a dashboard to monitor multiple performance indicators at once.
Why You’ll Love This RAG Conditional Formatting in Progress Circle Chart:
✅ Quickly Visualize Performance – The color-coded system makes it easy to understand how well you’re performing against targets at a glance. ✅ Improves Decision Making – Identify areas that need improvement and focus on key performance metrics to make data-driven decisions. ✅ Real-Time Updates – The chart updates automatically as new data is entered, giving you up-to-date insights into your performance. ✅ Customizable for Any Business – Adjust the thresholds and KPIs to suit your specific business needs, whether for project management, sales tracking, or other performance metrics. ✅ Engaging and Professional Design – This visually appealing chart enhances presentations, dashboards, and reports, making it easier to communicate performance results to stakeholders.
What’s Inside the RAG Conditional Formatting in Progress Circle Chart:
- RAG Conditional Formatting – Automatically color-codes progress based on performance.
- Dynamic Circle Progress – Displays progress in a circular format that’s easy to understand.
- Customizable Thresholds – Set performance limits that determine the RAG color.
- Real-Time Data Updates – The chart automatically recalculates as new data is entered.
- Easy Integration – Simple to implement into your existing Excel dashboards or reports.
How to Use the RAG Conditional Formatting in Progress Circle Chart:
1️⃣ Download the Template – Get instant access to your Excel file after purchase. 2️⃣ Input Data – Add your data and set performance thresholds for each KPI. 3️⃣ Track Performance – Watch the progress circle update as you enter new data. 4️⃣ Customize the Chart – Adjust the chart’s appearance, thresholds, and KPIs to fit your needs.
Who Can Benefit from the RAG Conditional Formatting in Progress Circle Chart?
- Business Owners and Managers
- Project Managers
- Sales and Marketing Teams
- Financial Analysts
- HR Managers (tracking employee performance)
- Operations and Logistics Managers
- Data Analysts
Keep track of your performance with this easy-to-use, visually engaging progress circle chart, and make data-driven decisions faster.
Click here to read the Detailed blog post
https://www.pk-anexcelexpert.com/rag-conditional-formatting-in-progress-circle-chart/


Reviews
There are no reviews yet.