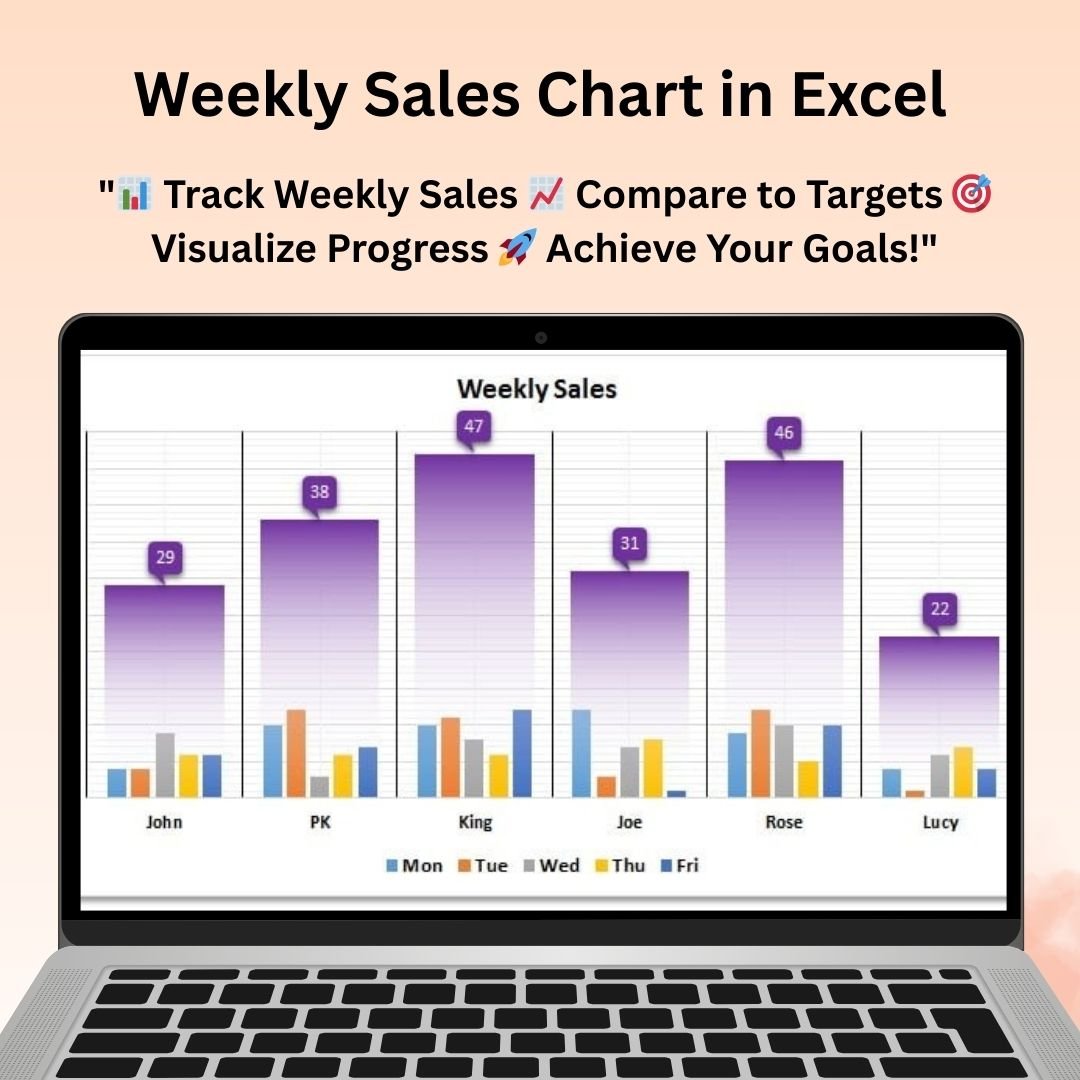
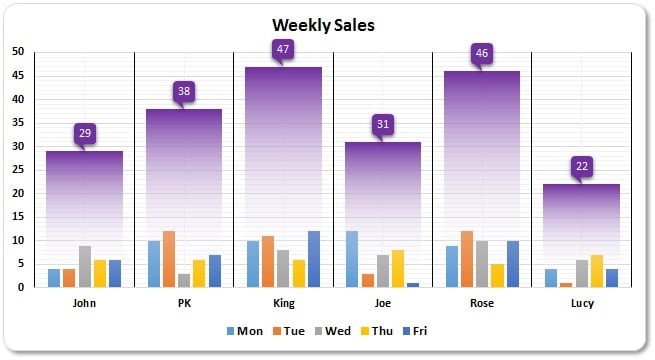
The Weekly Sales Chart is an essential tool for businesses and sales teams looking to track and visualize their weekly sales performance. This Excel-based chart allows you to monitor sales trends, identify fluctuations, and compare current sales against targets in a simple yet effective manner. Whether you’re a small business owner, a sales manager, or part of a larger corporate sales team, this chart provides a clear and actionable overview of weekly sales data.
This chart comes with dynamic features that allow you to input sales figures and targets for each week, automatically generating graphs that help you visualize your performance. From monitoring sales growth to tracking seasonal trends, this tool makes it easier than ever to make data-driven decisions and optimize your sales strategies.
Key Features of the Weekly Sales Chart:
📊 Track Weekly Sales Performance
Easily input actual sales data and track weekly sales performance against targets. The chart automatically calculates the difference, giving you a clear picture of how you’re meeting your goals.
📅 Weekly Breakdown
View your sales data in weekly segments. This allows you to identify performance fluctuations, spot patterns, and adjust your strategies accordingly. It’s perfect for tracking short-term sales trends and adjusting tactics quickly.
📈 Visualized Sales Progress
With dynamic graphs and bar charts, you’ll be able to quickly understand your sales progress at a glance. The chart’s visualizations make it easy to see which weeks performed better, and where improvements are needed.
🔄 Real-Time Data Updates
As you enter new sales figures, the chart automatically updates, providing real-time insights into your performance. This helps you stay on top of your sales goals and make timely decisions.
⚙️ Customizable Targets and Data Input
Easily adjust weekly sales targets, and modify the chart to fit the specific sales data and targets for your business or team. Whether you’re tracking revenue, units sold, or other performance metrics, you can tailor the chart to fit your needs.
Why You’ll Love This Weekly Sales Chart:
✅ Simple & Effective Tracking – Easily track your sales progress week by week with automated calculations and visually appealing charts. ✅ Real-Time Insights – The chart updates in real-time, allowing you to monitor performance as data is entered and stay on top of sales targets. ✅ Data-Driven Decisions – Identify trends, spot issues, and make informed decisions based on up-to-date sales performance data. ✅ Flexible & Customizable – Customize the chart for different sales targets, product categories, or team structures, ensuring it fits your specific needs. ✅ Helps Meet Sales Targets – By tracking weekly performance and comparing it to targets, the chart provides insights that help you achieve sales goals.
What’s Inside the Weekly Sales Chart:
- Weekly Sales Breakdown – Track and compare actual sales to targets on a week-by-week basis.
- Real-Time Graphical Insights – Visual graphs and bar charts to display sales progress and trends.
- Target Tracking – Set and track weekly sales targets and monitor your progress.
- Customizable Inputs – Easily adjust sales targets and data to match your business needs.
- Weekly Performance Comparison – Compare weekly sales performance to identify areas of improvement.
How to Use the Weekly Sales Chart:
1️⃣ Download the Template – Access your Excel file instantly after purchase. 2️⃣ Input Sales Data – Add your actual sales figures and targets for each week. 3️⃣ Track and Visualize Performance – Watch as the chart updates and generates graphs based on your input data. 4️⃣ Adjust Targets as Needed – Modify sales targets to match your team’s goals and track performance towards those targets.
Who Can Benefit from the Weekly Sales Chart:
- Sales Managers and Directors
- Business Owners
- Retail Managers
- Marketing and Sales Teams
- Financial Analysts
- Startups and Small Businesses
- Large Enterprises with Multiple Sales Teams
This Weekly Sales Chart will help you stay on top of your sales performance, identify trends, and achieve your sales goals with clear, actionable insights.
Click here to read the Detailed blog post
https://www.pk-anexcelexpert.com/weekly-sales-chart/


Reviews
There are no reviews yet.