The Traffic Lights in MS Excel tool is a unique and powerful solution for visualizing data in a clear and intuitive way. By using the familiar traffic light symbols (red, yellow, and green), this tool helps you easily highlight performance metrics, track KPIs, and visualize project progress. The colors instantly convey meaning, making it easier to interpret and act on important data points, trends, or issues.
This tool is perfect for monitoring various performance indicators, from sales and revenue tracking to project milestones or task completion. Whether you’re working on a business dashboard, performance report, or simply tracking personal goals, the Traffic Lights in MS Excel tool will make your data easier to understand at a glance. Its customizable features allow you to set thresholds for when each color appears, ensuring the chart reflects your specific goals and metrics.
Key Features of the Traffic Lights in MS Excel
📌 Simple Visual Indicators
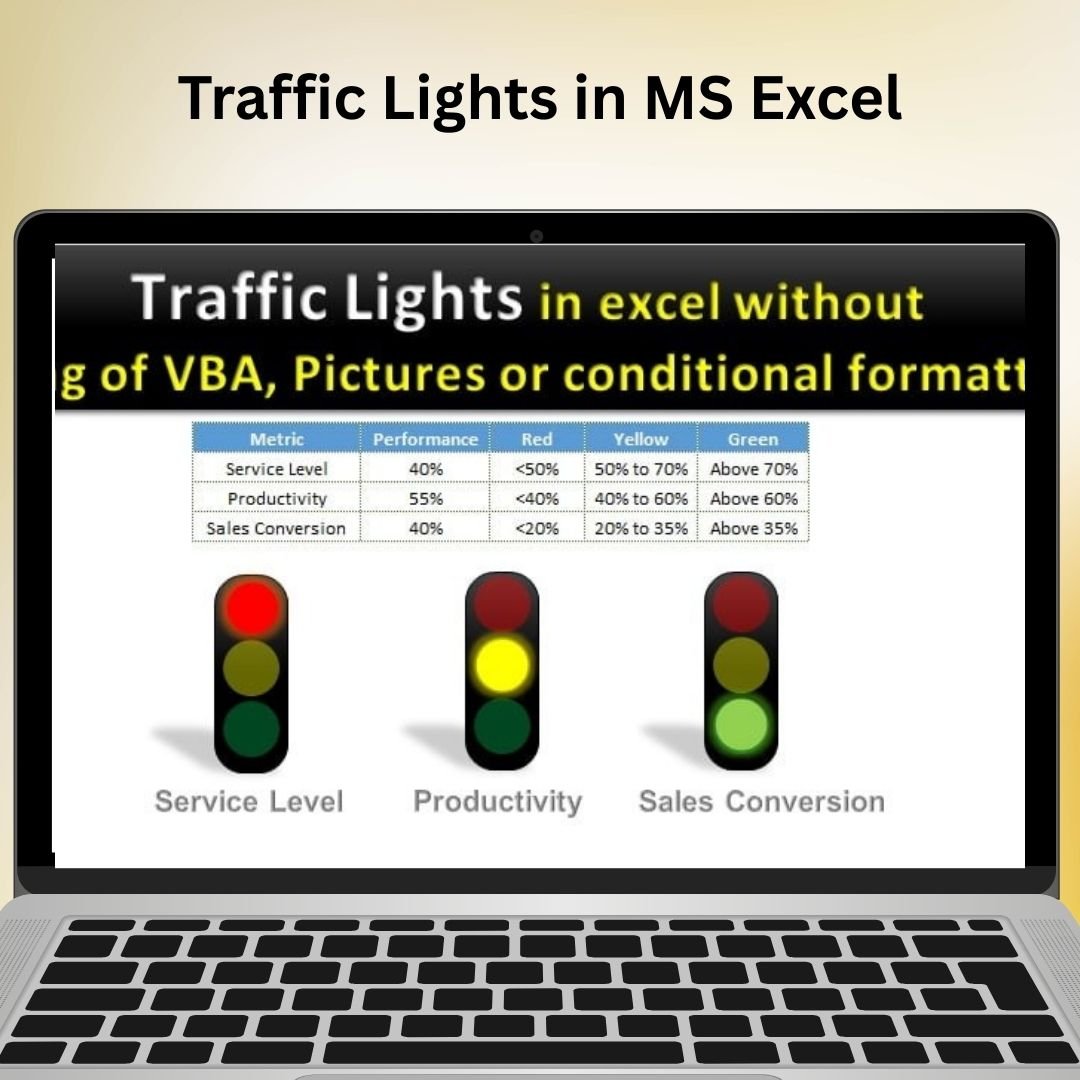
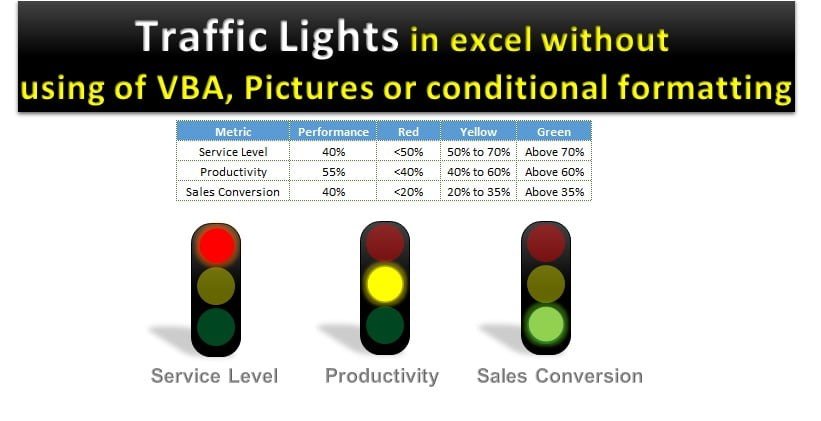
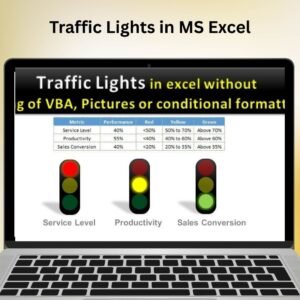
The traffic light system uses three colors (red, yellow, and green) to provide a clear visual representation of your data. Red indicates poor performance or a negative outcome, yellow signals caution or a moderate result, and green represents success or a positive outcome. This makes it easy to spot trends and take action quickly.
🛠 Customizable Thresholds
You can set your own thresholds for when each color appears. For example, you might set the red light to appear when a metric falls below 50%, yellow for values between 50% and 80%, and green for values above 80%. This ensures the tool aligns with your specific goals and performance metrics.
💡 Dynamic Data Updates
As you enter or update data, the traffic light indicators automatically adjust to reflect the current status. This dynamic functionality ensures that the data is always up-to-date and provides a real-time visual of your performance metrics.
🔢 Versatile Applications
This tool can be used in a variety of applications, such as monitoring sales performance, tracking project milestones, managing task completion rates, or analyzing financial data. No matter your use case, the Traffic Lights in MS Excel tool will make it easier to interpret your data and drive decisions.
🚀 Perfect for Dashboards
This tool is ideal for adding to business dashboards or performance reports. It provides a quick, visual snapshot of key metrics and allows managers, stakeholders, and team members to easily assess performance at a glance.
📊 User-Friendly Setup
Despite its powerful capabilities, the Traffic Lights in MS Excel tool is designed to be easy to use. You don’t need advanced Excel skills to start using it. Simply input your data, set your thresholds, and let the tool do the rest.
⚙ Why You’ll Love the Traffic Lights in MS Excel
✅ Clear Visual Indicators – Instantly see if your metrics are on track with the traffic light system. ✅ Customizable – Set your own thresholds to fit your specific goals. ✅ Real-Time Updates – The tool automatically adjusts as your data changes. ✅ Perfect for Dashboards – Easily add to reports, presentations, and dashboards for a quick visual assessment. ✅ User-Friendly – Simple to use with easy setup instructions, even for beginners.
📂 What’s Inside the Traffic Lights in MS Excel Tool?
- Traffic Light Indicators: Red, yellow, and green lights that show performance status.
- Customizable Thresholds: Set the values that trigger each color for specific metrics.
- Real-Time Data Updates: Automatically updates as data changes.
- Step-by-Step Setup Instructions: Clear instructions for setting up and customizing the tool.
🔍 How to Use the Traffic Lights in MS Excel Tool
1️⃣ Download the Template – Instant access to the Excel file upon purchase. 2️⃣ Input Your Data – Enter your performance data into the chart. 3️⃣ Set Thresholds – Define the values that trigger the red, yellow, and green indicators. 4️⃣ Track Performance – Watch as the traffic lights update in real-time as your data changes. 5️⃣ Present and Share – Use the tool in dashboards, reports, and presentations to convey performance data clearly.
🎯 Who Can Benefit from Traffic Lights in MS Excel? 🔹 Business Analysts
🔹 Project Managers
🔹 Sales Teams
🔹 Marketing Managers
🔹 Financial Analysts
🔹 Anyone looking to track performance and visualize progress quickly
The Traffic Lights in MS Excel tool makes it easy to track performance and visualize data trends. With real-time updates and customizable thresholds, you can focus on what matters most and take action to improve results.
Click here to read the Detailed blog post
https://www.pk-anexcelexpert.com/traffic-lights-in-ms-excel/


Reviews
There are no reviews yet.