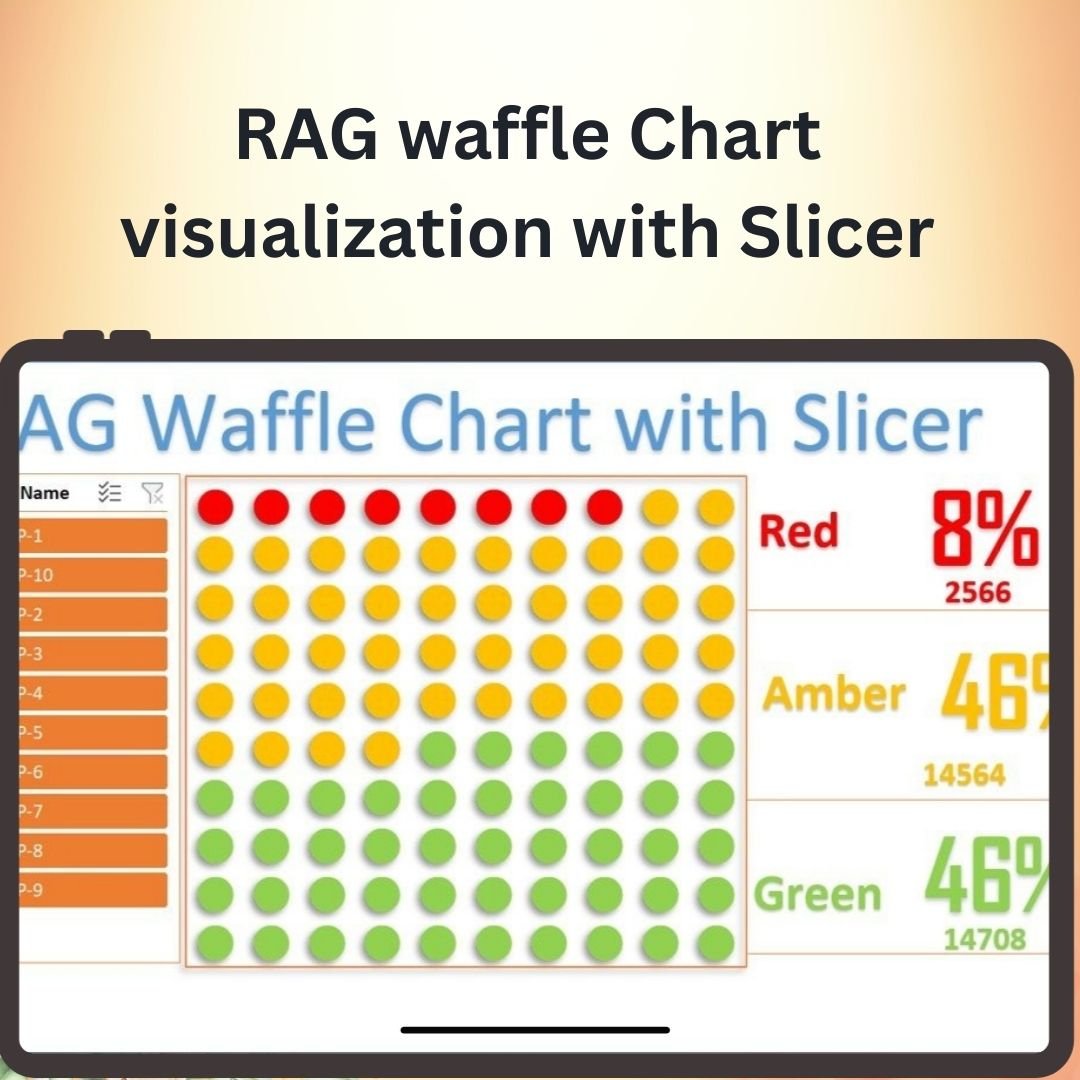
The RAG Waffle Chart Visualization with Slicer in Excel offers a unique and engaging way to visualize and track key performance indicators (KPIs) or any data that needs to be categorized into different performance levels using the Red, Amber, Green (RAG) system. With the integration of slicers, you can dynamically filter and drill down into your data for more in-depth analysis. Whether you’re tracking project progress, sales goals, or any other performance metric, the RAG Waffle Chart will help you present your data in a visually compelling and interactive manner.
This chart uses a grid layout, where each square represents a data point, and is color-coded to reflect the status of that data. Red indicates areas needing attention, Amber shows areas that are on track but may require caution, and Green signifies that targets are being met. The slicer functionality allows you to filter data based on time, categories, or other relevant dimensions, making it easy to track and analyze performance across different segments.

Key Features of the RAG Waffle Chart Visualization with Slicer
📌 Color-Coded Waffle Grid
The RAG Waffle Chart uses a grid of colored squares to visually represent data, with Red, Amber, and Green indicating the status of your performance metrics. This intuitive design makes it easy to see at a glance whether you’re on track, need to pay attention, or have met your targets.
🛠 Dynamic Data Filtering with Slicer
The Slicer functionality allows you to filter and view data by specific parameters, such as time periods, regions, or categories. With slicers, you can easily slice your data and explore different segments for more detailed analysis.
💡 Real-Time Updates
As your data updates, the RAG Waffle Chart automatically adjusts, providing real-time insights and visual updates. This ensures that you always have the most up-to-date data for decision-making.
🔢 Customizable Thresholds
Set custom thresholds for each RAG category (Red, Amber, Green) based on your specific needs. Whether you’re tracking project progress, sales performance, or any other metric, you can tailor the chart to reflect your data’s unique requirements.
🚀 Professional and Interactive Visualization
The chart’s interactive nature and sleek design make it ideal for reports, dashboards, and presentations. It’s perfect for business analysts, project managers, and teams that need a clear and compelling way to monitor KPIs and performance metrics.
📊 Perfect for Dashboards and Reports
The RAG Waffle Chart is ideal for dashboards and performance reports. Its compact yet informative design ensures that key metrics are represented clearly and engagingly, making it easier for stakeholders to interpret performance data.
⚙ User-Friendly Interface
Setting up the RAG Waffle Chart is simple, even for Excel beginners. With a clear setup guide and customization options, you can easily integrate this chart into your workflow, regardless of your Excel experience level.
🚀 Why You’ll Love the RAG Waffle Chart Visualization with Slicer
✅ Dynamic and Interactive – Filter and analyze data in real-time with slicers. ✅ Color-Coded for Clarity – Red, Amber, and Green make performance status easy to understand. ✅ Real-Time Updates – Automatically reflects changes in your data. ✅ Customizable Design – Adjust RAG thresholds and slicers to suit your needs. ✅ Ideal for Dashboards and Reports – Perfect for performance tracking in professional reports.
📂 What’s Inside the RAG Waffle Chart Visualization with Slicer?
- Color-Coded Waffle Grid: A grid of squares representing your data with Red, Amber, and Green colors.
- Dynamic Slicer: Filter data based on time periods, categories, or other parameters.
- Customizable Thresholds: Tailor the RAG categories to your performance data.
- Step-by-Step Setup Instructions: Easy instructions to get you started with this tool.
🔍 How to Use the RAG Waffle Chart Visualization with Slicer
1️⃣ Download the Template – Instant access to the Excel file upon purchase. 2️⃣ Input Your Data – Enter the relevant data and performance metrics into the Excel sheet. 3️⃣ Adjust RAG Thresholds – Customize the Red, Amber, and Green thresholds based on your specific goals. 4️⃣ Use Slicers for Filtering – Slice your data by time, region, or other dimensions for in-depth analysis. 5️⃣ Visualize and Track Performance – The chart will update in real-time, giving you a dynamic view of your performance metrics.
🎯 Who Can Benefit from the RAG Waffle Chart Visualization with Slicer? 🔹 Project Managers
🔹 Business Analysts
🔹 Sales Teams
🔹 Marketing Teams
🔹 Operations Managers
🔹 Anyone looking to track and visualize key performance indicators with ease
Simplify your data tracking and analysis with the RAG Waffle Chart Visualization with Slicer. This interactive and customizable tool helps you make informed decisions based on performance data.
Click here to read the Detailed blog post
https://www.pk-anexcelexpert.com/rag-waffle-chart-visualization-with-slicer/


Reviews
There are no reviews yet.