
Managing office leasing operations across multiple properties can quickly become complicated. Property managers must track occupancy rates, lease renewals, rental revenue, tenant retention, and property utilization simultaneously. However, many commercial real estate organizations still rely on manual reports and scattered spreadsheets, which makes it difficult to monitor leasing performance effectively.
That is exactly where the Office Space Leasing KPI Dashboard in Power BI becomes extremely valuable.
This ready-to-use Power BI dashboard helps property managers, leasing teams, commercial real estate companies, and facility managers monitor critical leasing performance indicators in a structured and visually powerful way. Instead of spending hours reviewing reports, this dashboard transforms raw leasing data into clear insights that support faster and smarter decision-making.
Because Power BI provides interactive visuals, automated calculations, and dynamic filtering options, users can quickly analyze leasing performance, compare actual results with targets, and monitor long-term trends.
Whether you manage a single office building or an entire commercial real estate portfolio, this dashboard provides the analytical visibility needed to improve leasing performance and maximize rental revenue.
🚀 Key Feature of Office Space Leasing KPI Dashboard in Power BI
The Office Space Leasing KPI Dashboard offers powerful analytics capabilities designed specifically for commercial real estate operations.
📊 Interactive Leasing Performance Dashboard
Analyze leasing performance using interactive Power BI visuals that instantly display key metrics and insights.
📅 Dynamic Month & KPI Group Filters
Use slicers to filter leasing data by month or KPI category to analyze specific performance areas.
🎯 Target vs Actual Performance Tracking
Compare actual leasing results with targets using automated calculations and performance indicators.
📈 MTD & YTD KPI Monitoring
Evaluate both short-term and long-term leasing performance with Month-to-Date and Year-to-Date metrics.
🔍 Performance Trend Analysis
Identify growth patterns and performance gaps through trend charts comparing current, previous year, and target values.
📑 Detailed KPI Table for Complete Insights
Monitor KPIs including KPI number, KPI group, KPI name, unit, KPI type, and performance comparisons.
🔄 Automated Data Refresh from Excel
Simply update the Excel source file and refresh Power BI to automatically update the dashboard visuals.
📊 Visual Performance Indicators
Green and red arrows instantly highlight whether KPIs are meeting targets.
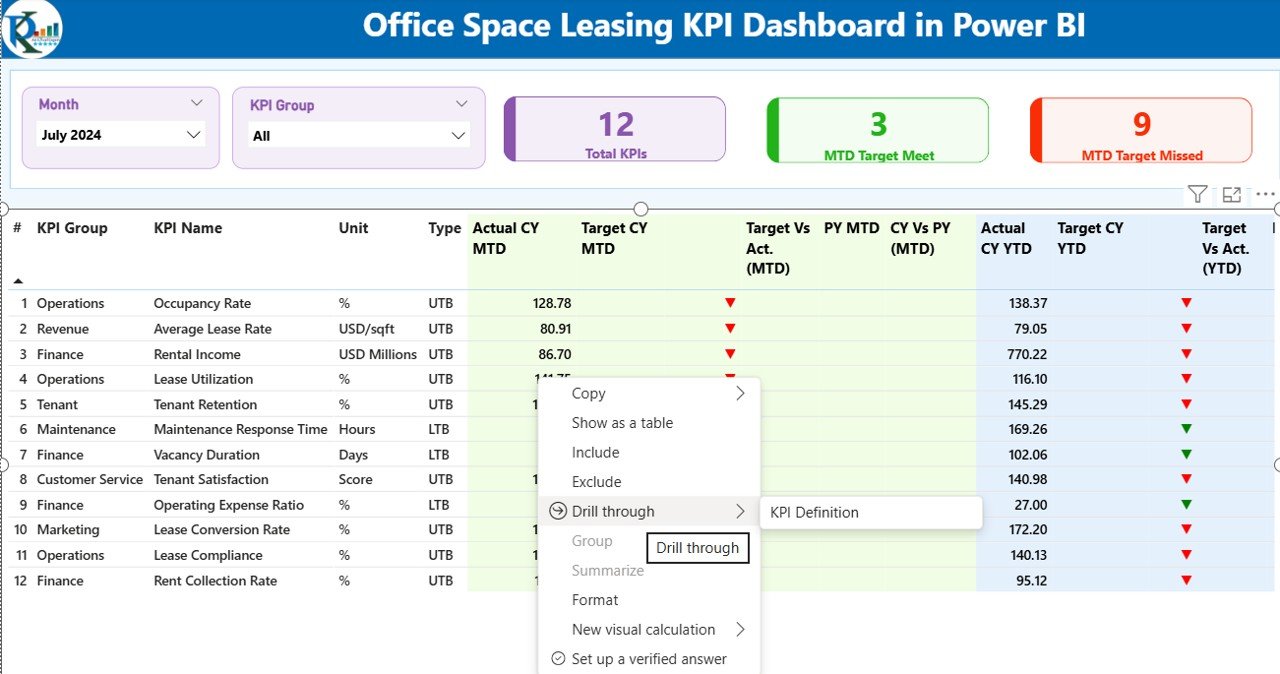
📚 Drill-Through KPI Definitions Page
Access detailed KPI formulas, definitions, and measurement units through a drill-through feature.
These features make the dashboard a powerful performance monitoring solution for modern leasing operations.
📦 What’s Inside the Office Space Leasing KPI Dashboard in Power BI
This dashboard is organized into three structured analytical pages, making it easy to analyze leasing performance from multiple perspectives.
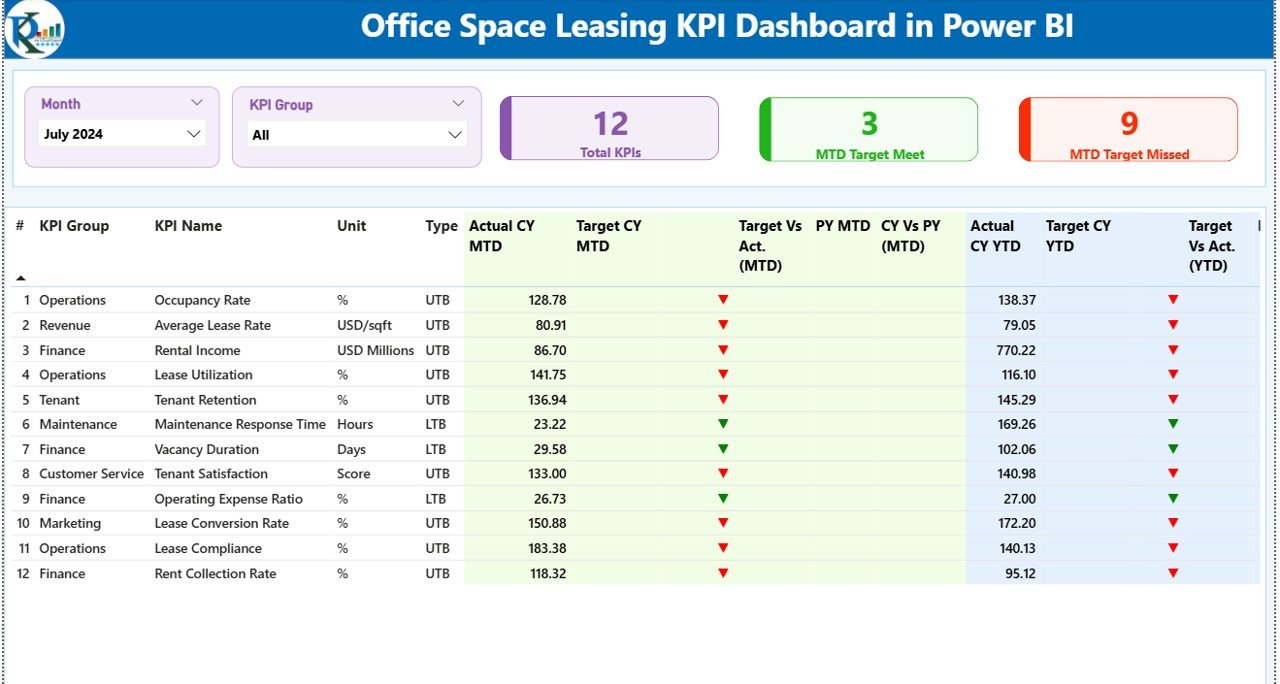
1️⃣ Summary Page – Leasing Performance Overview
The Summary Page acts as the main dashboard interface. It includes:
-
Month and KPI Group slicers
-
KPI performance cards showing:
-
Total KPIs Count
-
MTD Target Meet Count
-
MTD Target Missed Count
-
Below the cards, a detailed KPI table displays critical metrics including:
-
KPI identification fields
-
MTD actual vs target comparison
-
Previous year comparison
-
YTD performance tracking
-
Performance icons indicating target achievement
This page provides an instant overview of leasing performance across all KPIs.
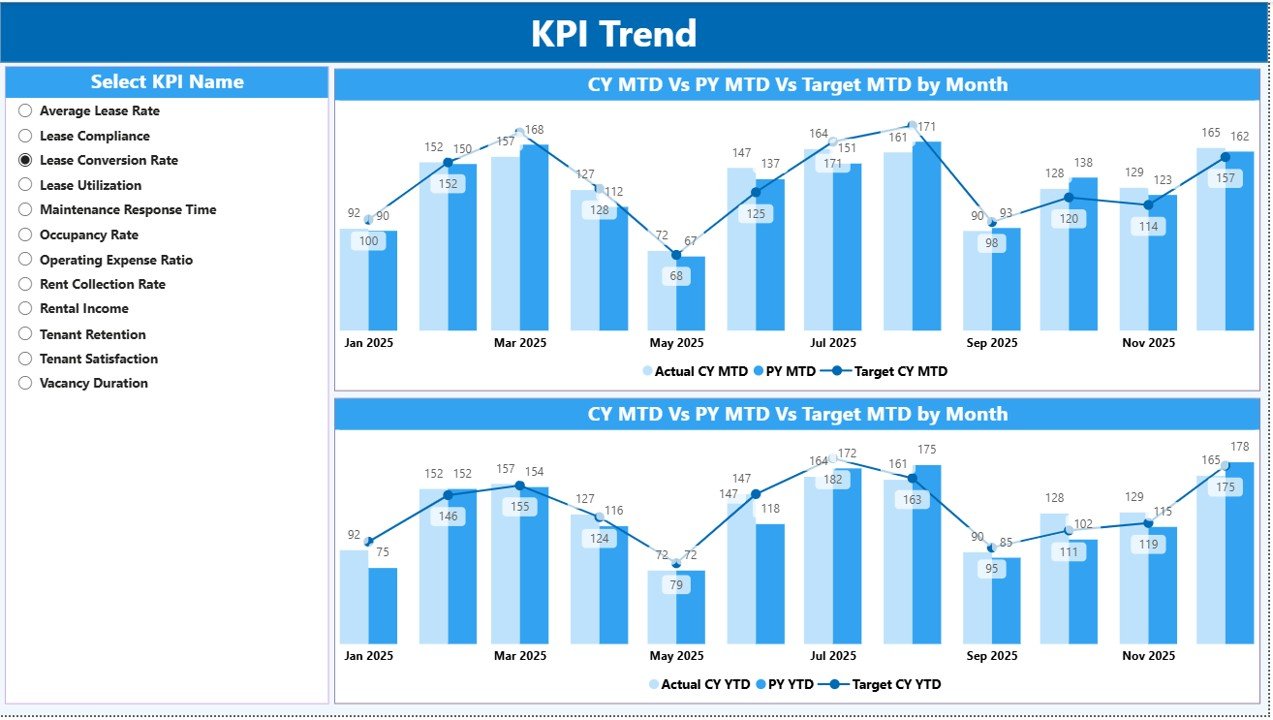
2️⃣ KPI Trend Page – Performance Trend Analysis
The KPI Trend Page helps analyze leasing performance over time using combo charts.
Charts compare:
-
Current Year Actual
-
Previous Year Actual
-
Target Value
Watch the step-by-step video tutorial:
Users can also select a specific KPI through the KPI slicer, which automatically updates the trend charts for deeper analysis.
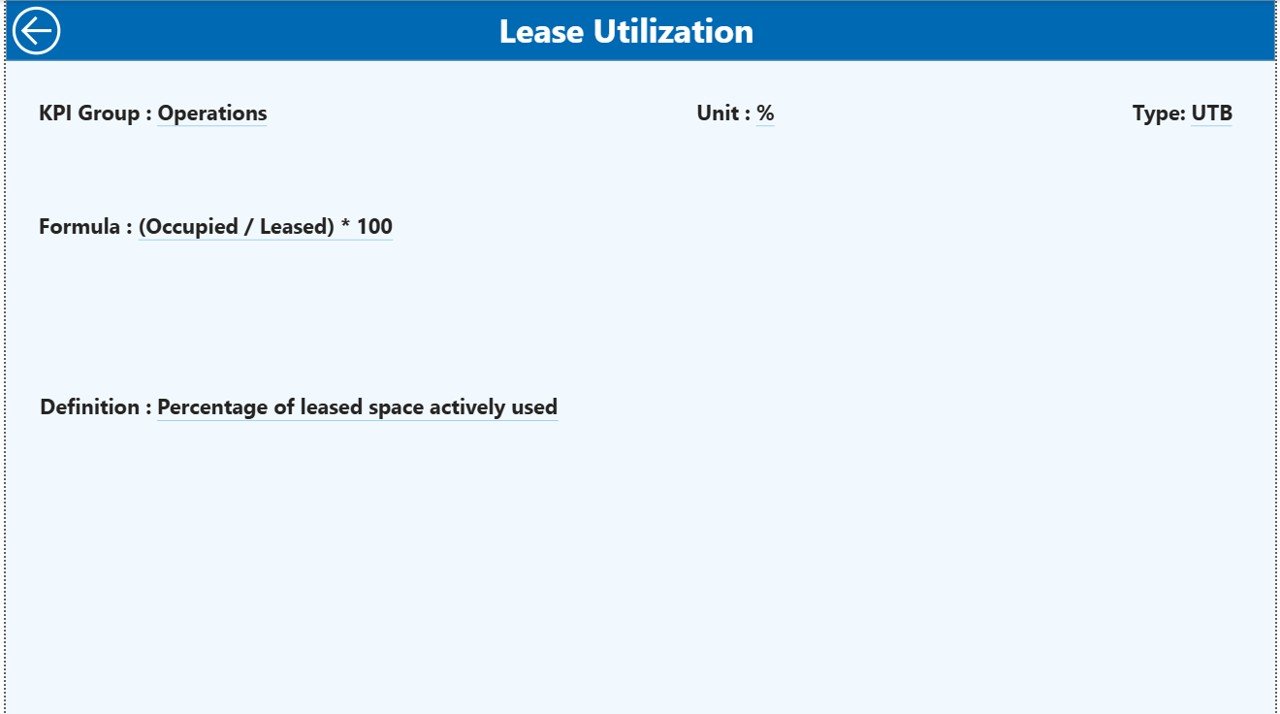
3️⃣ KPI Definition Page – KPI Drill-Through Insights
This page stores detailed KPI information including:
-
KPI formula
-
KPI definition
-
KPI category
-
KPI measurement unit
-
KPI type (LTB or UTB)
Users can access this page through drill-through from the summary dashboard.
⚙️ How to Use the Office Space Leasing KPI Dashboard in Power BI
Using the dashboard is simple and requires minimal setup.
Step 1 – Update the Excel Data Source
Enter data into three worksheets:
-
Input Actual Sheet (actual KPI values)
-
Input Target Sheet (KPI targets)
-
KPI Definition Sheet (KPI metadata)
Step 2 – Refresh the Power BI Dashboard
After updating Excel data, refresh Power BI to automatically update all visuals.
Step 3 – Analyze Leasing Performance
Use slicers and charts to evaluate leasing KPIs, track trends, and compare performance against targets.
Within minutes, leasing managers gain powerful insights into their property performance.
👥 Who Can Benefit from This Office Space Leasing KPI Dashboard
This dashboard is extremely useful for professionals working in commercial real estate and property management.
🏢 Commercial Real Estate Companies
🏬 Property Managers
📊 Leasing Managers
🏗 Facility Management Teams
💼 Real Estate Investors
📈 Property Asset Managers
Any organization responsible for leasing office space can use this dashboard to monitor performance, improve decision-making, and optimize leasing strategies.
By adopting a data-driven leasing analytics approach, companies can improve occupancy rates, increase tenant retention, and maximize rental revenue.
Click here to read the Detailed blog post


