In today’s data-driven environment, organizations rely heavily on Key Performance Indicators (KPIs) to evaluate operational efficiency, service quality, financial performance, and productivity. However, many businesses still manage performance data using scattered spreadsheets and manual reports. As a result, decision-makers often struggle to evaluate results quickly, identify performance gaps, and take corrective actions on time.
The Knowledge Hubs KPI Dashboard in Power BI provides a powerful, ready-to-use analytics solution designed to simplify KPI tracking and performance analysis. This interactive Power BI dashboard converts raw KPI data stored in Excel into dynamic visual insights that help organizations monitor performance trends, compare targets with actual results, and identify improvement opportunities.
Instead of reviewing multiple spreadsheets, managers and analysts can view all key metrics from a centralized dashboard. With advanced Power BI visualizations, slicers, and drill-through capabilities, users can analyze performance quickly and make better strategic decisions.
Whether you are monitoring outsourced accounting KPIs, knowledge management metrics, or operational performance indicators, this dashboard provides a structured and scalable solution for KPI reporting.
🚀 Key Features of Knowledge Hubs KPI Dashboard in Power BI
📊 Interactive KPI Monitoring Dashboard – Track multiple KPIs in one centralized view.
📅 Month & KPI Group Filters – Instantly filter KPI data using dynamic slicers.
📈 MTD & YTD Performance Tracking – Monitor both monthly and yearly KPI performance.
🎯 Target vs Actual Comparison – Quickly identify performance gaps.
📉 Previous Year Benchmarking – Evaluate growth compared to historical results.
📊 KPI Trend Charts – Analyze performance changes over time.
📘 Drill-Through KPI Definitions – Access detailed KPI formulas and descriptions.
⚡ Automated Calculations – Reduce manual calculations and reporting errors.
📁 Excel-Based Data Source – Update Excel data and refresh Power BI instantly.
📦 Dashboard Structure – 3 Analytical Pages
The Power BI dashboard includes three structured pages, each designed to provide specific performance insights.
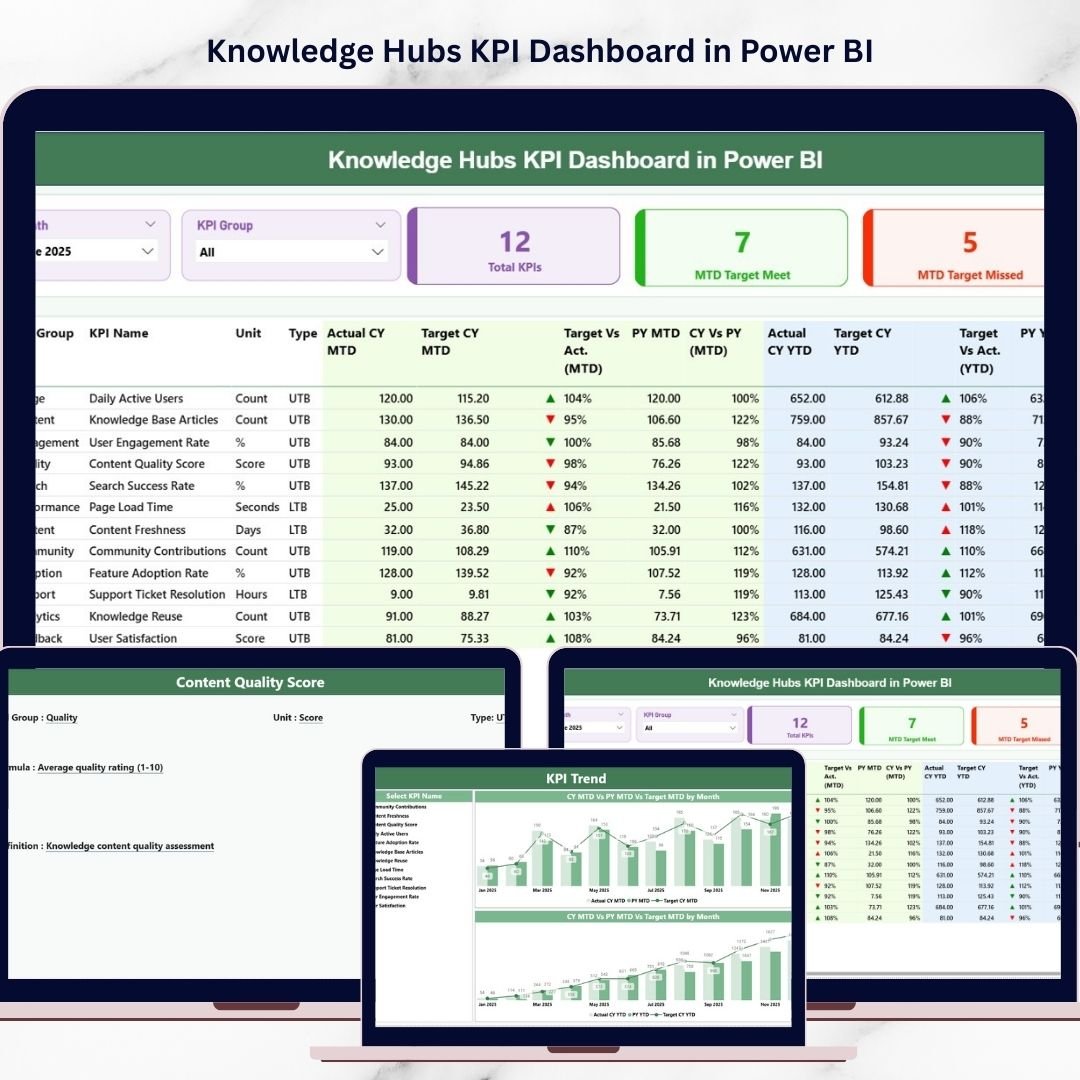
1️⃣ Summary Page – Main KPI Performance Overview
The Summary Page acts as the central interface of the dashboard.
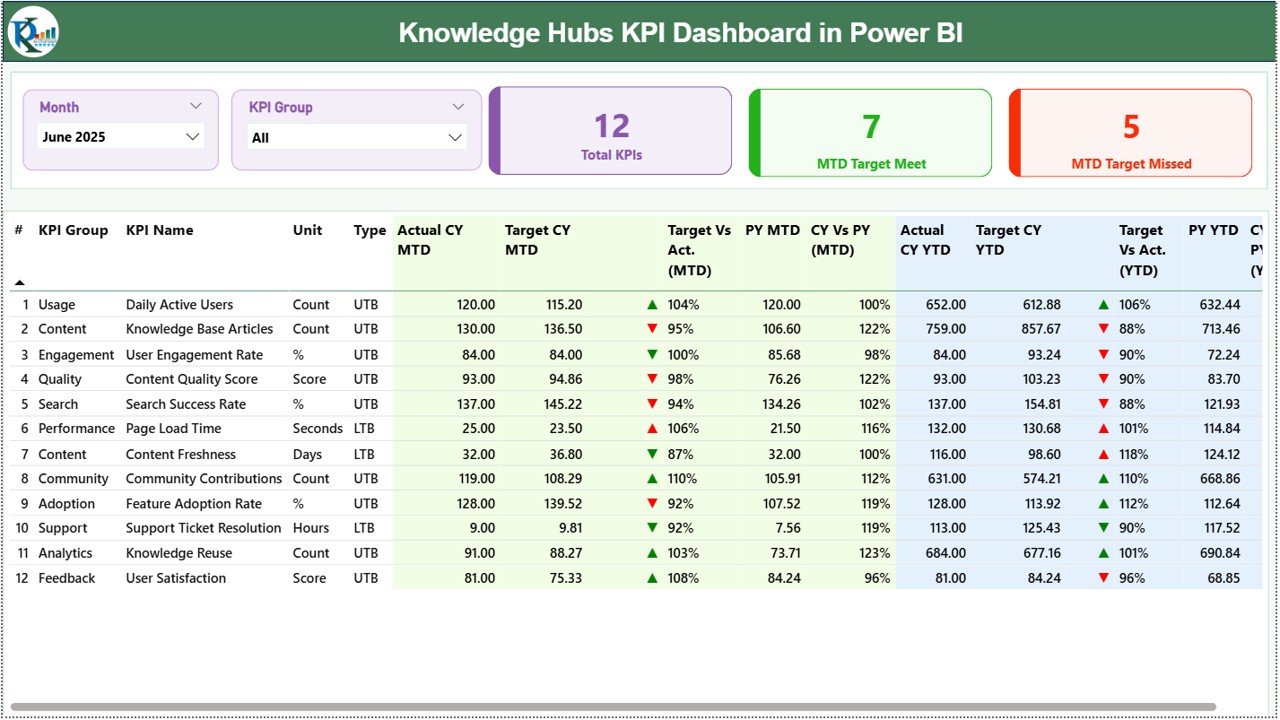
At the top of the page, users will find two interactive slicers:
-
Month slicer
-
KPI Group slicer
These filters allow users to analyze KPI performance for specific months or KPI categories.
KPI Performance Cards
The dashboard displays three KPI cards:
-
Total KPIs Count – Total number of KPIs monitored.
-
MTD Target Meet Count – KPIs that achieved monthly targets.
-
MTD Target Missed Count – KPIs that failed to meet targets.
These cards provide a quick overview of organizational performance.
KPI Performance Table
The Summary Page also includes a detailed KPI table containing:
-
KPI Number
-
KPI Group
-
KPI Name
-
Unit of Measurement
-
KPI Type (LTB / UTB)
MTD Performance Metrics
-
Actual CY MTD
-
Target CY MTD
-
MTD Performance Icon
-
Target vs Actual (MTD)
-
Previous Year MTD
-
CY vs PY Comparison
Green and red indicators help users instantly identify KPI performance.
YTD Performance Metrics
The dashboard also tracks long-term KPI performance:
-
Actual CY YTD
-
Target CY YTD
-
YTD Performance Indicator
-
Target vs Actual (YTD)
-
Previous Year YTD
-
CY vs PY Comparison
This allows organizations to evaluate cumulative yearly performance.
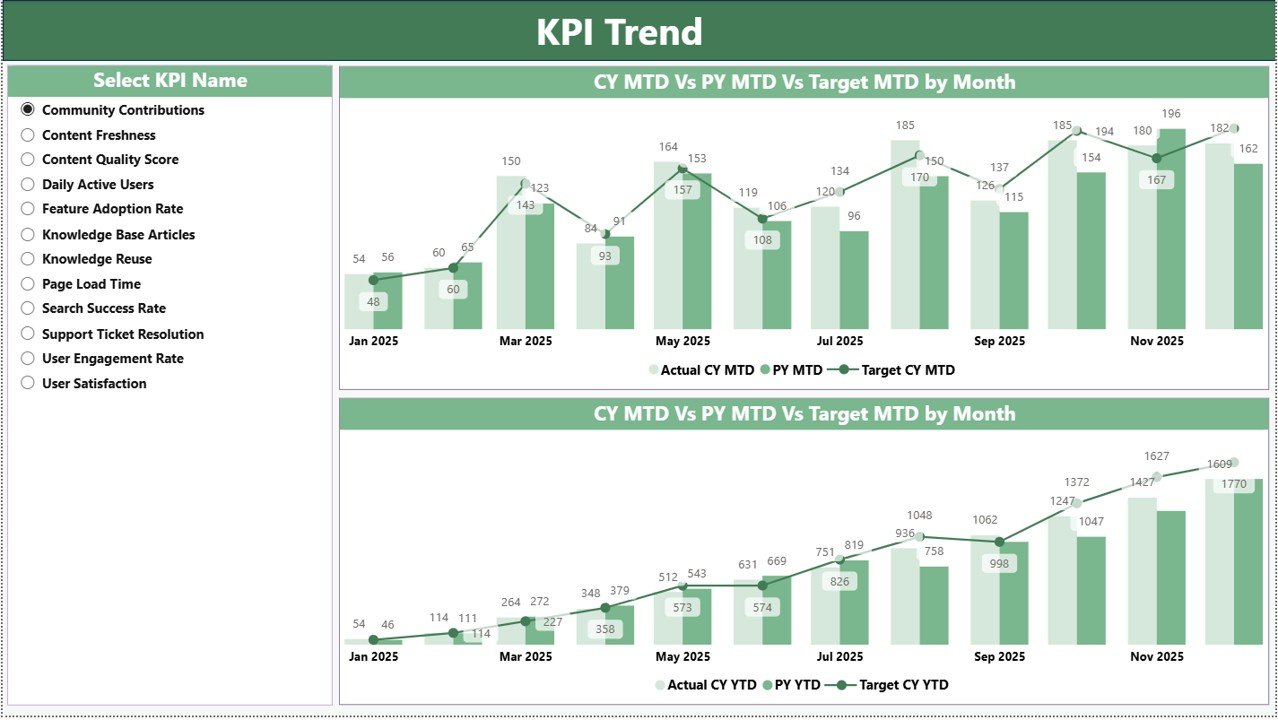
2️⃣ KPI Trend Page – KPI Performance Trends
The KPI Trend Page provides deeper performance analysis through visual charts.
This page contains two combo charts:
📈 MTD Trend Chart – Displays Actual vs Target vs Previous Year values.
📊 YTD Trend Chart – Shows long-term KPI performance comparison.
An interactive KPI Name slicer allows users to select any KPI and analyze its performance trends.
As a result, managers can quickly detect improvement patterns or performance issues.
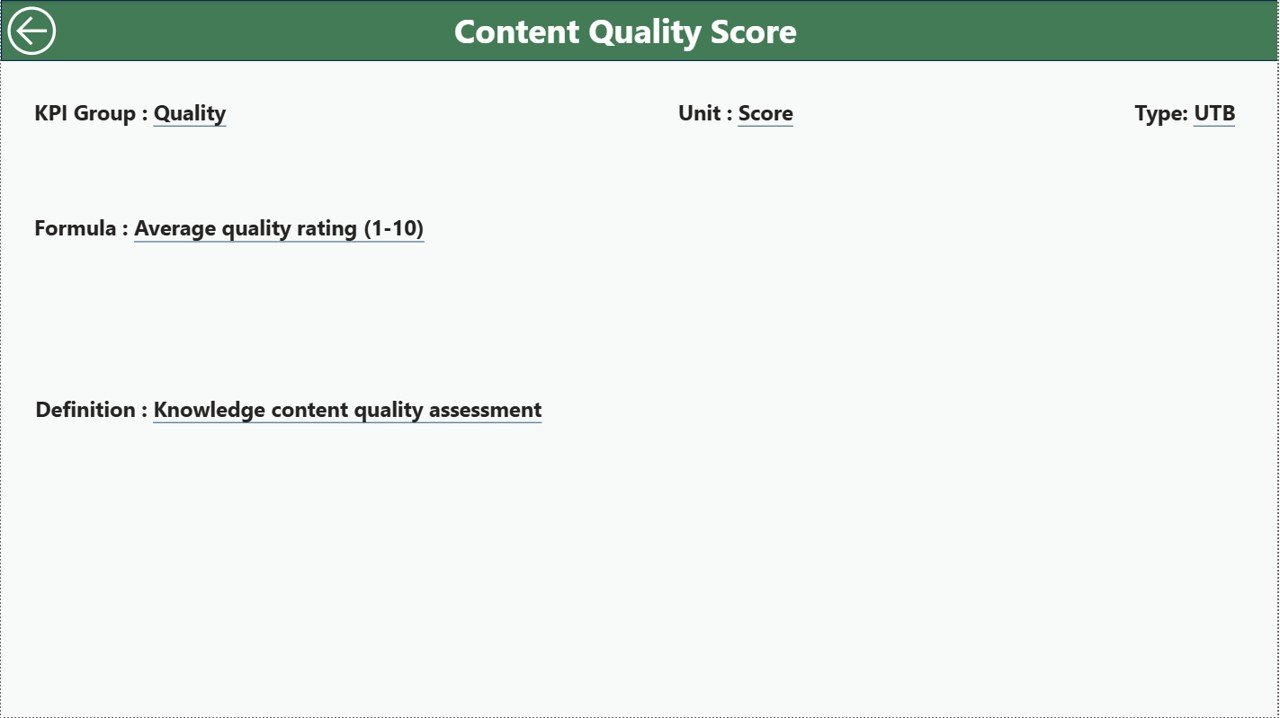
3️⃣ KPI Definition Page – KPI Logic & Documentation
The KPI Definition Page provides detailed information about each KPI.
This page includes:
-
KPI Formula
-
KPI Definition
-
KPI Unit
-
KPI Category
-
KPI Type (LTB / UTB)
Users can access this page through drill-through functionality from the Summary Page.
This ensures transparency and helps stakeholders understand KPI calculations.
📊 Excel Data Source Structure
The Power BI dashboard connects to an Excel workbook containing three worksheets.
1️⃣ Input Actual Sheet
Stores actual KPI values.
Columns include:
-
KPI Name
-
Month
-
MTD values
-
YTD values
Updating this sheet automatically updates the dashboard after refresh.
2️⃣ Input Target Sheet
Stores KPI target values.
Columns include:
-
KPI Name
-
Month
-
Target MTD values
-
Target YTD values
These targets are used for performance comparison.
3️⃣ KPI Definition Sheet
Stores KPI metadata including:
-
KPI Number
-
KPI Group
-
KPI Name
-
Unit
-
Formula
-
Definition
-
KPI Type (LTB or UTB)
This sheet ensures KPI clarity across the organization.
⭐ Advantages of Knowledge Hubs KPI Dashboard in Power BI
✅ Centralized KPI Monitoring – View all performance metrics in one place.
✅ Interactive Data Analysis – Use filters and slicers for dynamic insights.
✅ Real-Time Performance Updates – Refresh dashboard with updated Excel data.
✅ Improved Decision-Making – Visual insights simplify KPI analysis.
✅ Historical Performance Comparison – Track improvement over time.
✅ Professional Reporting – Present KPIs with clear visual dashboards.
🔧 Best Practices for Using the Dashboard
✔ Clearly define KPI formulas and measurement units.
✔ Maintain consistent data entry in Excel sheets.
✔ Update KPI values regularly to ensure accurate insights.
✔ Review KPI trends monthly or quarterly.
✔ Focus on actionable KPIs that impact organizational performance.
### Click here to read the Detailed blog post
🎥 Visit our YouTube channel to learn step-by-step video tutorials
👉 https://youtube.com/@PKAnExcelExpert