Advertising is one of the most important drivers of modern business growth. Companies invest significant budgets in digital ads, social media campaigns, search engine marketing, and display advertising to attract customers and increase revenue. However, running campaigns alone is not enough. Businesses must track campaign performance continuously to understand what works and what needs improvement.Advertising KPI Scorecard in Google Sheets
Many marketing teams still rely on scattered spreadsheets and manual reports to analyze advertising data. As a result, it becomes difficult to measure campaign success accurately. Managers often struggle to monitor metrics like conversions, click-through rates, advertising costs, and return on investment.Advertising KPI Scorecard in Google Sheets
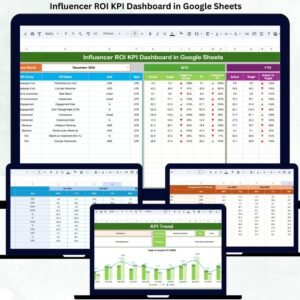
That is where the Advertising KPI Scorecard in Google Sheets becomes extremely valuable.
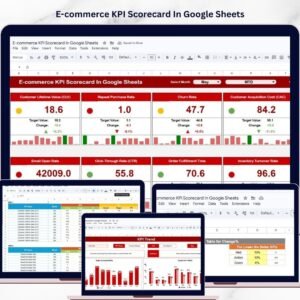
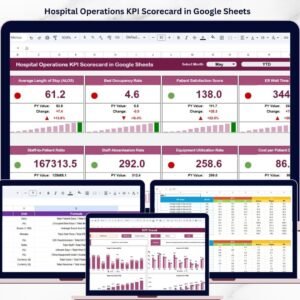
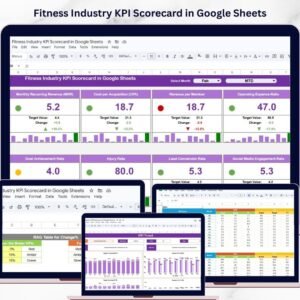
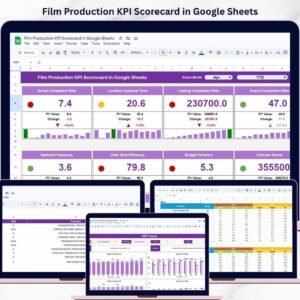
This ready-to-use template helps marketing teams monitor campaign performance using structured KPIs, automated calculations, and visual performance indicators. Instead of analyzing multiple reports, users can track all advertising metrics from one centralized scorecard.
Because the template includes monthly analysis, KPI trend charts, traffic light indicators, and structured data sheets, marketing teams can quickly evaluate campaign performance and make smarter marketing decisions.
If you want a simple yet powerful tool to monitor advertising performance, this Google Sheets KPI scorecard provides the perfect solution.
📊 Key Feature of Advertising KPI Scorecard in Google Sheets
This powerful scorecard template includes multiple features designed to simplify advertising performance monitoring.
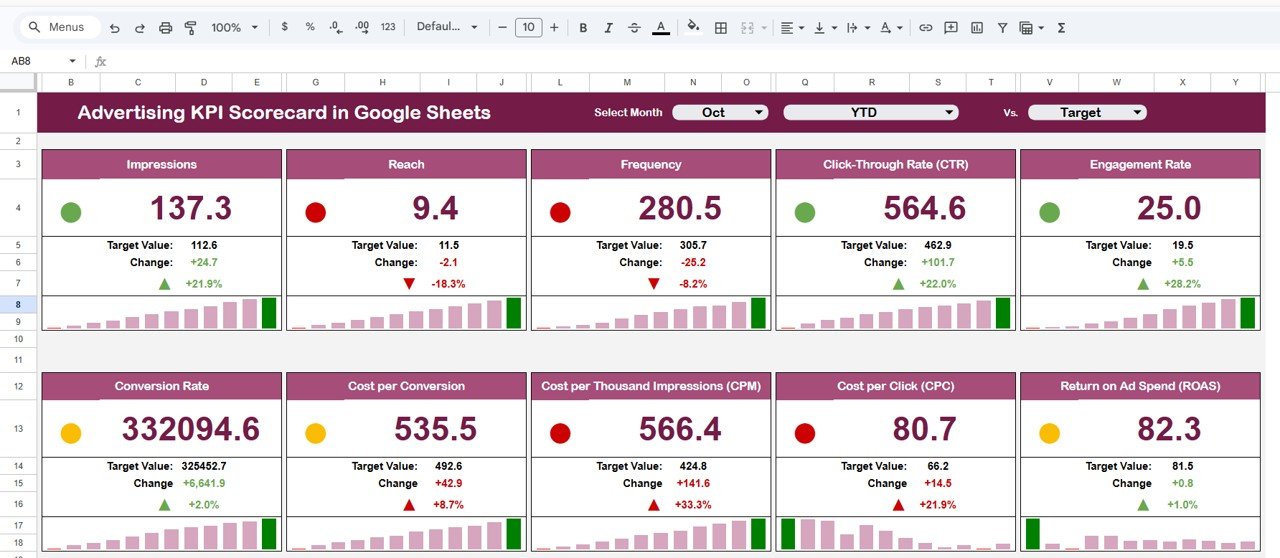
📅 Monthly Performance Selection – Select any month using a dropdown and instantly update all KPI metrics.
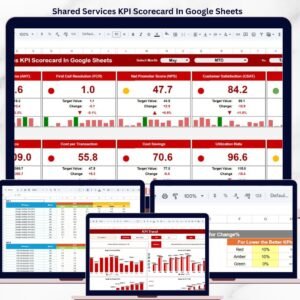
🚦 Traffic Light Performance Indicators – Visual colors (Green, Yellow, Red) highlight whether KPIs meet targets.
📈 Performance Change Arrows – Up and down arrows show KPI performance improvements or declines.
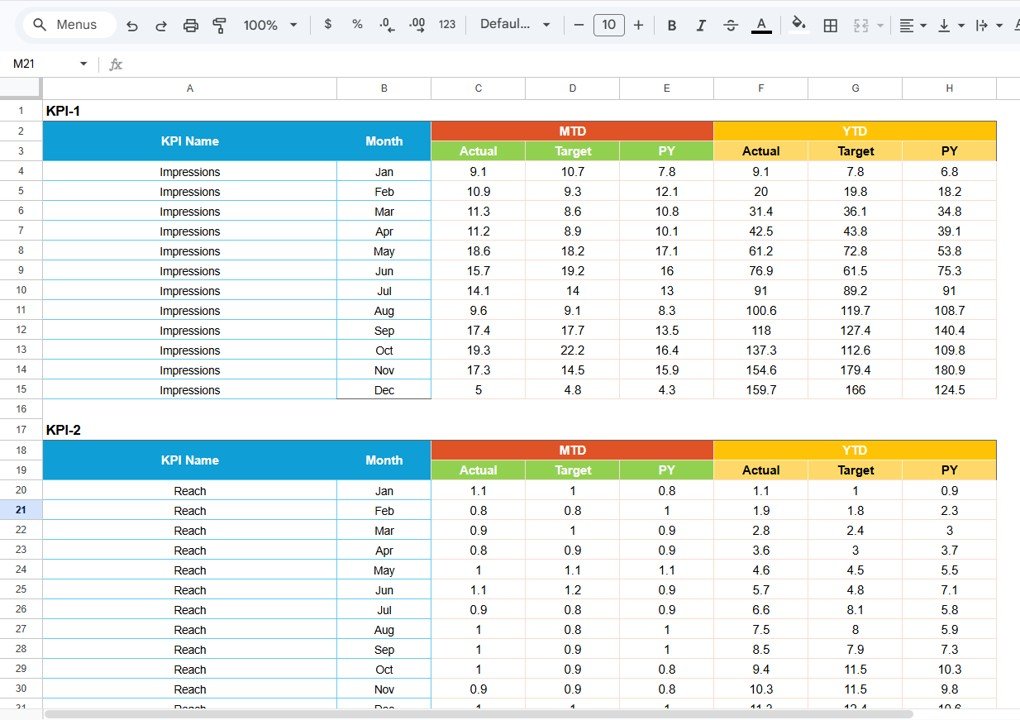
📊 MTD and YTD Analysis – Track both monthly performance and year-to-date results.
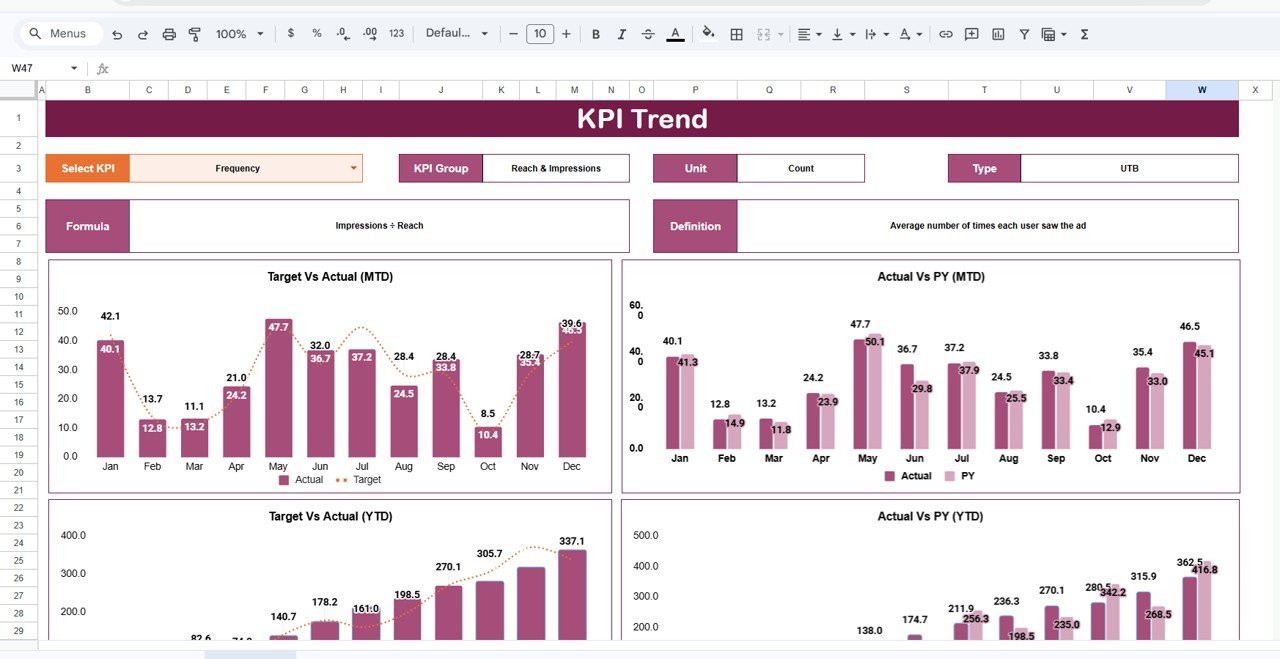
📉 KPI Trend Analysis Charts – Visual charts display historical KPI performance over time.
🧾 Structured KPI Documentation – Centralized KPI definitions ensure consistency across teams.
📥 Simple Data Input Sheet – Enter raw advertising data and let the scorecard calculate KPI metrics automatically.
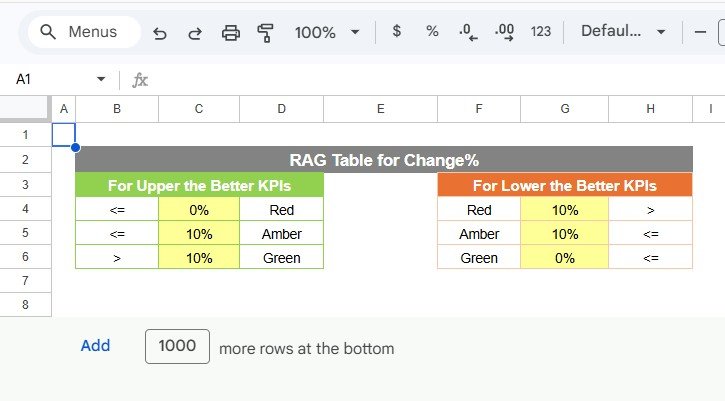
🎨 Customizable KPI Colour Settings – Adjust traffic light thresholds and performance conditions.
🔎 Centralized Marketing Performance View – Monitor all advertising KPIs from one interactive dashboard.
Because of these features, marketing managers can quickly understand campaign performance and identify optimization opportunities.
📦 What’s Inside the Advertising KPI Scorecard in Google Sheets
This template is designed with structured sheets that organize advertising performance data efficiently.
Inside the template you will find:
✅ Scorecard Sheet – Main advertising KPI dashboard
✅ Trend Sheet – Visual trend analysis for selected KPIs
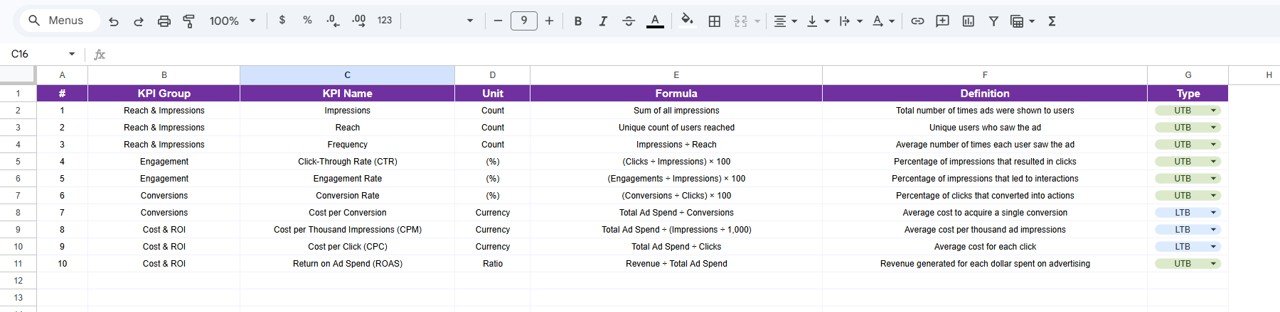
✅ KPI Definition Sheet – Central documentation of KPI formulas and descriptions
✅ Data Input Sheet – Enter raw advertising data for analysis
✅ Colour Settings Section – Configure performance thresholds and indicators
The scorecard monitors multiple advertising metrics including:
Impressions
Clicks
Click-Through Rate (CTR)
Conversion Rate
Cost Per Click (CPC)
Cost Per Acquisition (CPA)
Advertising Spend
Revenue from Campaigns
Return on Advertising Spend (ROAS)
Advertising Profitability
Because the template automatically calculates KPI values, users can focus on analyzing campaign results instead of manual calculations.
⚙️ How to Use the Advertising KPI Scorecard in Google Sheets
Using this KPI scorecard is simple and user-friendly.
1️⃣ Enter advertising campaign data in the Data Input Sheet.
2️⃣ Select the desired month from the Scorecard dropdown menu.
3️⃣ Review KPI performance indicators on the main scorecard dashboard.
4️⃣ Analyze historical performance using the Trend Sheet charts.
5️⃣ Review KPI definitions and formulas in the KPI Definition Sheet.
Within seconds, marketing teams can analyze advertising performance and identify optimization opportunities.
Because the template uses automated formulas and visual indicators, the analysis process becomes faster and more accurate.
👥 Who Can Benefit from This Advertising KPI Scorecard
This template is designed for professionals involved in marketing performance tracking.
It is especially useful for:
📊 Digital Marketing Managers
📈 Marketing Analysts
💻 Performance Marketing Teams
🏢 Advertising Agencies
🛒 E-commerce Businesses
📣 Social Media Marketing Teams
👨💼 Business Owners
Because the template supports cloud collaboration through Google Sheets, multiple team members can work with the scorecard simultaneously.
💡 Why Businesses Use This Advertising KPI Scorecard
✔ Centralized marketing performance monitoring
✔ Faster identification of campaign performance issues
✔ Better advertising cost control
✔ Clear KPI comparisons and trend analysis
✔ Data-driven marketing decision-making
✔ Easy collaboration using Google Sheets
✔ Automated KPI calculations and visual indicators
✔ Simple and scalable marketing analytics tool
Instead of relying on fragmented marketing reports, businesses gain a structured KPI monitoring system that helps improve campaign performance and return on investment.
This scorecard converts advertising data into actionable insights that help marketing teams optimize strategies and achieve better results.
### Click here to read the Detailed blog post
Watch the step-by-step video tutorial:
Visit our YouTube channel to learn step-by-step video tutorials
Youtube.com/@NeotechNavigators