Managing content creation across blogs, social media, campaigns, and marketing platforms can quickly become overwhelming. When teams rely on scattered spreadsheets or manual tracking, productivity drops, deadlines get missed, and performance insights remain unclear.
The Copywriting & Content Creation Dashboard in Power BI is designed to solve this challenge by transforming your content workflow into a fully visual, data-driven management system. Instead of guessing what works, this dashboard helps you track productivity, engagement, and workflow performance from one centralized analytics platform.
Built using Microsoft Power BI, this ready-to-use dashboard converts raw content data into powerful visual insights. Content managers, marketers, agencies, and business owners can instantly monitor progress, compare performance, and make faster strategic decisions.
Whether you manage blog publishing, social media campaigns, or multi-platform marketing operations, this dashboard provides complete visibility into your content ecosystem.
🚀 Key Feature of Copywriting & Content Creation Dashboard in Power BI
✅ Interactive KPI tracking for engagement views, clicks, and completed content
✅ Compare estimated vs actual working hours to measure productivity
✅ Monitor workflow stages including draft, review, and published status
✅ Analyze performance by content type, category, and platform
✅ Monthly trend analysis for long-term performance insights
✅ Dynamic slicers for instant filtering and deep analysis
✅ Automated visual reporting without manual calculations
✅ Professional Power BI design ready for business use
This dashboard acts as a command center where decision-makers instantly understand team performance and content effectiveness.
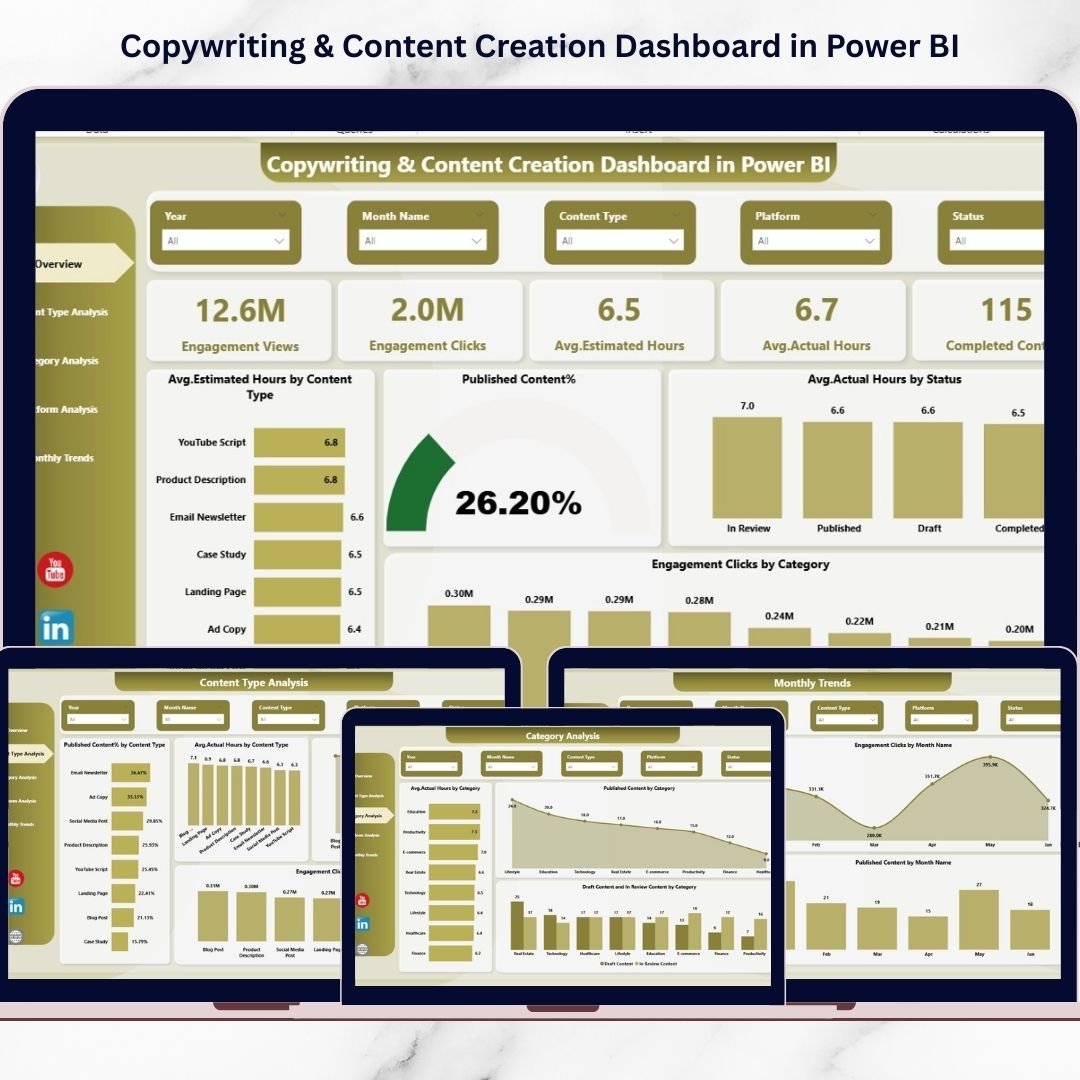
📦 What’s Inside the Copywriting & Content Creation Dashboard in Power BI
This dashboard includes five powerful analytical pages designed for complete performance visibility:
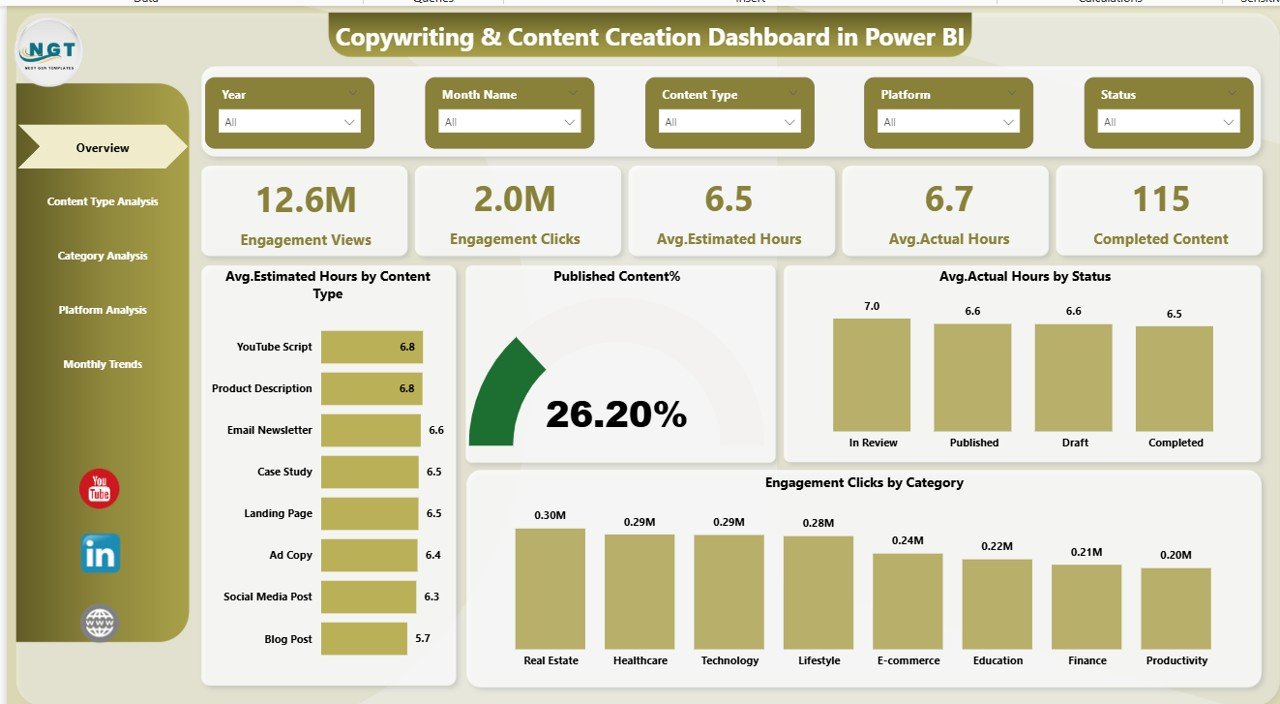
1️⃣ Overview Page
A high-level performance snapshot displaying key KPIs, engagement metrics, and productivity indicators.
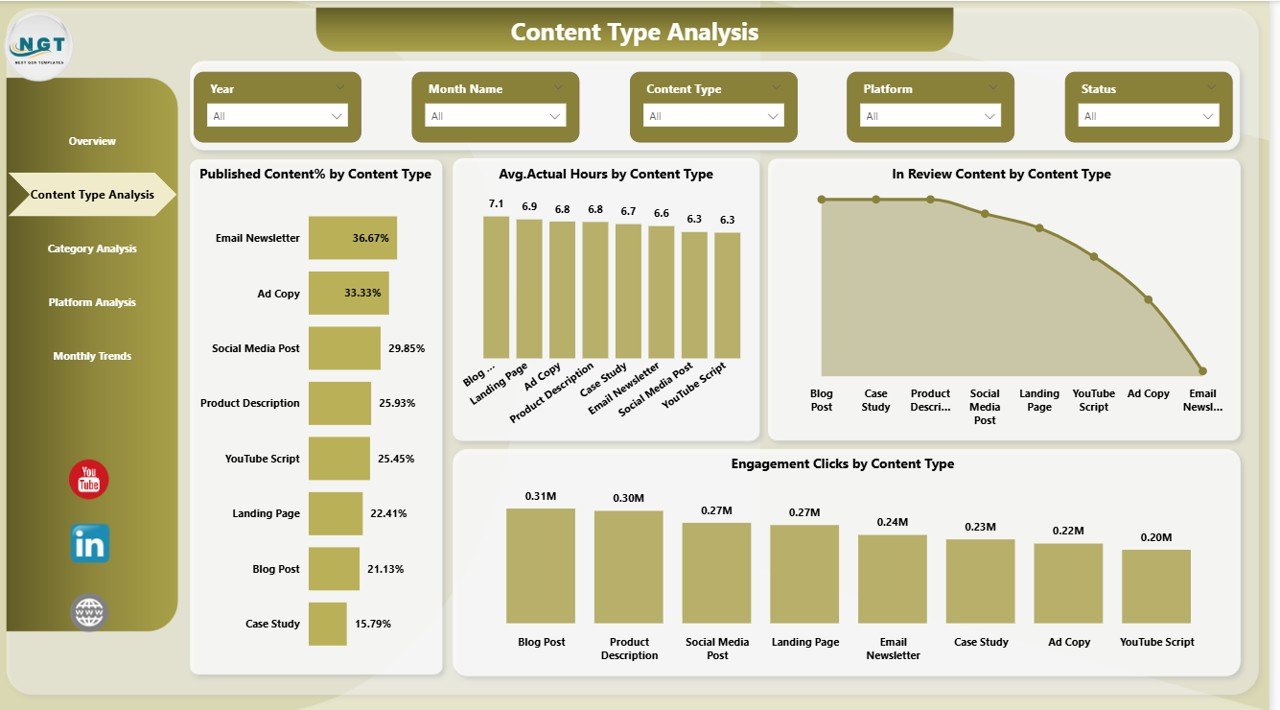
2️⃣ Content Type Analysis
Evaluate how blogs, videos, social posts, and campaigns perform and identify high-ROI formats.
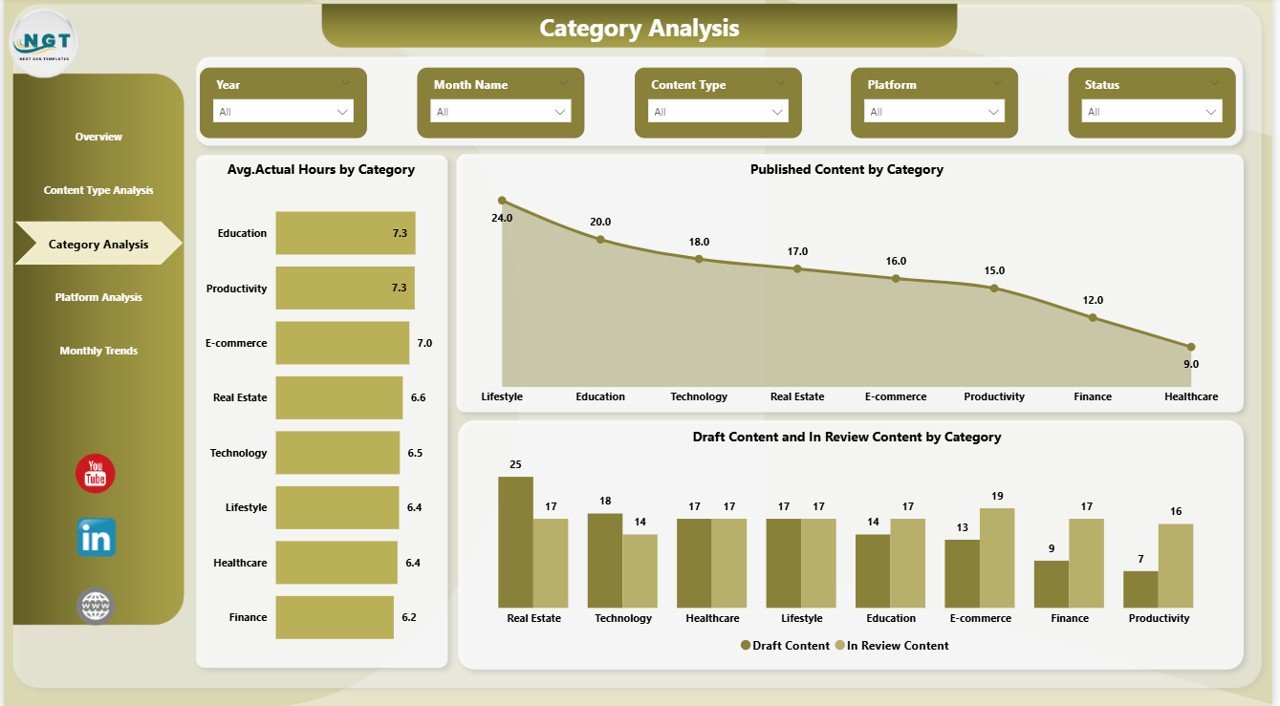
3️⃣ Category Analysis
Understand which content topics generate better engagement and optimize editorial planning.
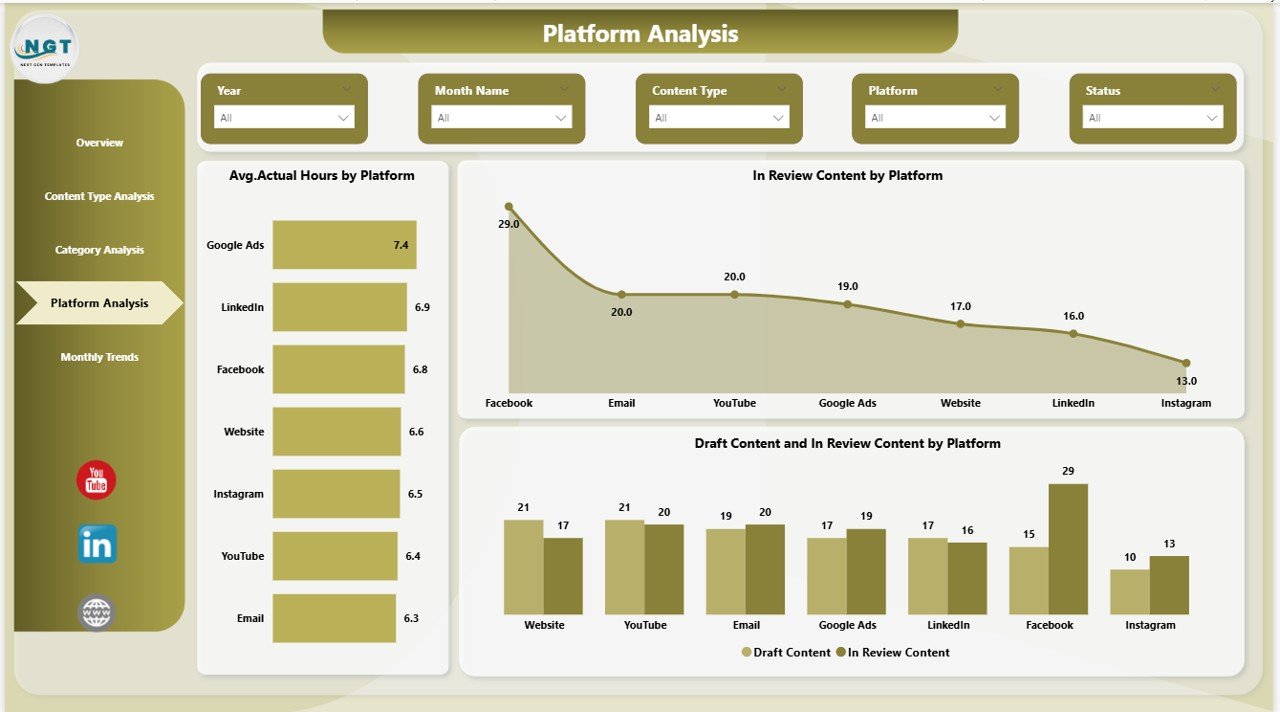
4️⃣ Platform Analysis
Compare performance across platforms like websites, LinkedIn, YouTube, and newsletters.
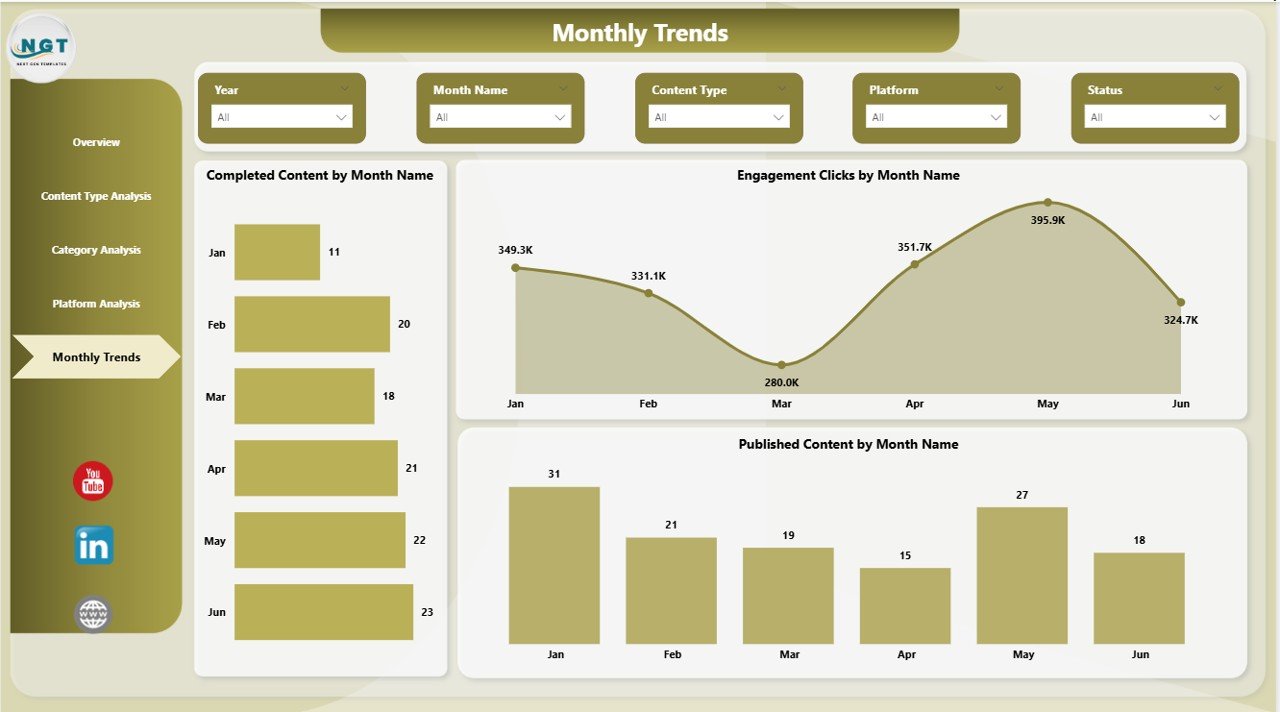
5️⃣ Monthly Trends Page
Track growth patterns, publishing consistency, and engagement trends over time.
Together, these pages provide a 360-degree view of your content operations.
⚙️ How to Use the Copywriting & Content Creation Dashboard in Power BI
Using this dashboard is simple and beginner-friendly:
1️⃣ Import your content tracking data into Power BI.
2️⃣ Refresh the dashboard to update visuals automatically.
3️⃣ Use slicers to filter by category, platform, or content type.
4️⃣ Review overview KPIs daily for quick insights.
5️⃣ Analyze monthly trends to improve long-term strategy.
Within minutes, you can turn complex data into clear business decisions.
🎯 Who Can Benefit from This Copywriting & Content Creation Dashboard in Power BI
This dashboard is ideal for:
✅ Content writers and editorial teams managing publishing workflows
✅ Marketing managers tracking campaign performance
✅ Digital marketing agencies handling multiple clients
✅ Social media managers analyzing platform engagement
✅ Business owners measuring marketing ROI
✅ Content strategists planning data-driven editorial calendars
If your organization produces content regularly, this dashboard becomes an essential performance tool.
The biggest advantage of this solution is clarity. Instead of spending hours preparing reports, teams instantly identify bottlenecks, improve productivity, and optimize publishing strategies.
By combining engagement analytics, productivity tracking, and workflow monitoring into one intelligent system, the dashboard helps organizations shift from manual reporting to smart decision-making.
In today’s competitive digital environment, businesses that measure content performance accurately gain a powerful advantage. The Copywriting & Content Creation Dashboard in Power BI empowers teams to work smarter, publish better content, and achieve consistent growth through data-driven insights.
Click here to read the Detailed blog post
Watch the step-by-step video tutorial:


