In today’s fast-moving manufacturing industry, industrial tools and fasteners companies must track operational performance accurately to stay competitive. Production efficiency, quality control, inventory management, and delivery performance directly impact profitability. However, many organizations still rely on manual spreadsheets and disconnected reports, making performance monitoring slow and inefficient.
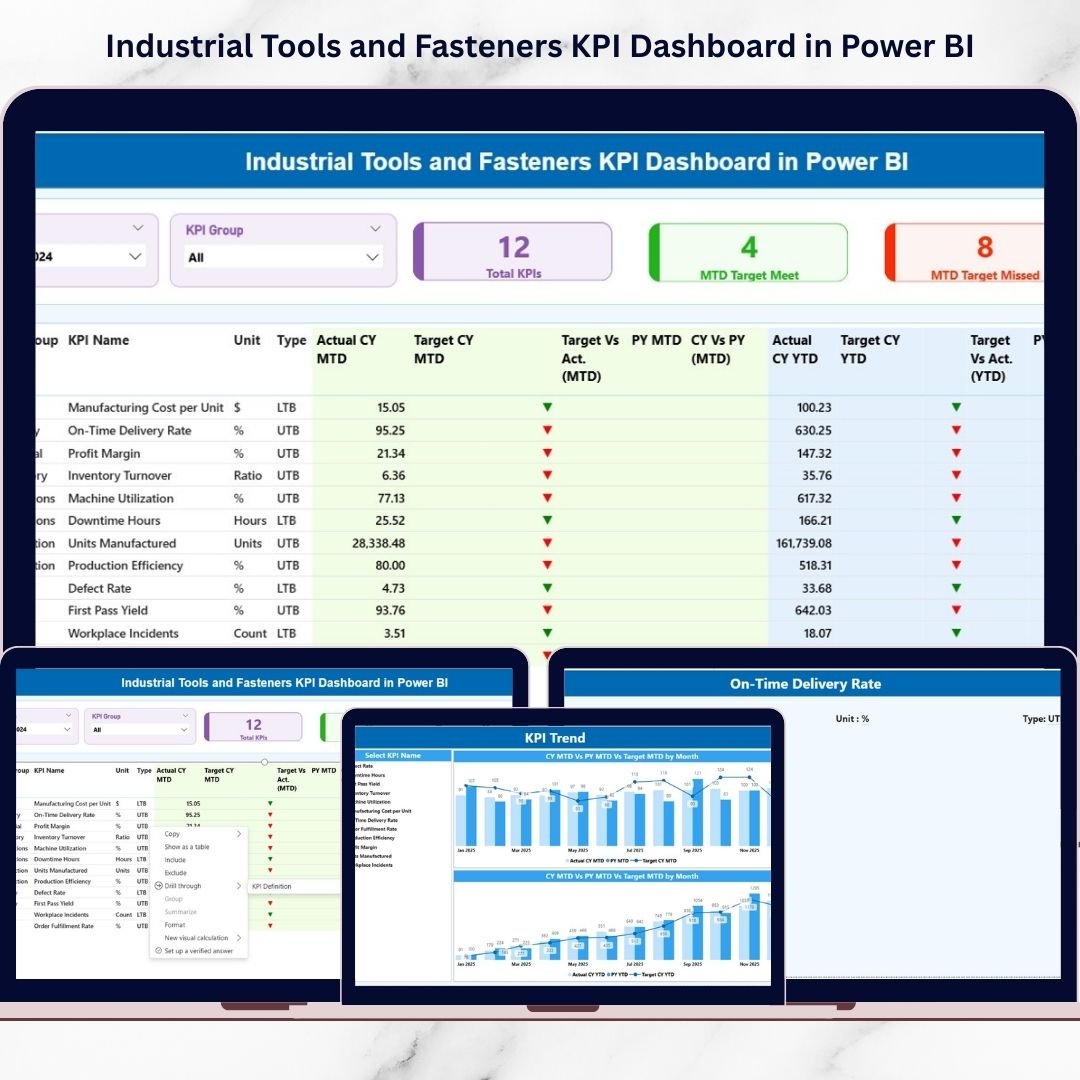
The Industrial Tools and Fasteners KPI Dashboard in Power BI is a powerful, ready-to-use analytics solution designed to transform complex operational data into clear and actionable insights. Built using Microsoft Power BI with an Excel data source, this dashboard enables manufacturers to monitor Key Performance Indicators (KPIs) in real time through interactive visuals and automated performance tracking.
Instead of spending hours compiling reports, managers can instantly evaluate performance, compare targets vs actual results, and identify improvement opportunities — all from one centralized dashboard.
Whether you are managing production lines, monitoring operational efficiency, or improving decision-making, this dashboard helps organizations move from reactive reporting to proactive performance management.
✨ Key Feature of Industrial Tools and Fasteners KPI Dashboard in Power BI
✅ Interactive Power BI dashboard with dynamic slicers
✅ Automated MTD and YTD performance tracking
✅ Target vs Actual comparison with visual indicators
✅ Previous Year vs Current Year performance analysis
✅ KPI trend analysis using combo charts
✅ Drill-through KPI definition page for deeper insights
✅ Excel-based data input for easy updates
✅ Department and KPI group performance monitoring
✅ Conditional formatting indicators for instant status visibility
✅ Fully customizable KPI structure
These features allow decision-makers to quickly understand performance health and act faster.
📦 What’s Inside the Industrial Tools and Fasteners KPI Dashboard in Power BI
This ready-to-use solution includes three powerful analytical pages:
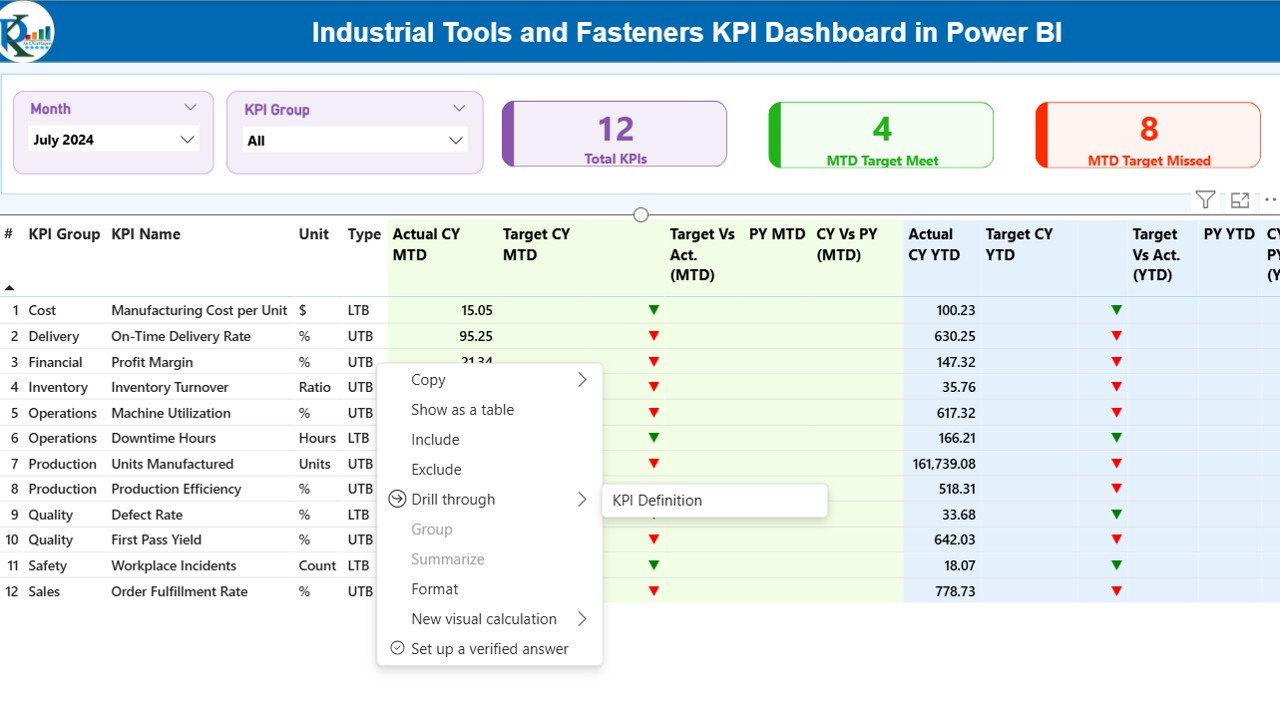
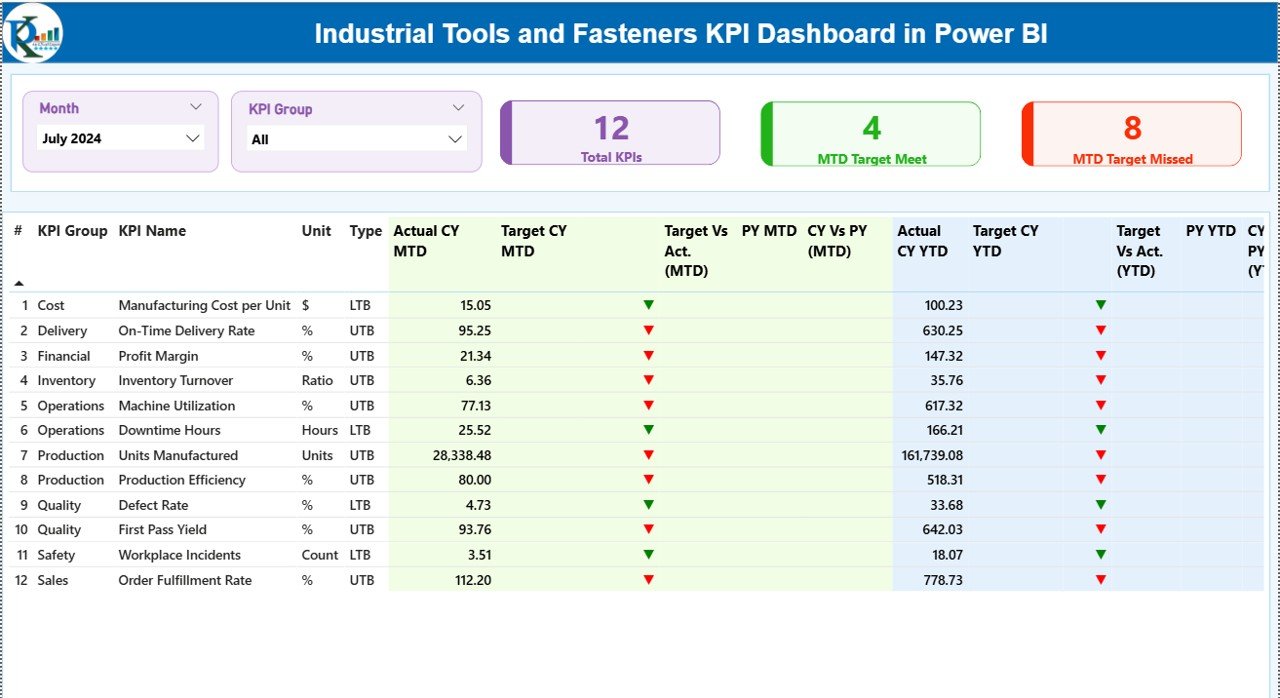
1️⃣ Summary Page – Performance Control Center
Provides a complete KPI overview with performance cards showing Total KPIs, Target Met, and Target Missed metrics along with a detailed KPI table.
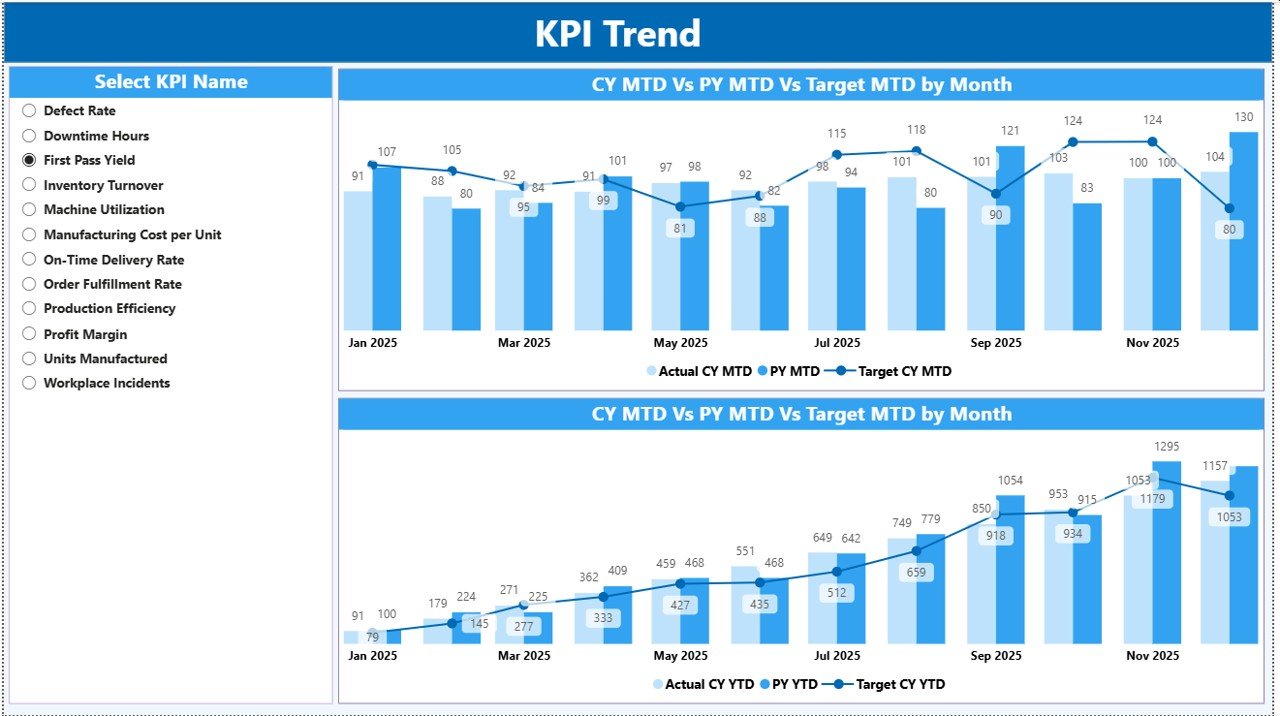
2️⃣ KPI Trend Page – Performance Behavior Analysis
Visual combo charts compare Actual vs Target and Current Year vs Previous Year trends to identify improvement patterns.
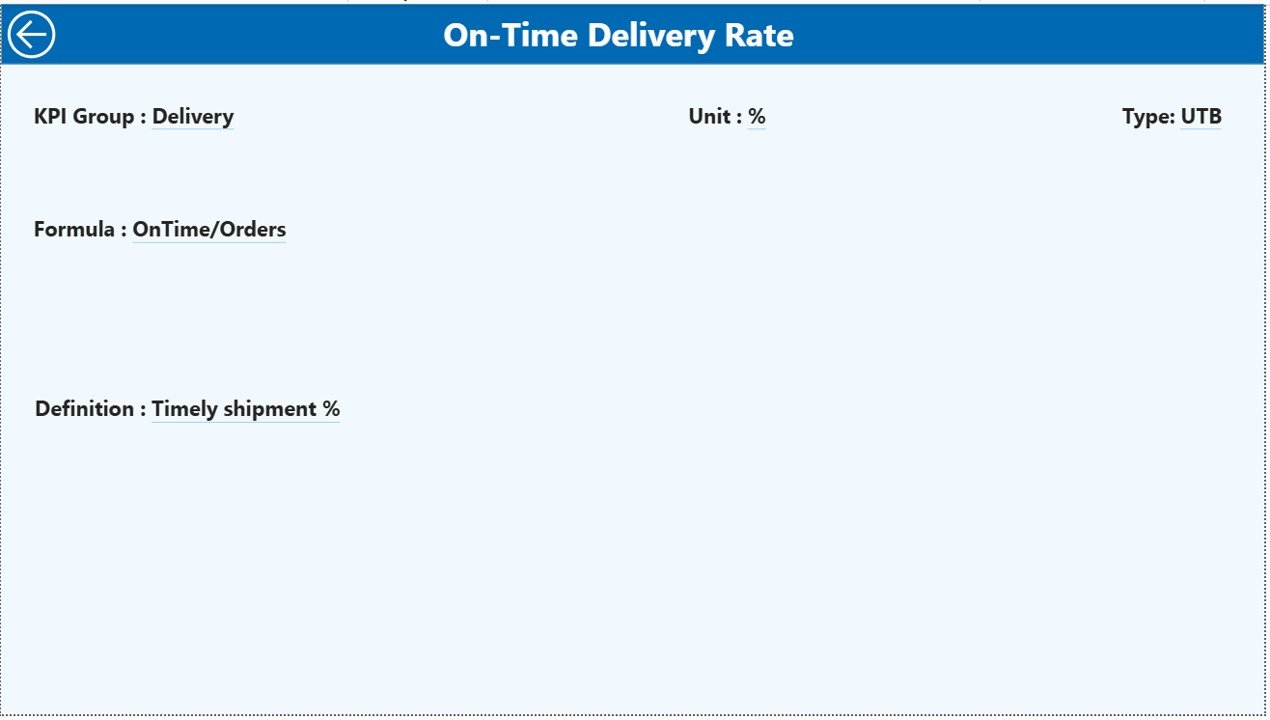
3️⃣ KPI Definition Page – Drill-Through Intelligence
Displays KPI formulas, definitions, and measurement logic, helping teams understand performance calculations clearly.
Additionally, the dashboard connects to structured Excel sheets:
-
Input_Actual (Actual KPI values)
-
Input_Target (Performance targets)
-
KPI Definition Sheet (KPI setup)
Simply update Excel data and refresh Power BI.
⚙️ How to Use the Industrial Tools and Fasteners KPI Dashboard in Power BI
Using this dashboard is simple and requires no advanced Power BI expertise:
-
Enter KPI actual values in the Excel Input_Actual sheet.
-
Update targets in the Input_Target sheet.
-
Define KPIs in the KPI Definition sheet.
-
Open Power BI and click Refresh.
-
Use slicers to analyze KPIs by month or group.
Within seconds, the dashboard automatically updates all visuals and performance indicators.
🎯 Who Can Benefit from This Industrial Tools and Fasteners KPI Dashboard in Power BI
This dashboard is ideal for professionals across manufacturing operations:
👨🏭 Production Managers monitoring efficiency
🏭 Plant Supervisors tracking daily performance
📊 Operations Heads improving productivity
✅ Quality Managers analyzing defect trends
🚚 Supply Chain Teams managing delivery KPIs
👔 Senior Executives reviewing strategic performance
Because of its intuitive design, both technical and non-technical users can easily analyze data.
Organizations using KPI dashboards gain faster insights, improved accountability, and smarter operational planning. By combining Excel flexibility with Power BI visualization power, this dashboard becomes a central performance management system for modern manufacturing environments.
If your organization wants to eliminate manual reporting, improve transparency, and make data-driven decisions confidently, this dashboard provides the perfect solution.
Click here to read the Detailed blog post
Watch the step-by-step video tutorial:


