Managing performance in glass manufacturing is not easy. Production losses, quality defects, energy inefficiencies, and operational delays can quickly impact profitability. Without a structured monitoring system, teams often rely on scattered reports and manual tracking, making decision-making slow and inefficient.
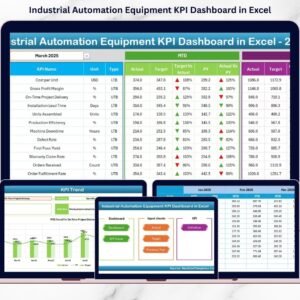
The Glassware Production KPI Dashboard in Excel is designed to solve this problem by providing a powerful, ready-to-use performance management solution. This professionally built Excel dashboard helps glassware manufacturers monitor critical production KPIs in one centralized and interactive environment.
Instead of analyzing raw spreadsheets, managers can instantly visualize performance through automated calculations, dynamic charts, and intelligent comparisons. Whether you want to track production efficiency, quality performance, or operational costs, this dashboard transforms complex manufacturing data into clear and actionable insights.
Built using Microsoft Excel, the dashboard requires no expensive software or technical expertise. Simply enter your data and let automation handle the analysis.
🚀 Key Features of Glassware Production KPI Dashboard in Excel
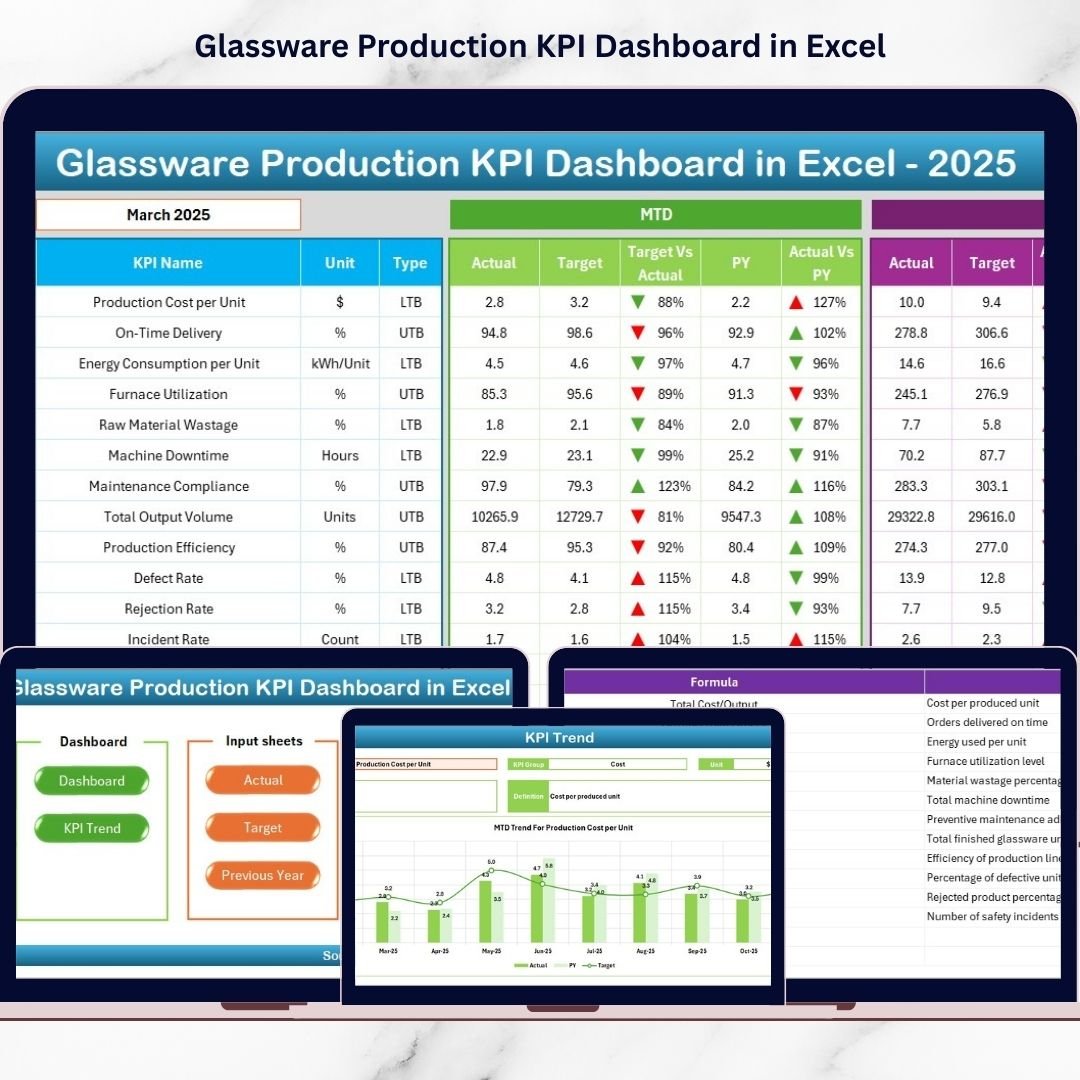
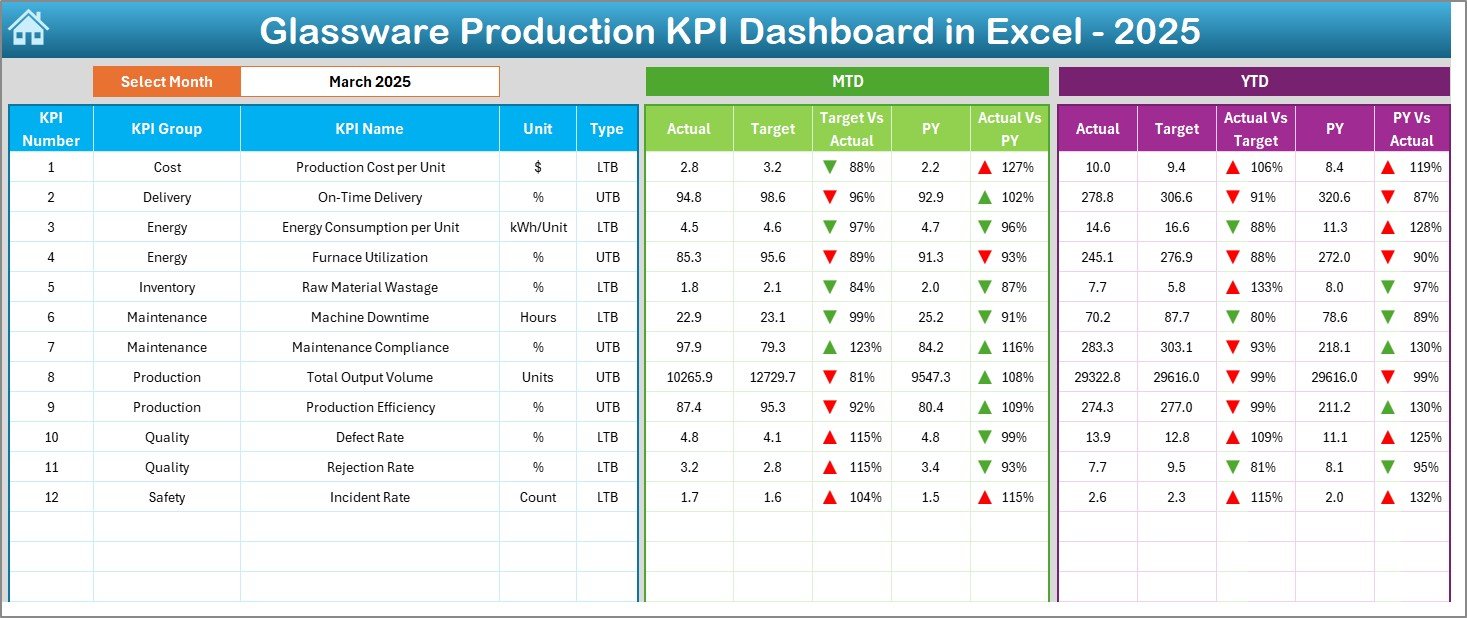
✅ Interactive Dashboard with dynamic month selection
✅ Automatic MTD & YTD performance calculations
✅ Target vs Actual and Previous Year comparisons
✅ Visual indicators with up/down performance arrows
✅ KPI trend analysis with automated charts
✅ Structured sheets for organized data management
✅ Easy navigation with summary index page
✅ Fully customizable KPIs and targets
✅ Beginner-friendly design with professional analytics
📦 What’s Inside the Glassware Production KPI Dashboard in Excel
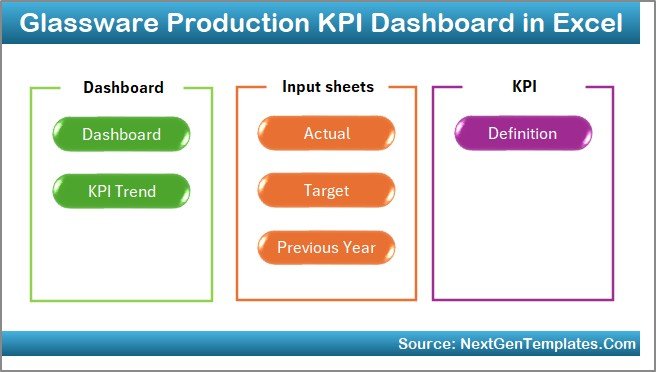
This dashboard includes 7 professionally structured worksheets that together create a complete KPI monitoring system:
-
Summary Page: Navigation hub for quick access to all sections.
-
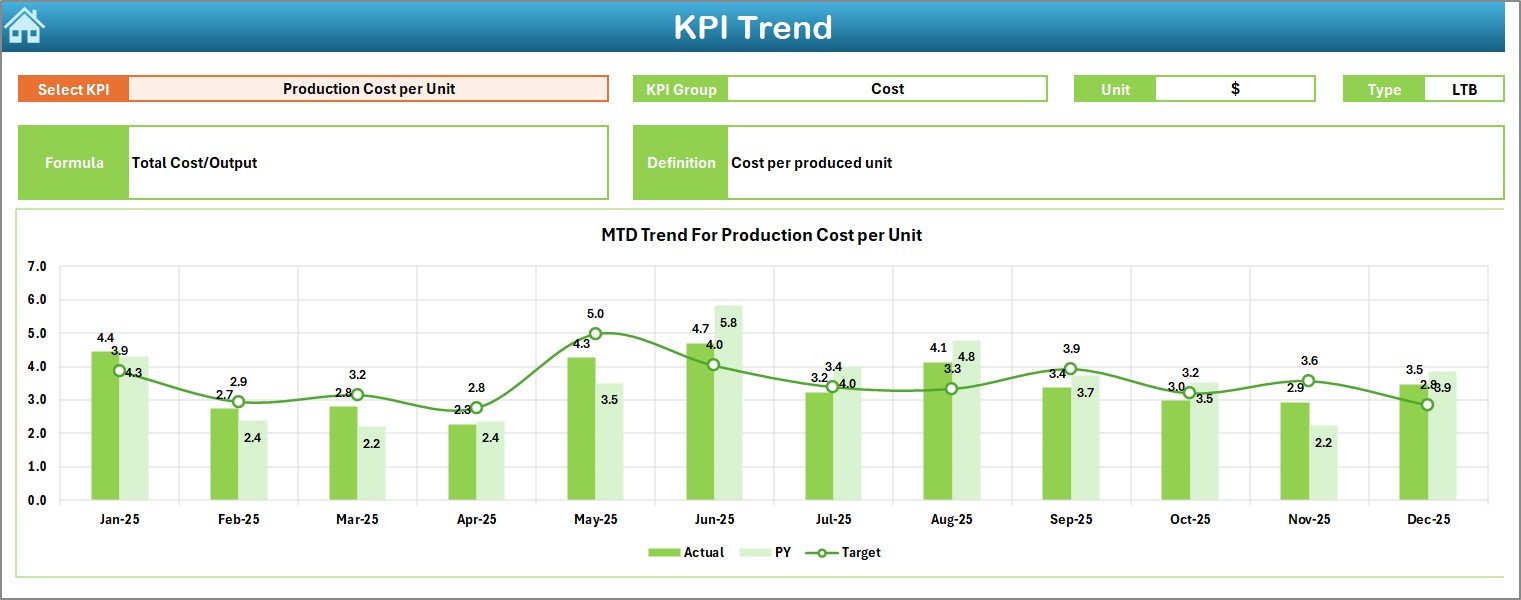
Dashboard Sheet: Main analytics view showing KPI performance visually.
-
Trend Sheet: Detailed KPI trend analysis with comparisons.
-
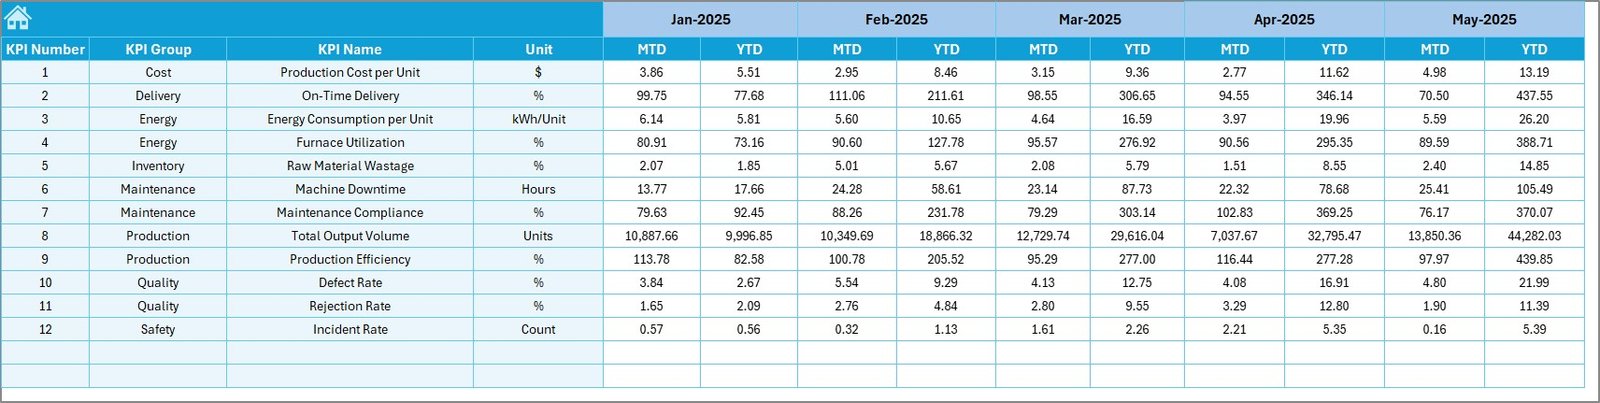
Actual Numbers Sheet: Simple data entry area for operational results.
-
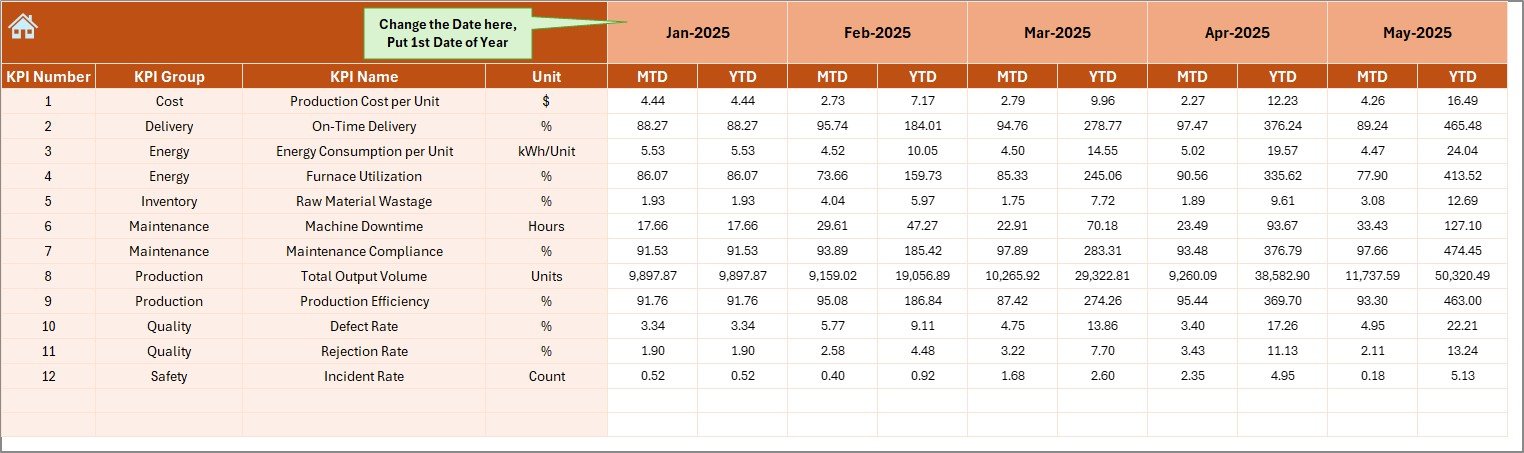
Target Sheet: Define monthly and yearly performance goals.
-
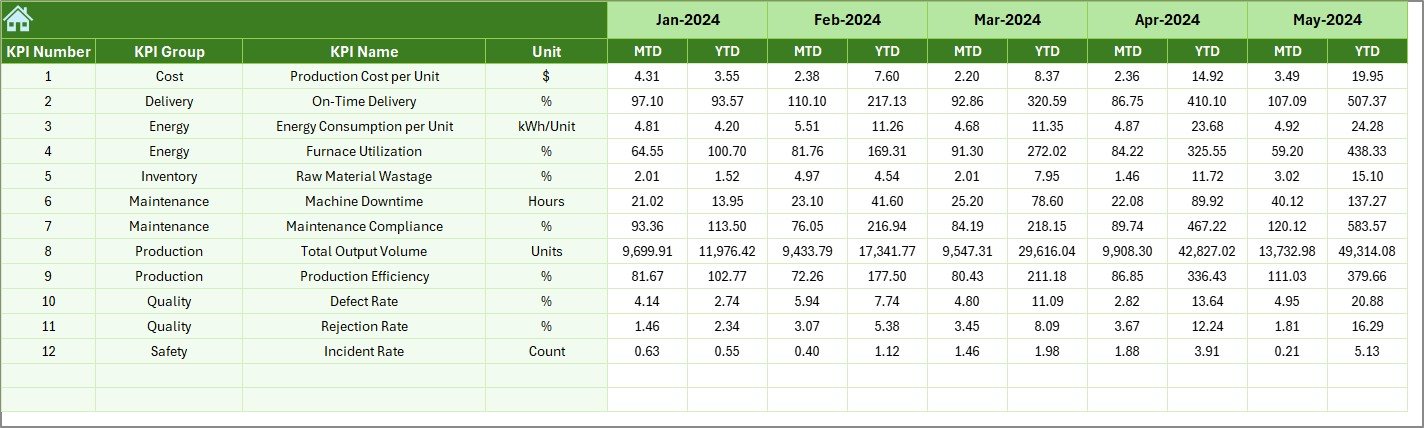
Previous Year Sheet: Historical performance comparison.
-
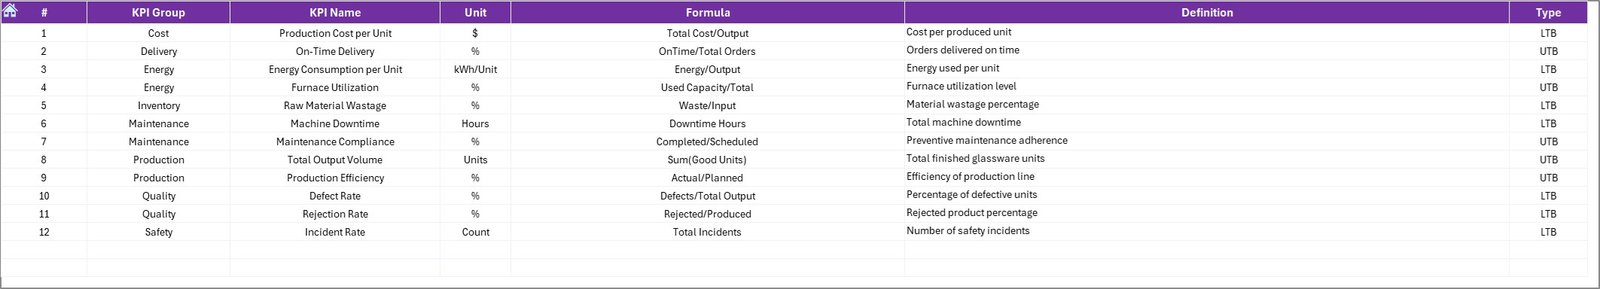
KPI Definition Sheet: Standardized KPI documentation and formulas.
Each sheet is logically designed to ensure smooth workflow and accurate reporting.
⚙️ How to Use the Glassware Production KPI Dashboard in Excel
Using the dashboard is simple and requires no advanced Excel skills:
1️⃣ Enter KPI details in the KPI Definition Sheet.
2️⃣ Add monthly targets in the Target Sheet.
3️⃣ Input production data in the Actual Numbers Sheet.
4️⃣ Enter previous year values for comparison.
5️⃣ Select the desired month from the dashboard dropdown.
6️⃣ Instantly analyze results through charts and indicators.
Once data is entered, the dashboard automatically updates all calculations and visuals.
👥 Who Can Benefit from This Glassware Production KPI Dashboard in Excel
This dashboard is ideal for professionals involved in manufacturing operations, including:
-
Plant Managers monitoring production efficiency
-
Production Supervisors tracking daily performance
-
Quality Control Managers analyzing defect trends
-
Operations Heads improving productivity
-
Business Analysts generating performance insights
-
Manufacturing Consultants supporting optimization projects
Because of its user-friendly structure, both technical and non-technical users can operate it confidently.
This dashboard helps organizations move from reactive reporting to proactive performance management. By combining automation, visualization, and structured KPI tracking, companies gain better operational visibility and faster decision-making capabilities.
Instead of spending hours preparing reports, teams can focus on improving production outcomes, reducing waste, and achieving operational excellence.
Click here to read the Detailed blog post
Watch the step-by-step video tutorial: