Student Exchange Programs Dashboard have become an essential part of modern education, enabling universities and institutions to provide global exposure, cultural learning, and international academic collaboration. However, managing exchange initiatives involves multiple variables such as program types, funding sources, travel expenses, regional participation, scholarships, and student satisfaction levels. When institutions rely on scattered spreadsheets and manual reporting, analyzing performance becomes slow and inefficient.
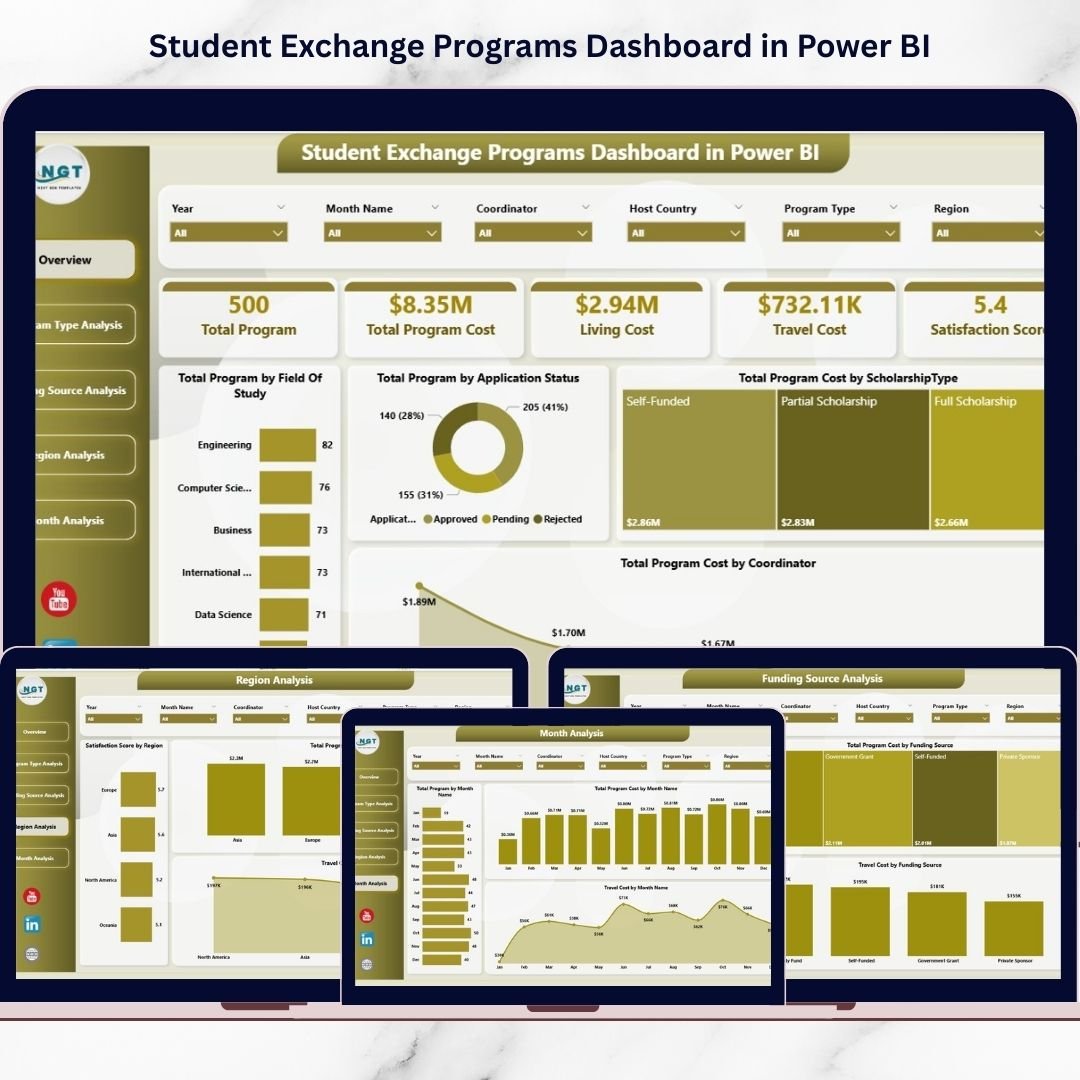
The Student Exchange Programs Dashboard in Power BI is a ready-to-use, interactive analytics solution designed to simplify exchange program management through powerful data visualization. Instead of reviewing multiple reports, administrators and decision-makers can monitor program performance from a centralized dashboard that transforms complex datasets into clear visual insights.
Built using Power BI’s advanced analytics capabilities, this dashboard enables institutions to analyze costs, track participation trends, evaluate funding effectiveness, and measure student satisfaction in real time. With dynamic slicers, automated visuals, and structured reporting pages, users can instantly explore insights and make smarter strategic decisions.
Whether managing study-abroad initiatives, scholarship programs, or international partnerships, this dashboard helps organizations shift from manual reporting to intelligent, data-driven program management.
🚀 Key Feature of Student Exchange Programs Dashboard in Power BI
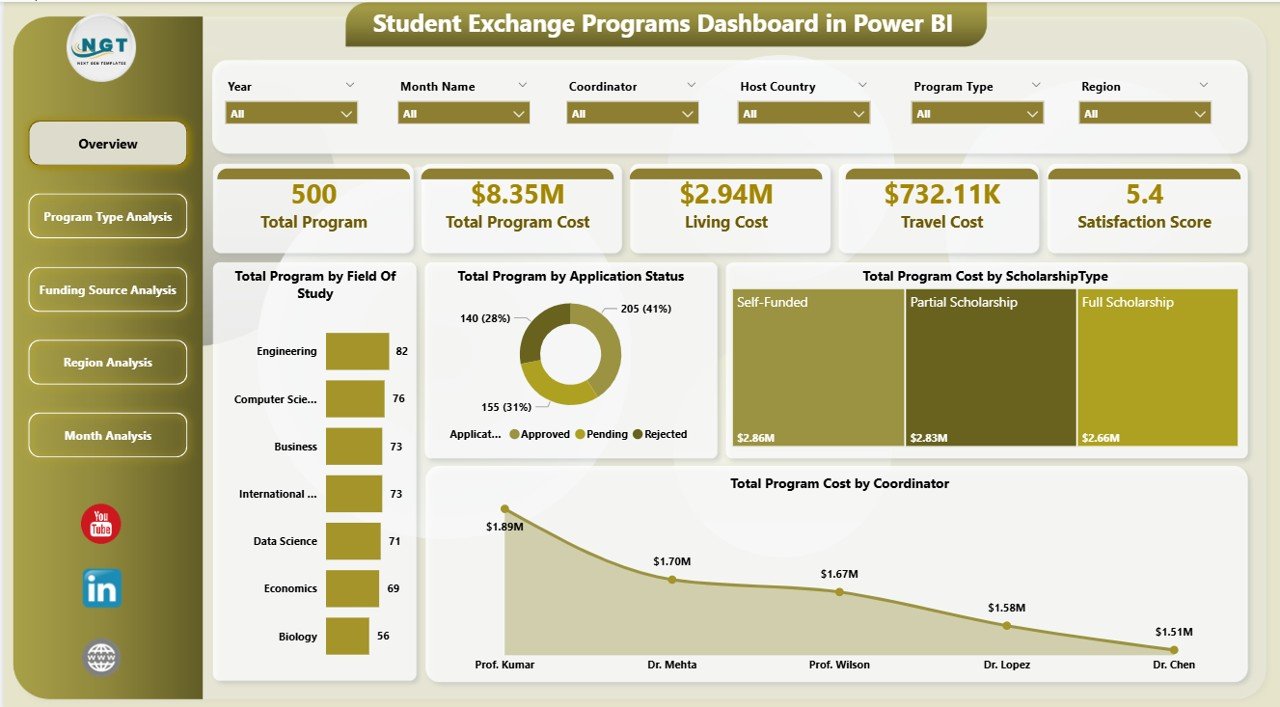
📊 Interactive Program Overview Dashboard
Monitor overall exchange program performance using KPI cards and dynamic visual summaries.
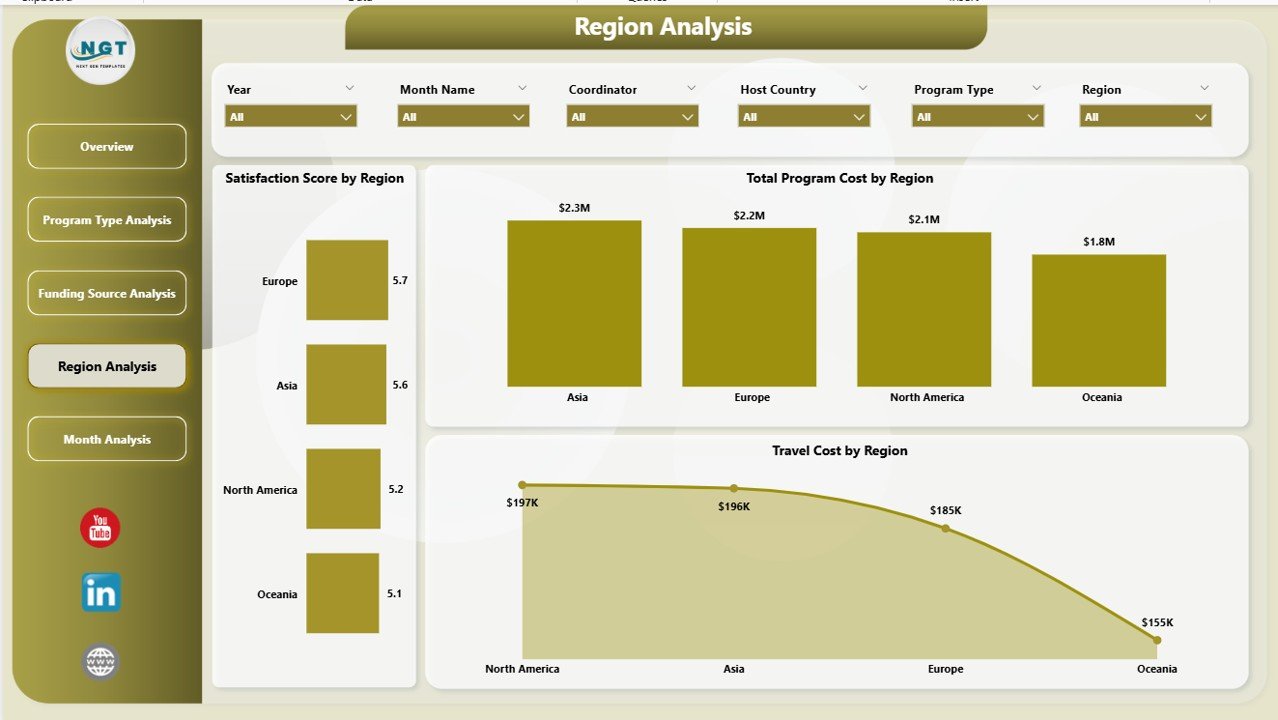
🌍 Regional Performance Analysis
Compare participation, satisfaction, and costs across global regions effortlessly.
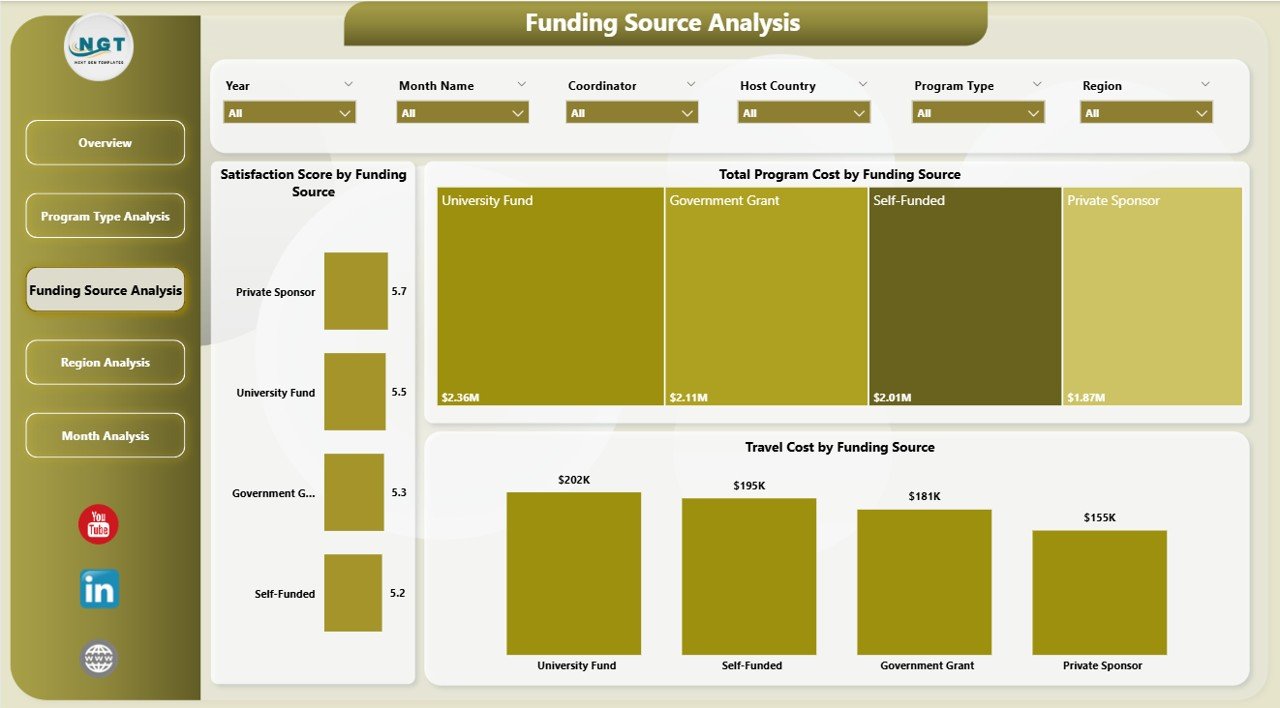
💰 Funding Source Performance Tracking
Analyze how funding partners influence program outcomes and financial efficiency.
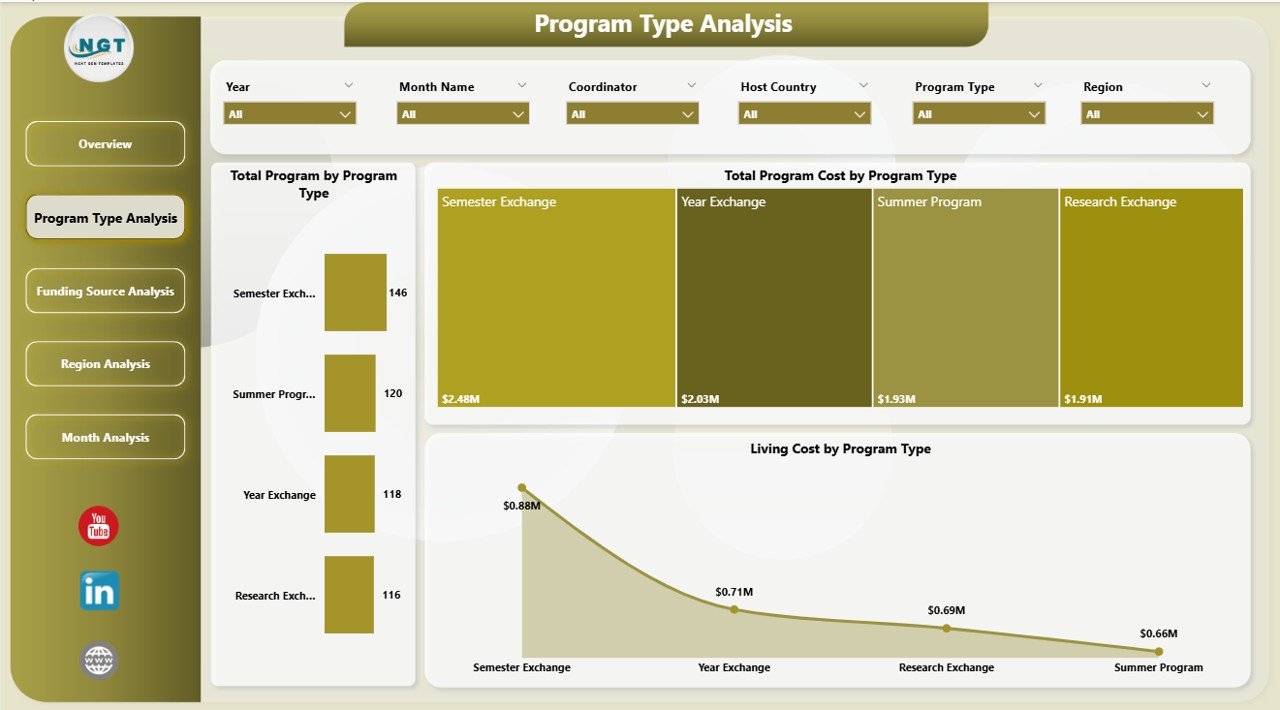
📈 Program Type Comparison
Evaluate which exchange formats deliver better value and engagement.
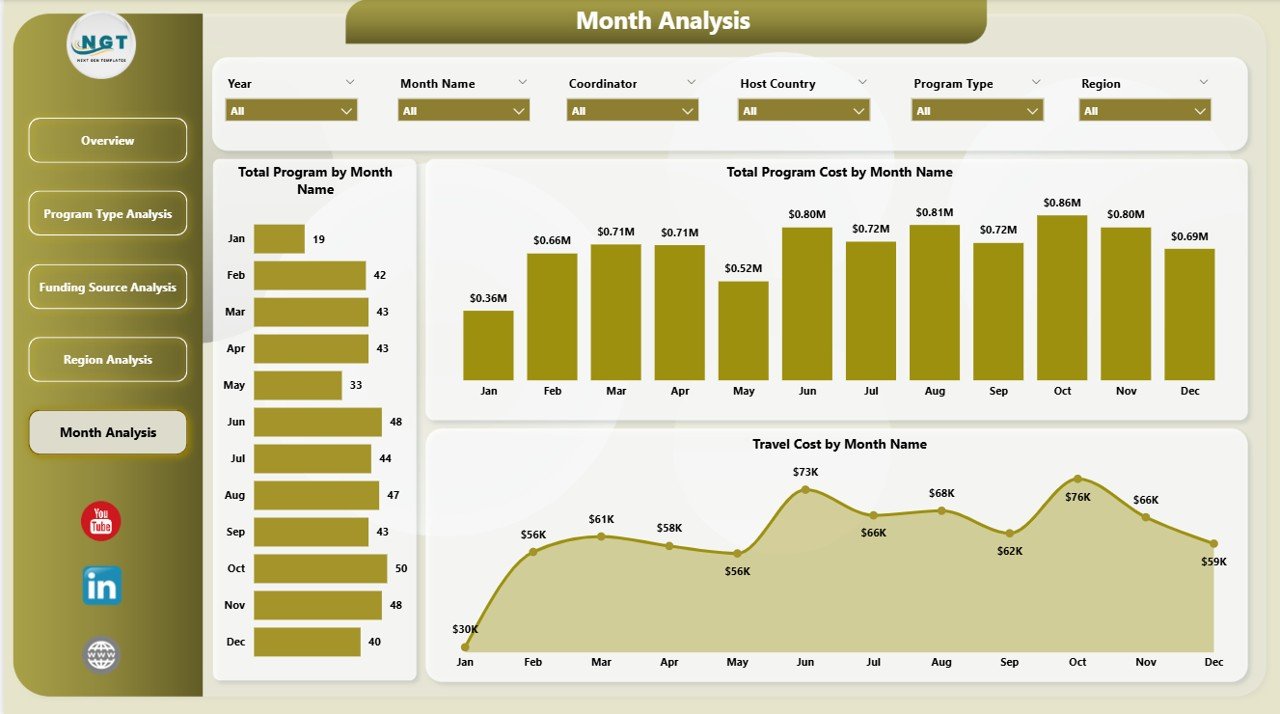
📅 Monthly Trend Monitoring
Track participation and cost patterns across different academic periods.
🔎 Dynamic Slicers & Filters
Instantly filter dashboards by category, region, or program type without manual calculations.
⚡ Automated Data Visualization
Power BI updates visuals automatically when filters or datasets change.
📊 Professional Multi-Page Analytics Structure
Access five analytical pages designed for deep performance insights.
📦 What’s Inside the Student Exchange Programs Dashboard in Power BI
This ready-to-use dashboard provides a complete analytics framework:
✅ Five Interactive Dashboard Pages
-
Overview Dashboard
-
Program Type Analysis
-
Funding Source Analysis
-
Region Analysis
-
Month Analysis
✅ Prebuilt KPI Cards & Visual Charts
✅ Interactive Slicers for Dynamic Filtering
✅ Cost & Satisfaction Analytics
✅ Professional Education Analytics Layout
✅ Ready-to-Use Power BI Report File
Simply connect or update your data and start analyzing instantly.
🛠️ How to Use the Student Exchange Programs Dashboard in Power BI
The dashboard is designed for simplicity and fast adoption:
1️⃣ Import or connect exchange program data into Power BI.
2️⃣ Refresh datasets to update visuals automatically.
3️⃣ Use slicers to filter by region, funding source, or program type.
4️⃣ Navigate between analytical pages for deeper insights.
5️⃣ Review KPI cards and charts to evaluate performance.
6️⃣ Share insights securely with stakeholders.
Even non-technical users can analyze data easily thanks to Power BI’s intuitive interface.
👥 Who Can Benefit from This Student Exchange Programs Dashboard in Power BI
This dashboard is ideal for organizations managing international education programs:
🎓 Universities and Colleges
🌍 International Education Offices
📊 Exchange Program Coordinators
🏛 Government Education Departments
💼 Scholarship Organizations
✈ Study Abroad Agencies
👨💼 Institutional Leadership Teams
From small exchange initiatives to global mobility programs, this dashboard delivers complete performance visibility.
By implementing this dashboard, institutions centralize data, improve financial transparency, enhance student experiences, and accelerate decision-making. Instead of spending hours preparing reports, teams gain instant insights that support strategic planning and program success.
### Click here to read the Detailed blog post
Visit our YouTube channel to learn step-by-step video tutorials:
👉 https://youtube.com/@PKAnExcelExpert