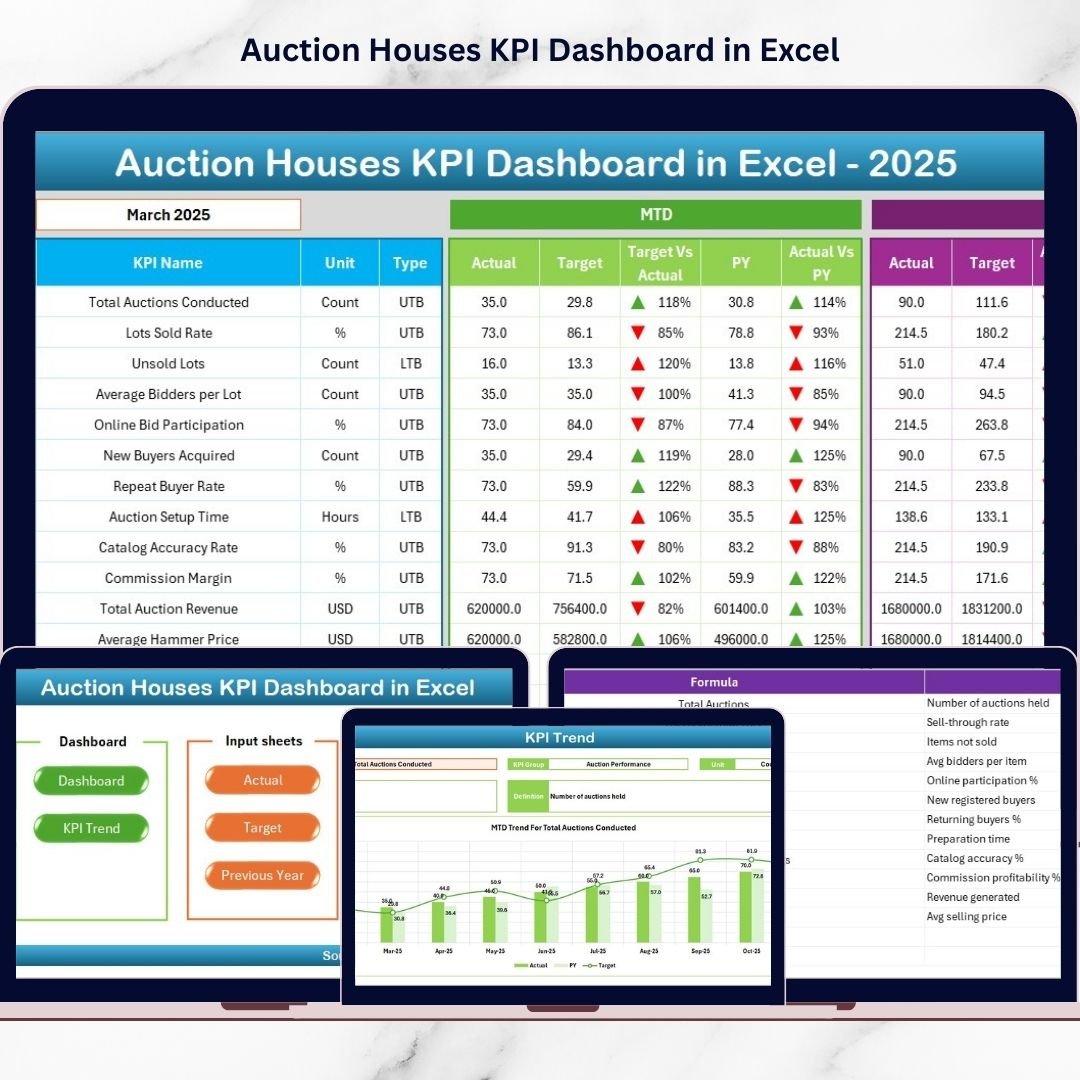
Running successful auctions requires precision, speed, and data-driven decisions. Auction houses manage consignors, bidders, inventory valuation, commissions, marketing expenses, and final hammer prices — all at the same time. However, many auction businesses still rely on disconnected spreadsheets and manual reports, making performance tracking slow and error-prone.What if you could monitor your entire auction performance from one powerful Excel dashboard?The Auction Houses KPI Dashboard in Excel is a ready-to-use, professionally designed analytical solution that transforms raw auction data into clear, actionable insights. Instead of spending hours preparing reports, you can instantly track revenue, bidder participation, profitability, and operational efficiency in one centralized system.
Built entirely in Excel, this dashboard provides automation, flexibility, and powerful visualization without requiring expensive software or advanced technical skills.
Whether you manage art auctions, antique sales, estate auctions, or online bidding platforms, this dashboard helps you monitor performance, compare targets, and make smarter business decisions faster.
🚀 Key Feature of Auction Houses KPI Dashboard in Excel
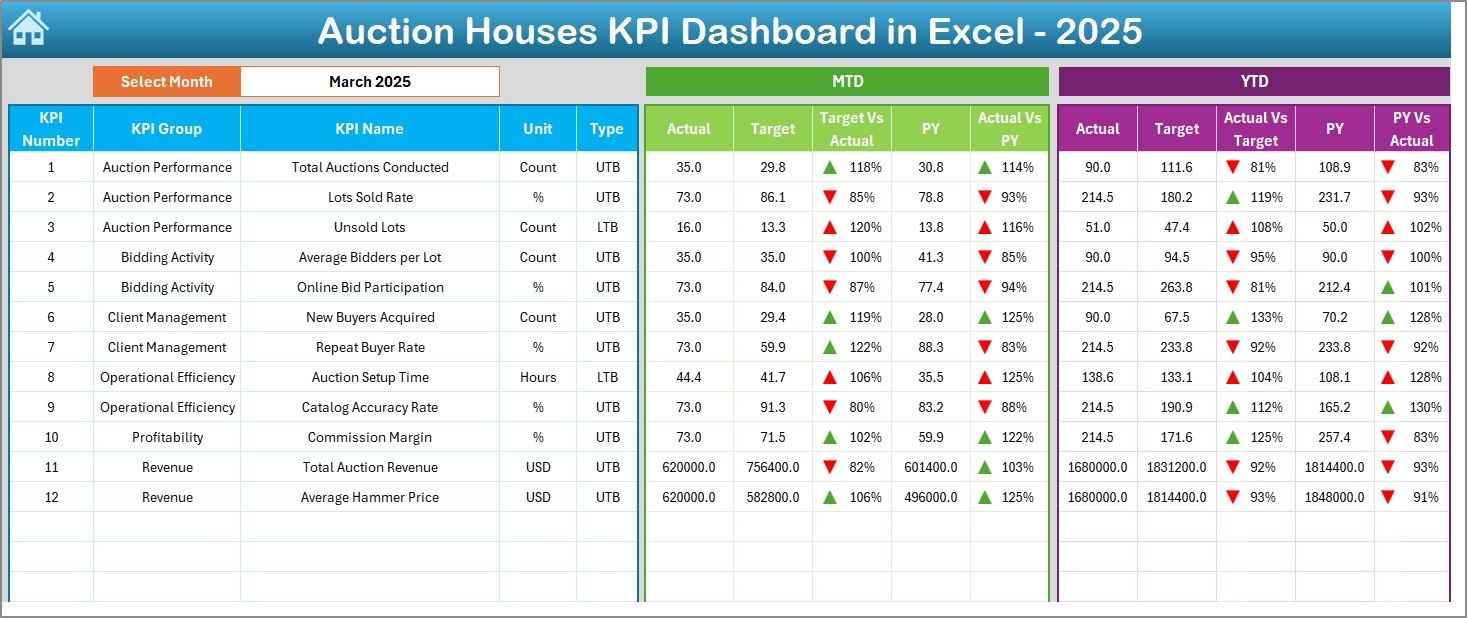
✅ Dynamic Month Selection – Instantly switch reporting periods using dropdown filters.
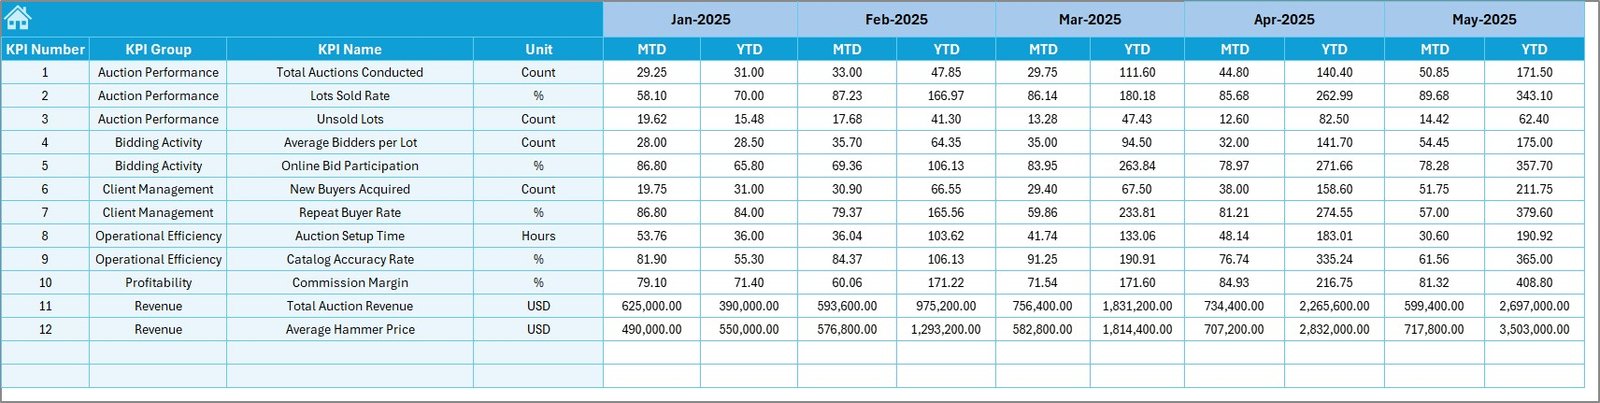
✅ Automated KPI Tracking – Monitor MTD and YTD performance automatically.
✅ Target vs Actual Comparison – Quickly identify performance gaps.
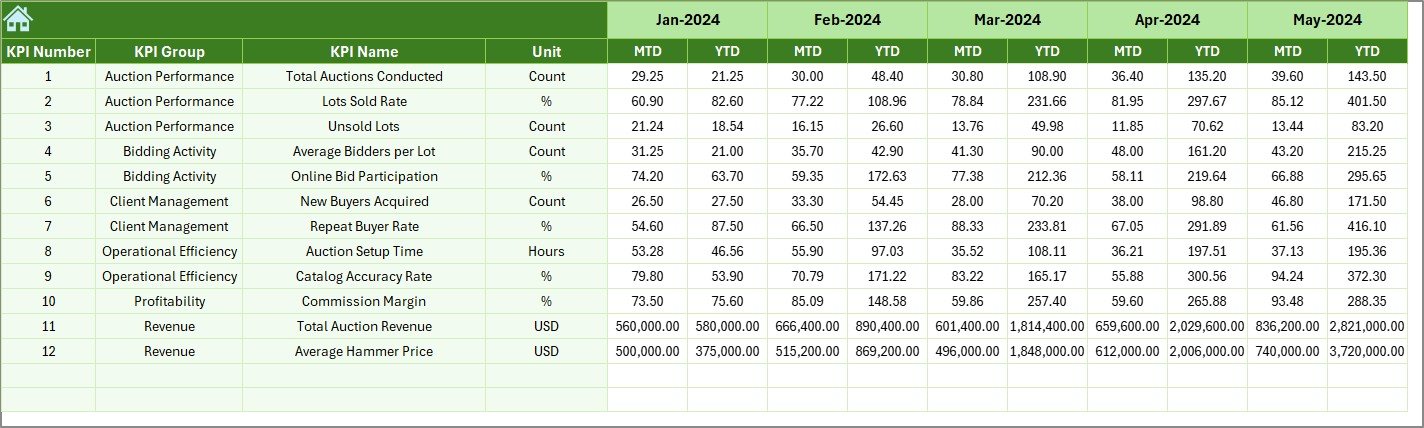
✅ Previous Year Analysis – Measure growth using historical comparisons.
✅ Visual Performance Indicators – Up/down arrows and color signals simplify analysis.
✅ Pivot-Table Driven Analytics – Reliable and scalable reporting structure.
✅ Centralized Reporting – All auction KPIs available in one dashboard view.
✅ Fully Customizable Framework – Add or modify KPIs anytime.
📦 What’s Inside the Auction Houses KPI Dashboard in Excel
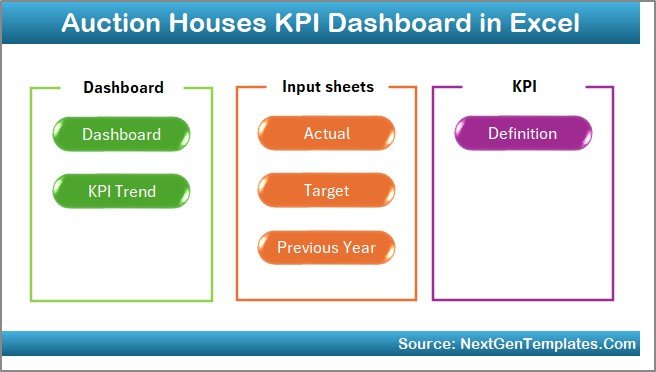
This product includes 7 structured worksheets, each designed for specific analysis:
-
Summary Page – Navigation hub with quick access buttons.
-
Dashboard Sheet – Main KPI overview with performance comparisons.
-
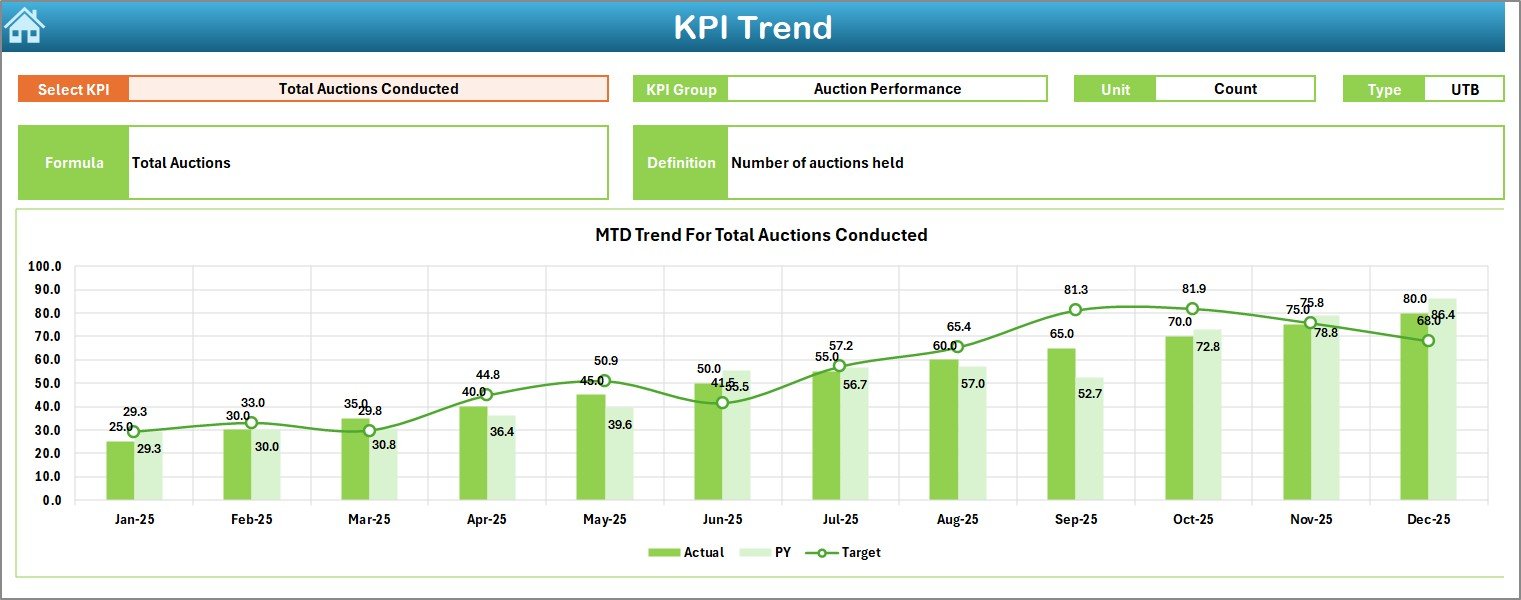
KPI Trend Sheet – Monthly performance tracking with dynamic charts.
-
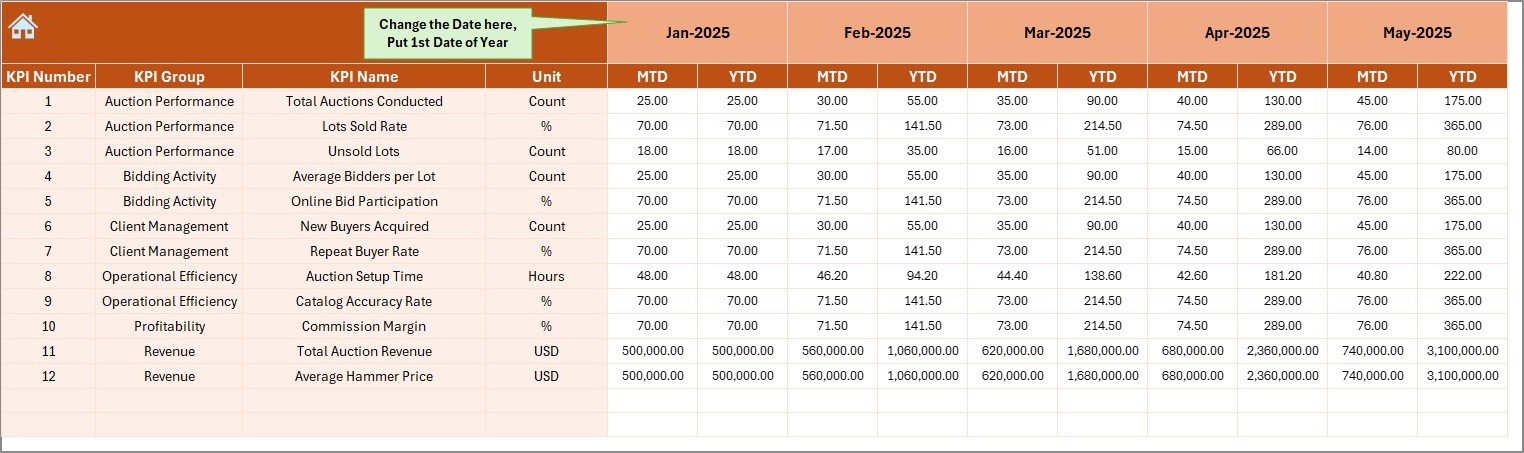
Actual Numbers Input Sheet – Easy monthly data entry system.
-
Target Sheet – Define goals and performance benchmarks.
-
Previous Year Sheet – Historical data comparison for growth analysis.
-
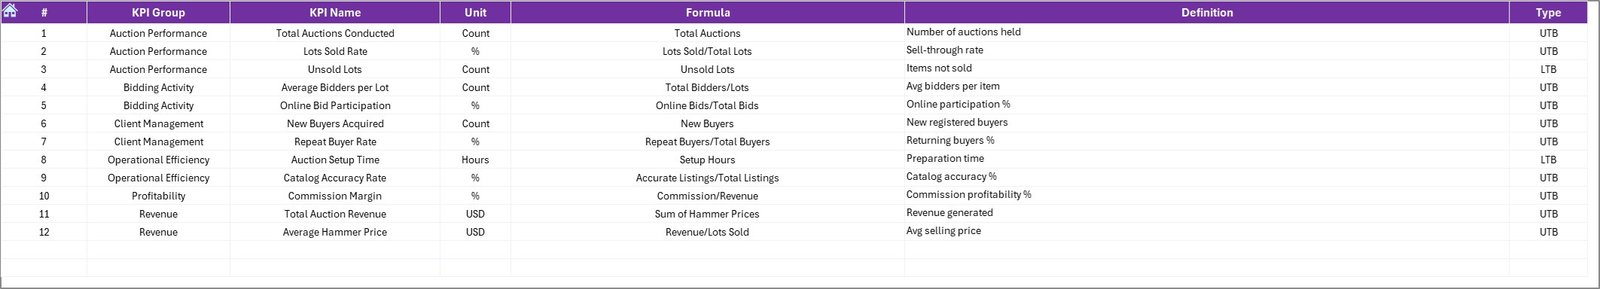
KPI Definition Sheet – KPI formulas, units, and definitions documentation.
Together, these sheets create a complete auction performance management system.
⚙️ How to Use the Auction Houses KPI Dashboard in Excel
Using the dashboard is simple and beginner-friendly:
1️⃣ Enter monthly KPI data in the Actual Numbers sheet.
2️⃣ Add performance targets in the Target sheet.
3️⃣ Store last year’s numbers for comparison.
4️⃣ Select a month from the dropdown menu.
5️⃣ Watch the dashboard update automatically.
Within seconds, you gain visual insights into revenue trends, bidder engagement, profitability, and operational efficiency.
No coding. No complex setup. Just structured reporting powered by Excel.
👥 Who Can Benefit from This Auction Houses KPI Dashboard in Excel
This dashboard is ideal for:
-
Auction House Owners
-
Auction Managers & Coordinators
-
Financial Analysts
-
Operations Teams
-
Art & Antique Auction Firms
-
Estate Sale Companies
-
Online Auction Platforms
-
Business Consultants managing auction clients
Organizations of any size can implement this dashboard quickly and start improving decision-making immediately.
By tracking KPIs consistently, auction businesses can optimize pricing strategies, improve bidder participation, reduce unsold inventory, and increase long-term profitability.
Why This Dashboard Matters
Instead of reacting to problems after auctions end, managers can identify trends early and take proactive action. The dashboard reduces reporting time, increases transparency, and provides clarity across operations.
In short, it turns auction data into strategic intelligence.
Click here to read the Detailed blog post
Watch the step-by-step video tutorial:


