That’s exactly why we created the Equipment Leasing Dashboard in Excel — a powerful, ready-to-use analytical solution designed to bring complete visibility to your equipment leasing operations.
This professional Excel dashboard transforms raw leasing data into clear, interactive insights using Pivot Tables, slicers, and dynamic charts. Consequently, your finance, operations, and procurement teams can monitor performance, detect risks, and make faster data-driven decisions.
Whether you manage a small equipment fleet or a large multi-region portfolio, this dashboard helps you stay in full control.
🔑 Key Feature of Equipment Leasing Dashboard in Excel
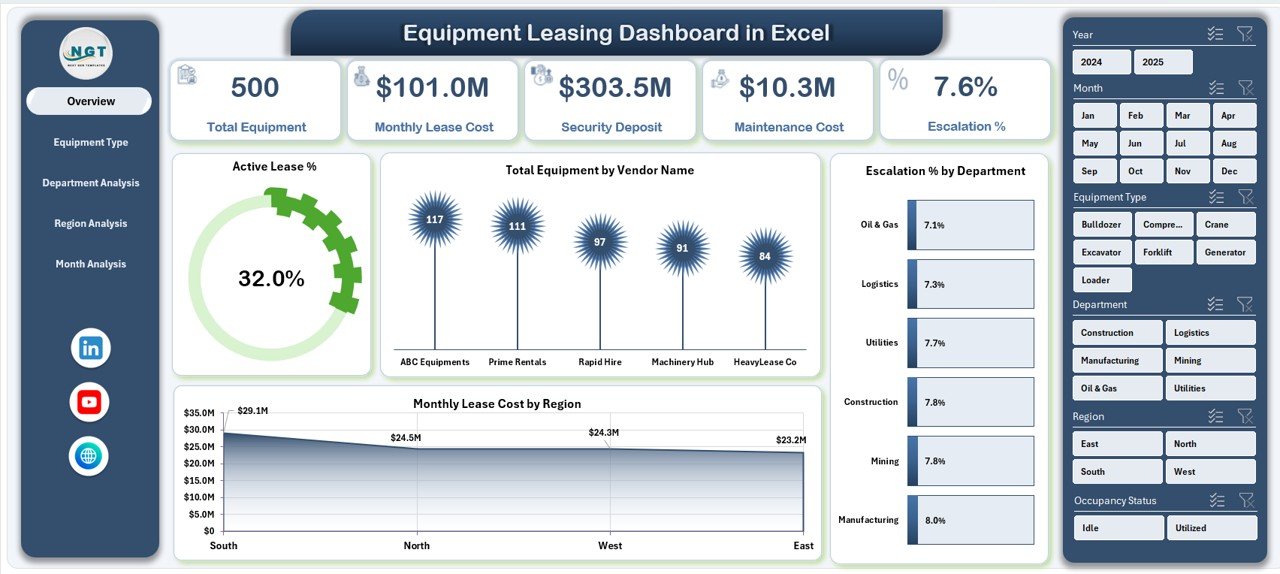
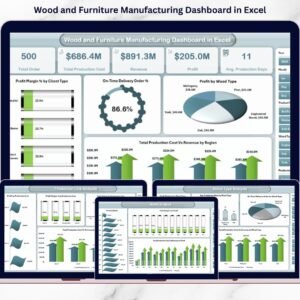
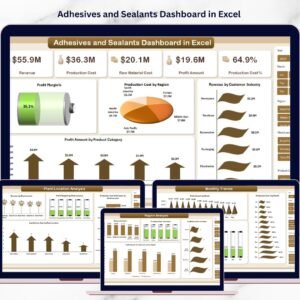
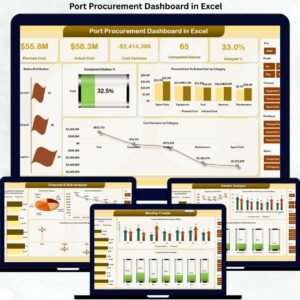
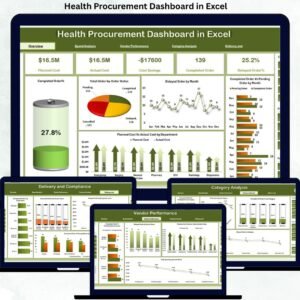
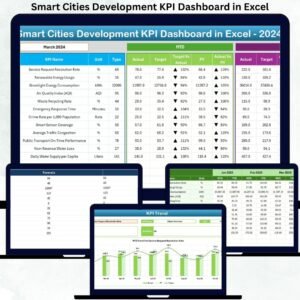
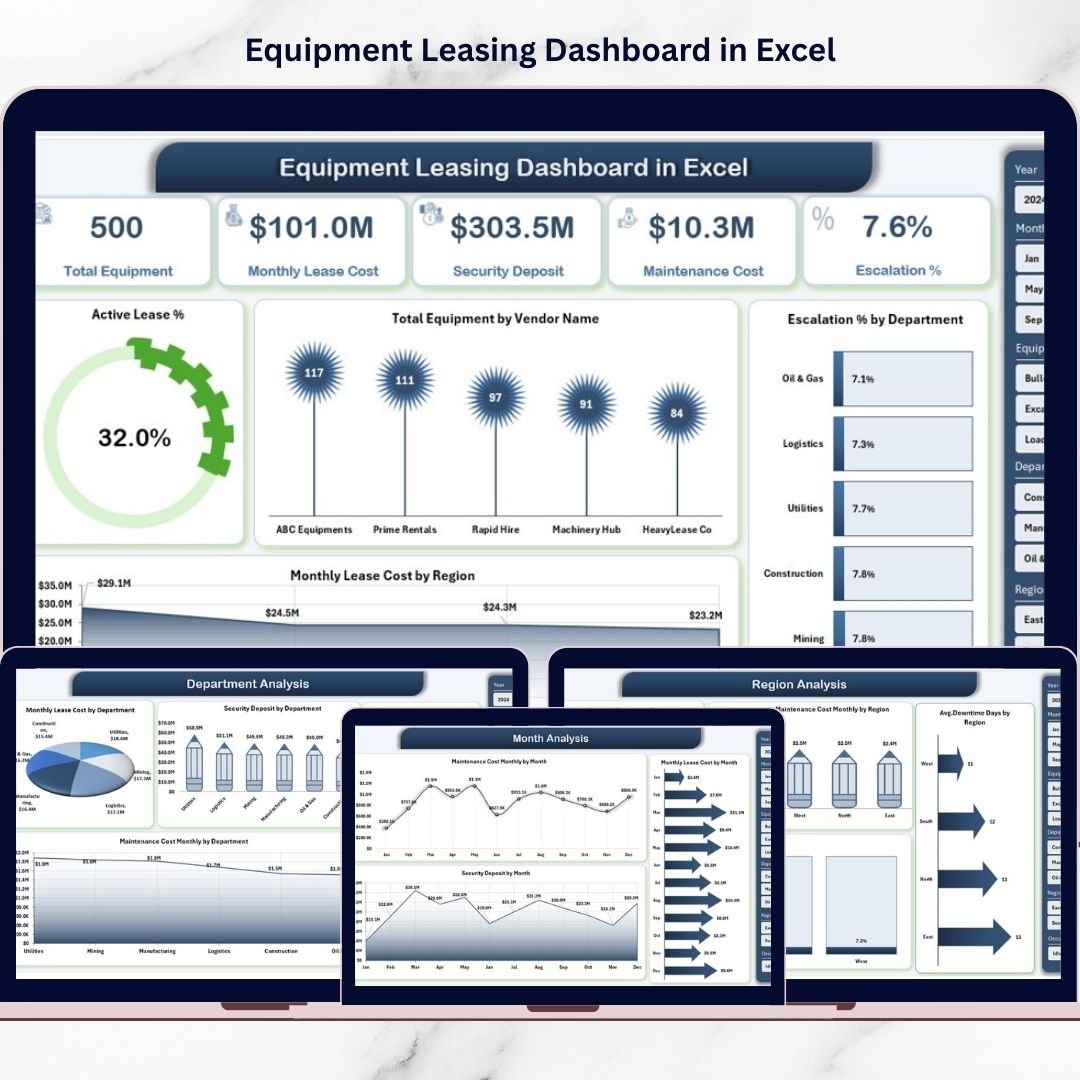
✨ Executive Overview Page
Get an instant snapshot of lease performance with KPI cards and dynamic visuals.
📊 Interactive Right-Side Slicers
Filter by vendor, department, region, and more for focused analysis.
🏭 Vendor Distribution Insights
Quickly identify vendor dependency and concentration risks.
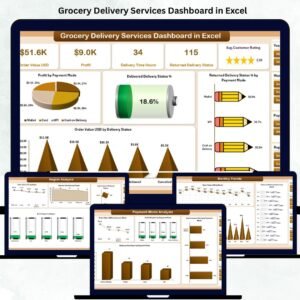
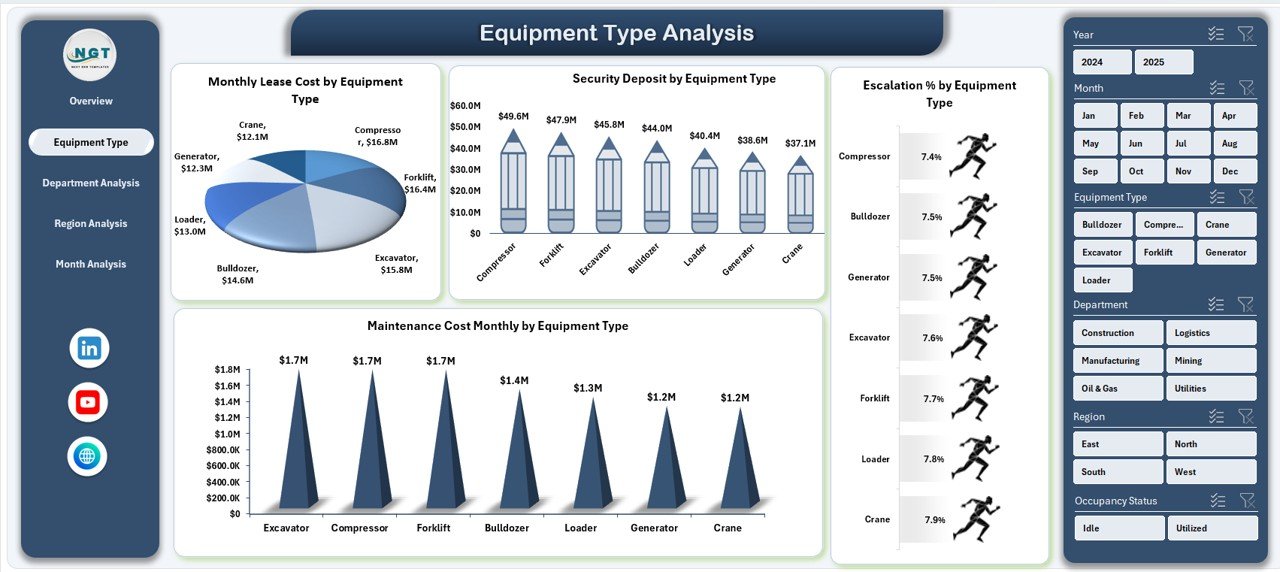
💰 Lease Cost Monitoring
Track monthly lease expenses across equipment types and regions.
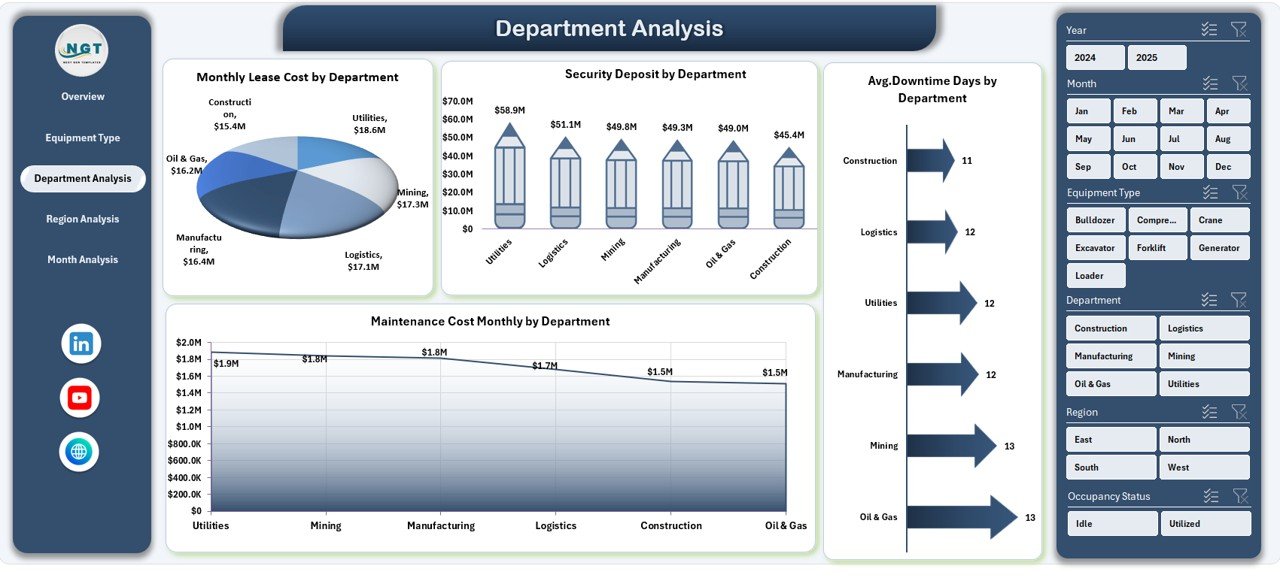
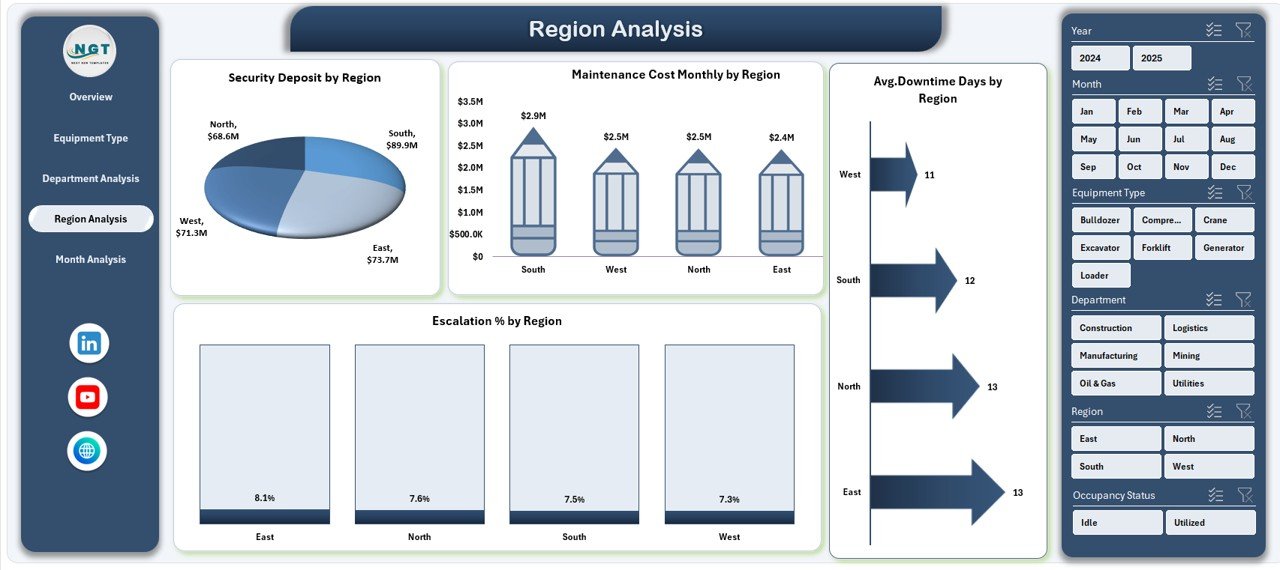
⏱ Downtime Performance Tracking
Monitor equipment reliability and detect operational issues early.
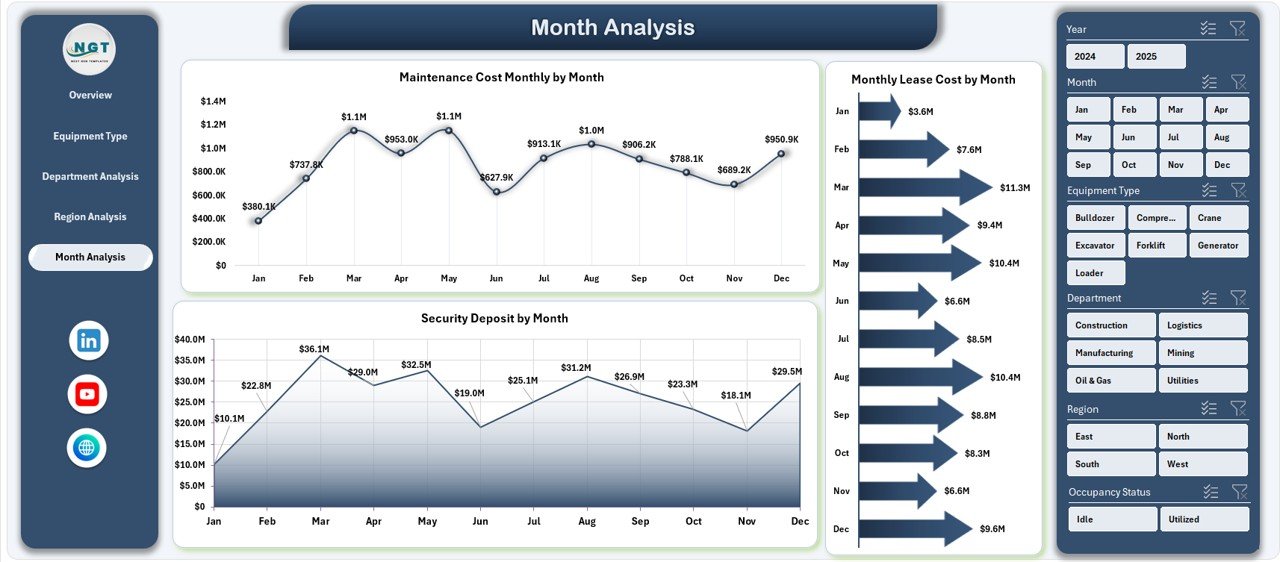
🛠 Maintenance Cost Analysis
Keep maintenance spending under control with clear visual trends.
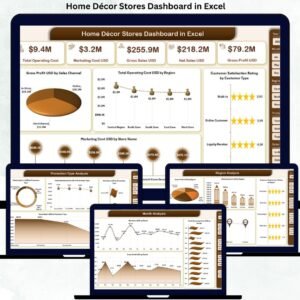
🌍 Regional Performance Comparison
Compare geographic performance to identify high-cost locations.
⚡ 100% Excel-Based Solution
Works seamlessly in Microsoft Excel — no advanced tools required.
📦 What’s Inside the Equipment Leasing Dashboard in Excel
This ready-to-use template includes everything you need for professional lease monitoring.
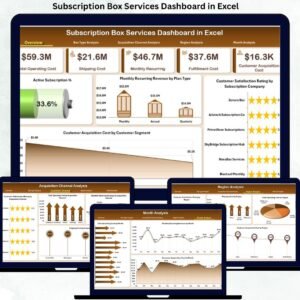
✔️ Interactive Dashboard (5 Analytical Pages)
✔️ Executive KPI Cards
✔️ Pivot-Driven Charts and Visuals
✔️ Dynamic Slicers for Filtering
✔️ Structured Data Sheet
✔️ Support Sheet for Calculations
✔️ Easy Monthly Update Framework
Everything is pre-built so you can start analyzing immediately.
🛠️ How to Use the Equipment Leasing Dashboard in Excel
Getting started is quick and beginner-friendly.
Step 1: Download and open the Excel file
Step 2: Update the Data Sheet with your equipment lease data
Step 3: Refresh Pivot Tables
Step 4: Use slicers to filter insights
Step 5: Review KPI cards and charts
Within minutes, you will have a complete equipment leasing command center.
🎯 Who Can Benefit from This Equipment Leasing Dashboard in Excel
This dashboard is ideal for organizations managing leased equipment.
✅ Finance Teams
✅ Operations Managers
✅ Procurement Teams
✅ Asset Management Teams
✅ Infrastructure Teams
✅ Senior Management
✅ Multi-location Businesses
If your organization wants tighter cost control and better asset visibility, this tool is essential.
Why This Dashboard Is a Must-Have
Unlike manual tracking methods, this dashboard provides:
✔️ Centralized lease visibility
✔️ Real-time KPI monitoring
✔️ Vendor performance tracking
✔️ Downtime analysis
✔️ Maintenance cost control
✔️ Faster executive reporting
As a result, your team shifts from reactive reporting to proactive equipment management.
### Click hare to read the Detailed blog post
📺 Visit our YouTube channel to learn step-by-step video tutorials
👉 Youtube.com/@PKAnExcelExpert