Great products don’t happen by accident.
They happen through measurement, discipline, and continuous improvement. 🚀📊
Many product teams invest heavily in innovation but struggle to track delivery speed, quality, and efficiency. As a result, projects slip, costs rise, and leadership lacks visibility.
Therefore, you need more than ideas.
You need structured performance intelligence.
The Product Development KPI Scorecard in Excel is a ready-to-use, dynamic performance tracking tool designed to help product managers, R&D teams, and business leaders monitor development KPIs in one centralized dashboard.
Instead of chasing scattered reports, you gain real-time clarity on progress, targets, and trends — all inside Excel.
Key Feature of Product Development KPI Scorecard in Excel 📈✨
This professional scorecard is built specifically for product development environments.
🚀 Month Selection Dropdown for flexible analysis
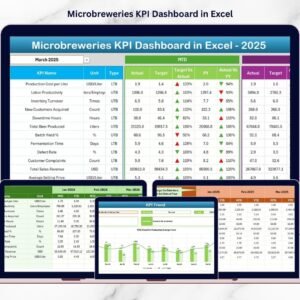
📊 MTD & YTD Performance Tracking
🎯 Actual vs Target Comparison
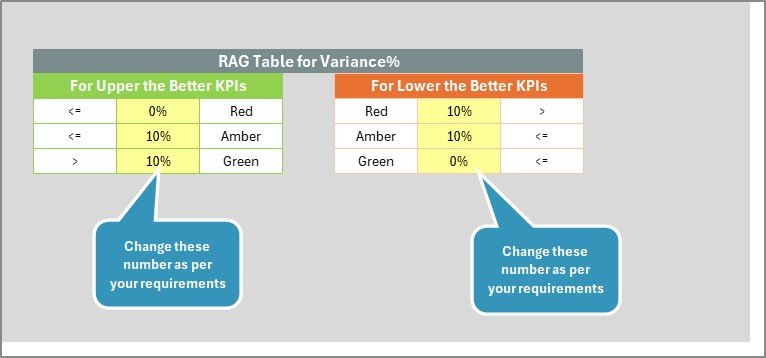
📉 Visual Conditional Formatting Indicators
📈 KPI Trend Charts (MTD & YTD)
📘 Structured KPI Definition Sheet
📂 Clean 4-Worksheet Architecture
⚙ Fully Customizable Excel Framework
Because it runs in Excel, your team can adapt KPIs easily without complex tools.
What’s Inside the Product Development KPI Scorecard in Excel 📁
This ready-to-use template includes 4 powerful worksheets, each designed to support performance monitoring.
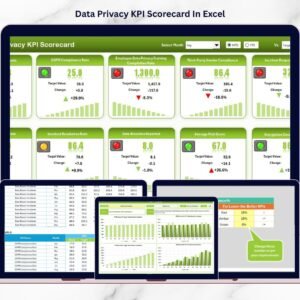
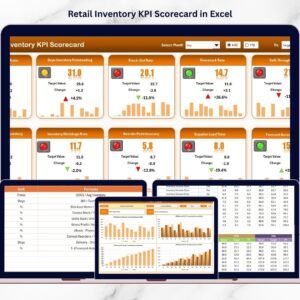
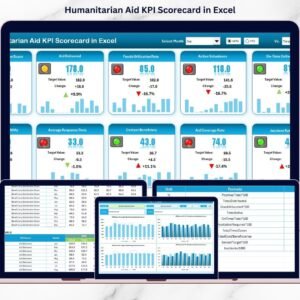
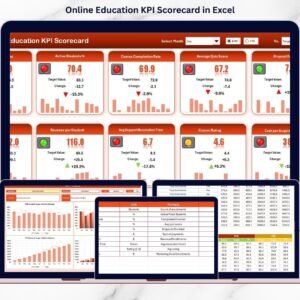
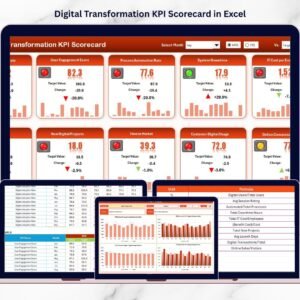
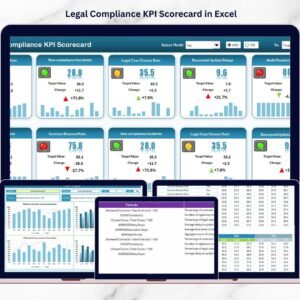
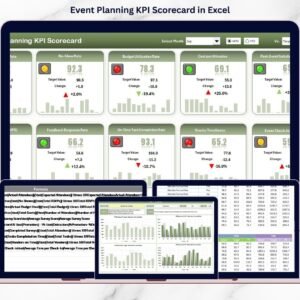
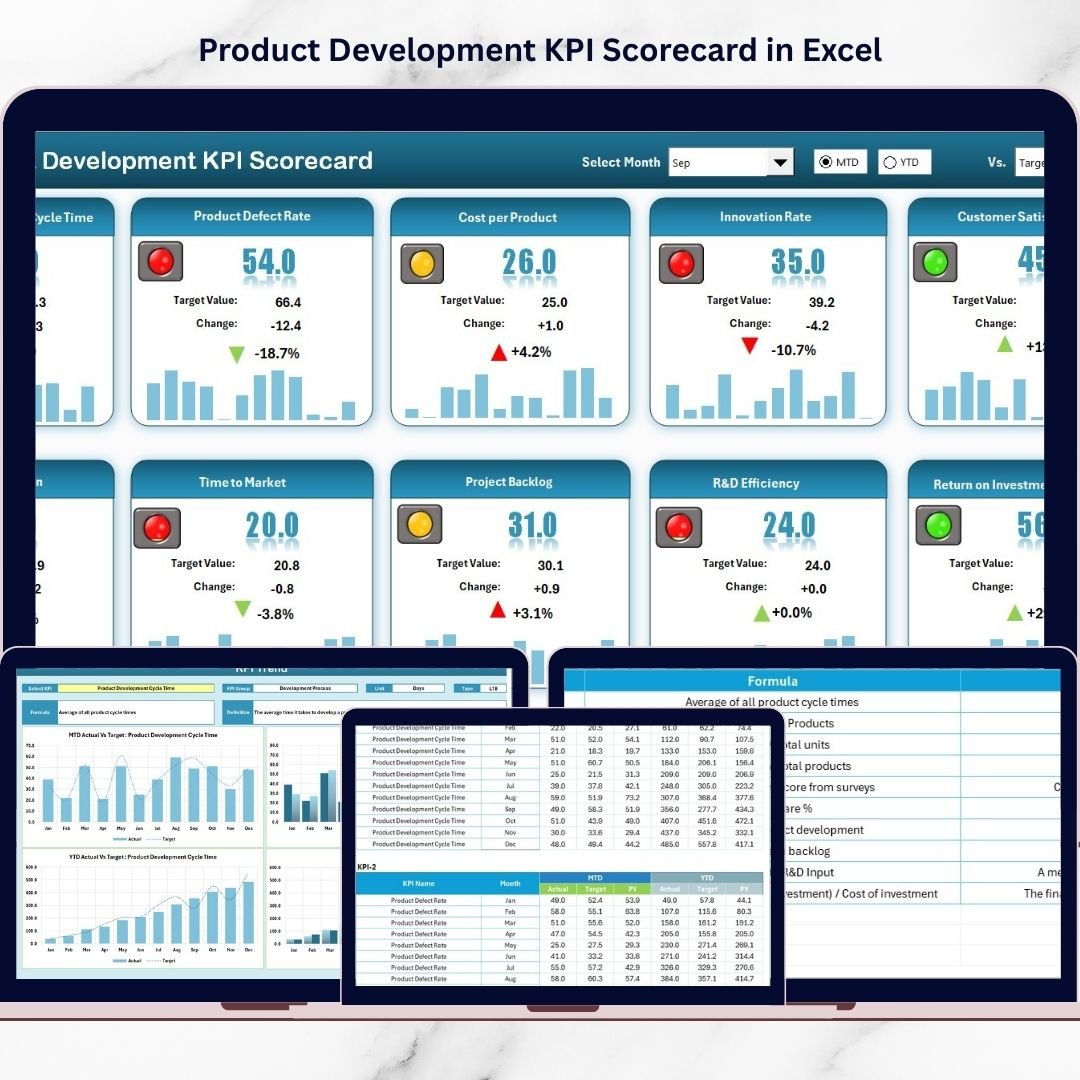
1️⃣ Scorecard Sheet – The Main Performance Dashboard
This sheet acts as your executive overview.
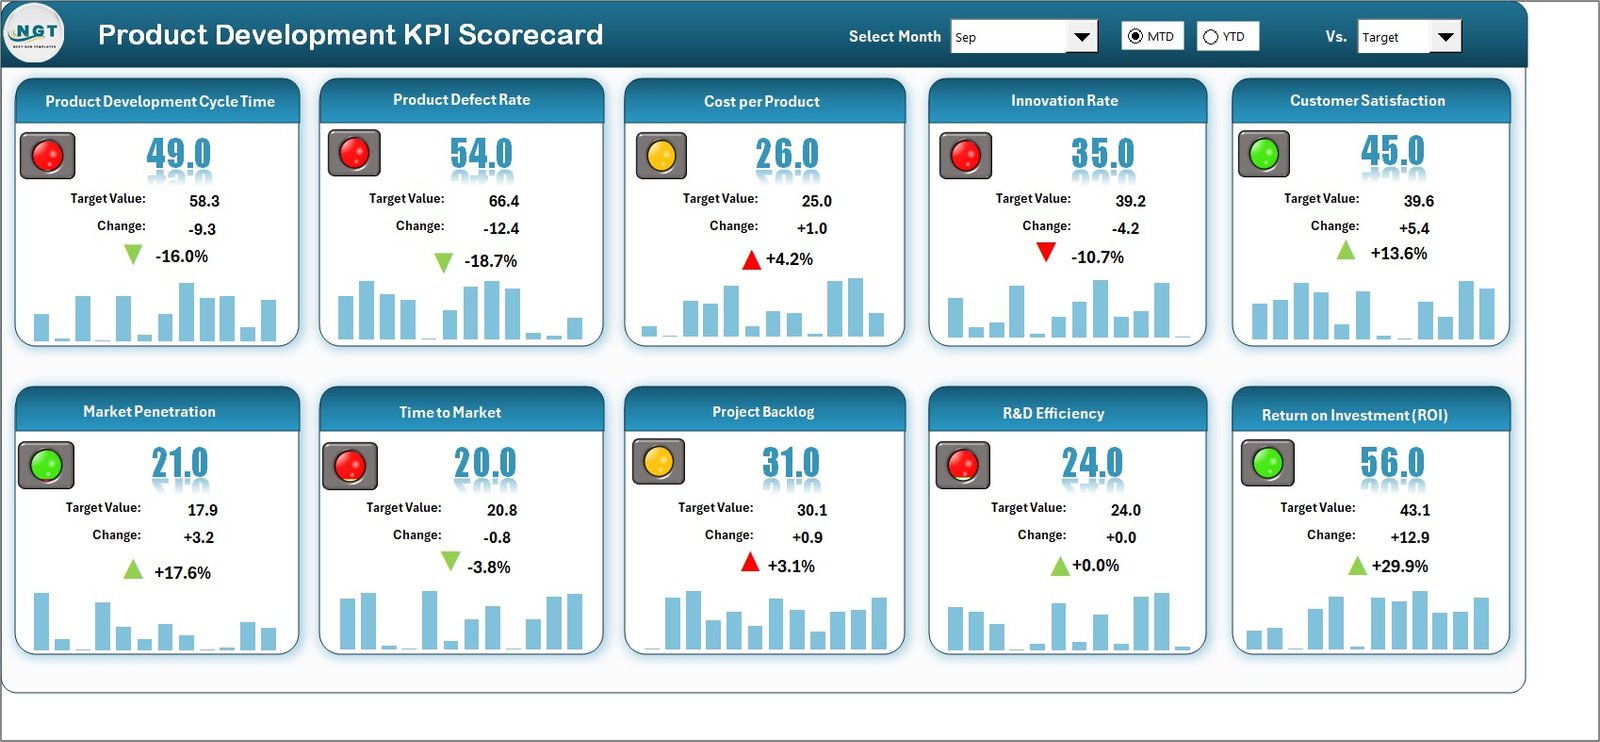
At the top, you can select:
-
Month
-
MTD (Month-to-Date)
-
YTD (Year-to-Date)
As soon as you change the selection, the scorecard updates automatically.
🔹 Actual vs Target Comparison
For every KPI, the scorecard clearly shows:
-
Actual performance
-
Target performance
-
Performance variance
This instantly tells leadership whether development goals are being achieved.
🔹 Visual Performance Indicators
The dashboard uses color-coded conditional formatting:
🟢 Green = Strong performance
🔴 Red = Needs attention
Because of these visual cues, you identify bottlenecks quickly.
🔹 Comprehensive KPI Snapshot
The scorecard displays:
-
KPI Name
-
KPI Group
-
MTD results
-
YTD results
-
Performance status
Within seconds, you understand your product development health.
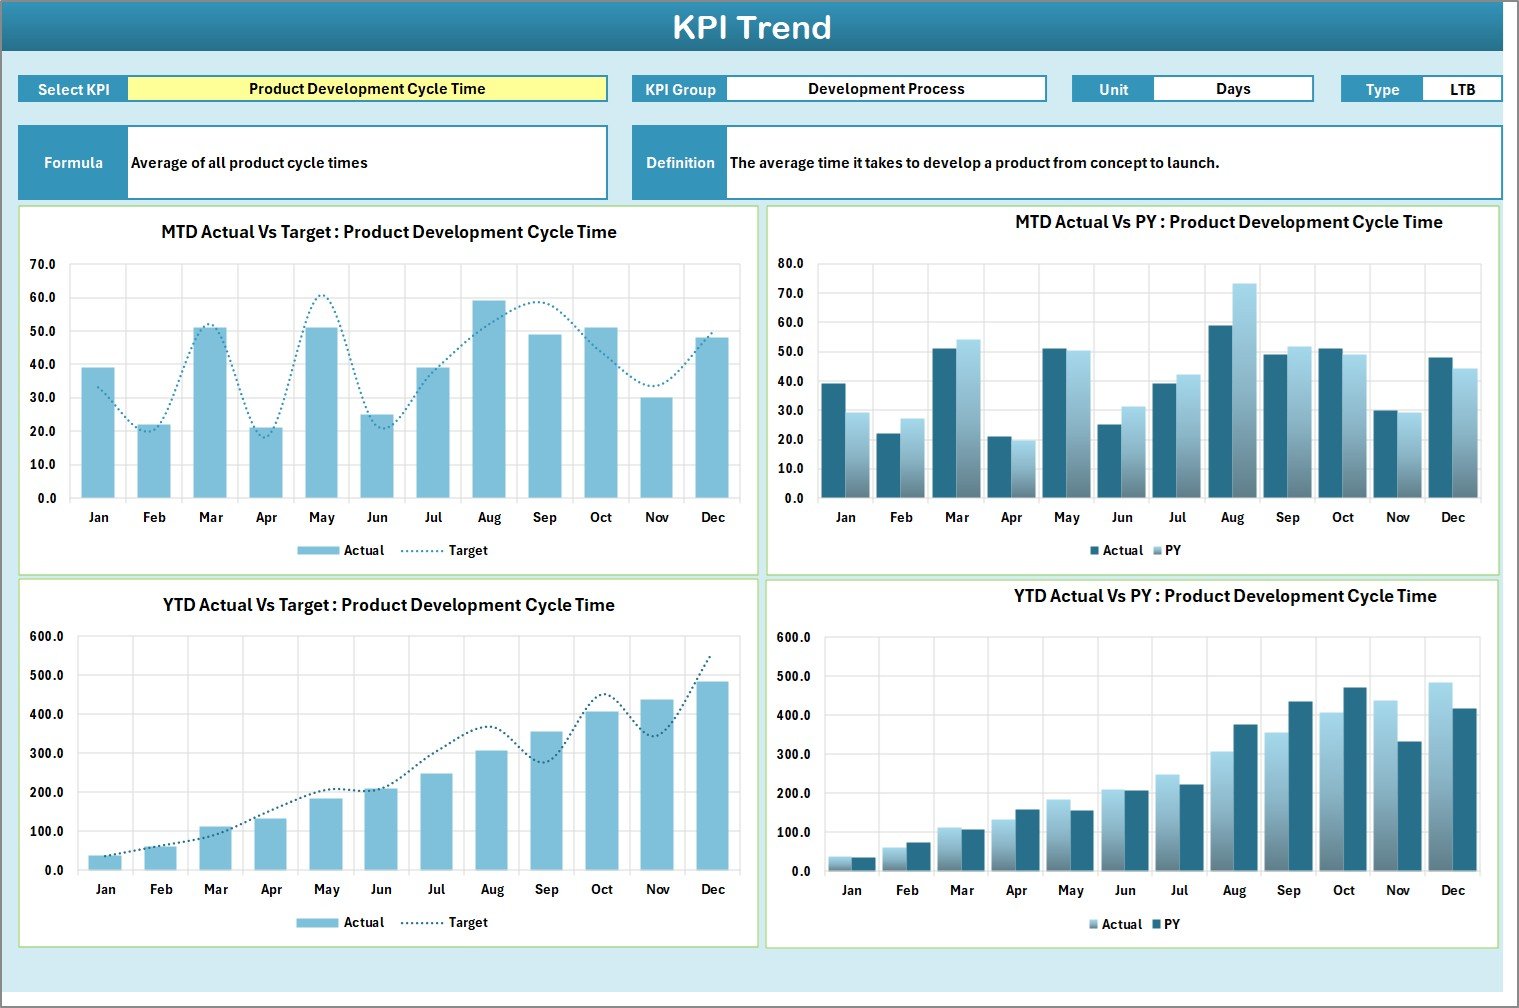
2️⃣ KPI Trend Sheet – Deep Performance Analysis
This sheet helps you analyze individual KPIs in detail.
Select a KPI from the dropdown in Cell C3, and the sheet updates automatically.
You can view:
-
KPI Group
-
Unit
-
Type (LTB or UTB)
-
Formula
-
KPI Definition
📊 Dynamic Trend Charts
Two powerful charts are included:
-
MTD Trend Chart
-
YTD Trend Chart
Each chart compares:
-
Actual
-
Target
-
Previous Year (PY)
Because of trend visualization, you can:
-
Detect delivery slowdowns
-
Monitor quality improvements
-
Evaluate long-term progress
-
Identify recurring bottlenecks
This transforms raw numbers into actionable insights.
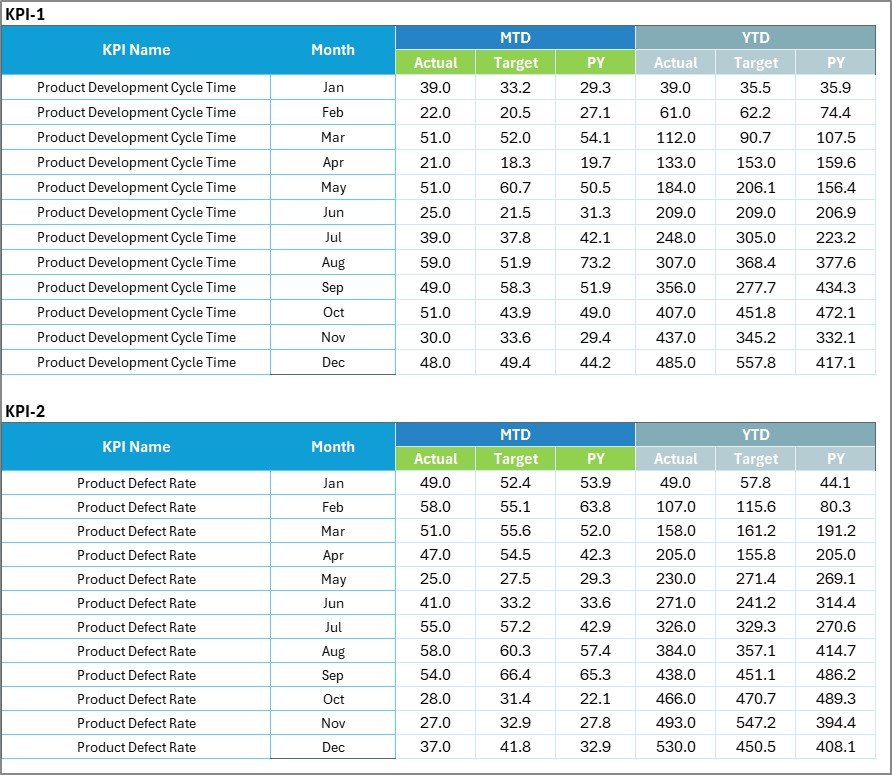
3️⃣ Input Data Sheet – The Data Entry Engine
This sheet is where you enter performance data.
🔹 What You Enter
-
Monthly Actual values
-
Monthly Target values
-
Supporting KPI data
Because the scorecard connects directly to this sheet, updates reflect automatically.
No manual recalculation required.
🔹 Flexible Structure
You can easily update data each month, ensuring your dashboard always reflects current performance.
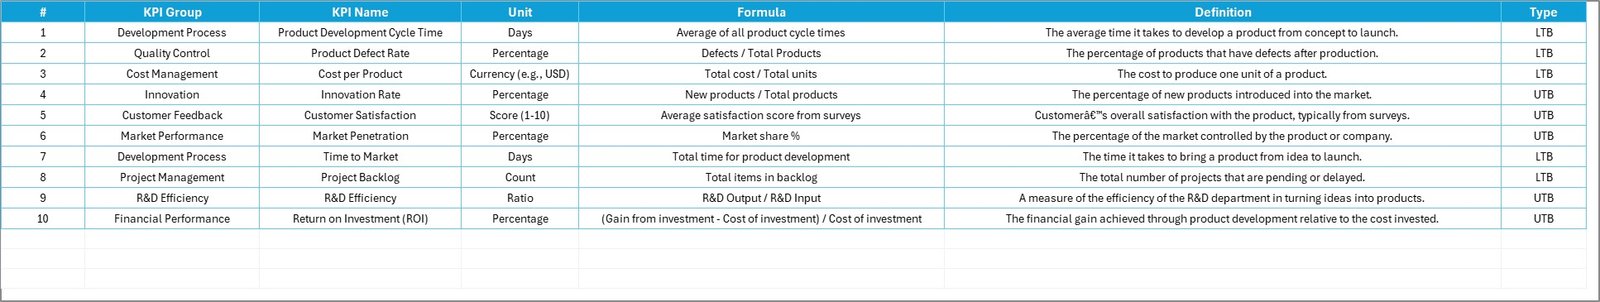
4️⃣ KPI Definition Sheet – The Knowledge Base
This sheet standardizes KPI understanding across teams.
You define:
-
KPI Name
-
KPI Group
-
Unit
-
Formula
-
KPI Definition
Because every KPI is documented, confusion reduces significantly.
This sheet ensures consistency across:
-
Product teams
-
Engineering
-
PMO
-
Leadership
Who Can Benefit from This Scorecard 👥
This template is ideal for:
✔ Product Managers
✔ R&D Teams
✔ Engineering Leaders
✔ PMO Teams
✔ Startup Founders
✔ Technology Companies
✔ Manufacturing Product Teams
Whether you build software, hardware, or consumer products, this scorecard provides valuable visibility.
How This Scorecard Improves Product Success 💡
When teams monitor KPIs consistently:
🚀 Development delays reduce
📊 Resource utilization improves
🎯 Target accountability increases
📉 Quality issues surface earlier
💰 Development costs stay controlled
Instead of reacting to problems late, you identify risks early and act proactively.
Small improvements in cycle time and quality create major competitive advantage.
Why Choose Excel for KPI Tracking? 📊
Excel provides:
✔ Familiar environment
✔ High flexibility
✔ Easy customization
✔ No subscription cost
✔ Quick deployment
You get powerful performance tracking without expensive BI tools.
Build Better Products with Data 🚀
Innovation starts ideas.
Measurement delivers results.
The Product Development KPI Scorecard in Excel gives your team:
📊 Centralized KPI visibility
🎯 Target tracking
📈 Trend monitoring
⚙ Flexible customization
📉 Performance clarity
When you track what matters, you improve what matters.
Stop guessing about product performance.
Start managing with data-driven confidence.
Click here to read the Detailed blog post
Visit our YouTube channel to learn step-by-step video tutorials
👉 https://youtube.com/@PKAnExcelExpert