Renewable Infrastructure Projects Dashboard is the future. However, managing renewable infrastructure projects is not simple. Solar farms, wind plants, hydro stations, and biomass facilities require massive investments, strict monitoring, and continuous ROI tracking. Meanwhile, government subsidies, operating costs, and regional performance add further complexity.
If you are still managing renewable projects through scattered spreadsheets, you are risking poor visibility and delayed decisions.
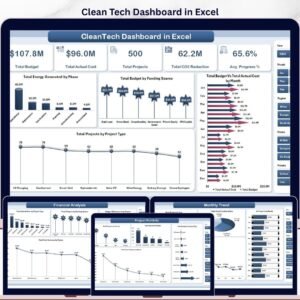
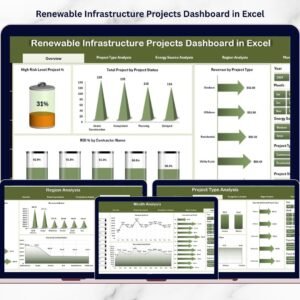
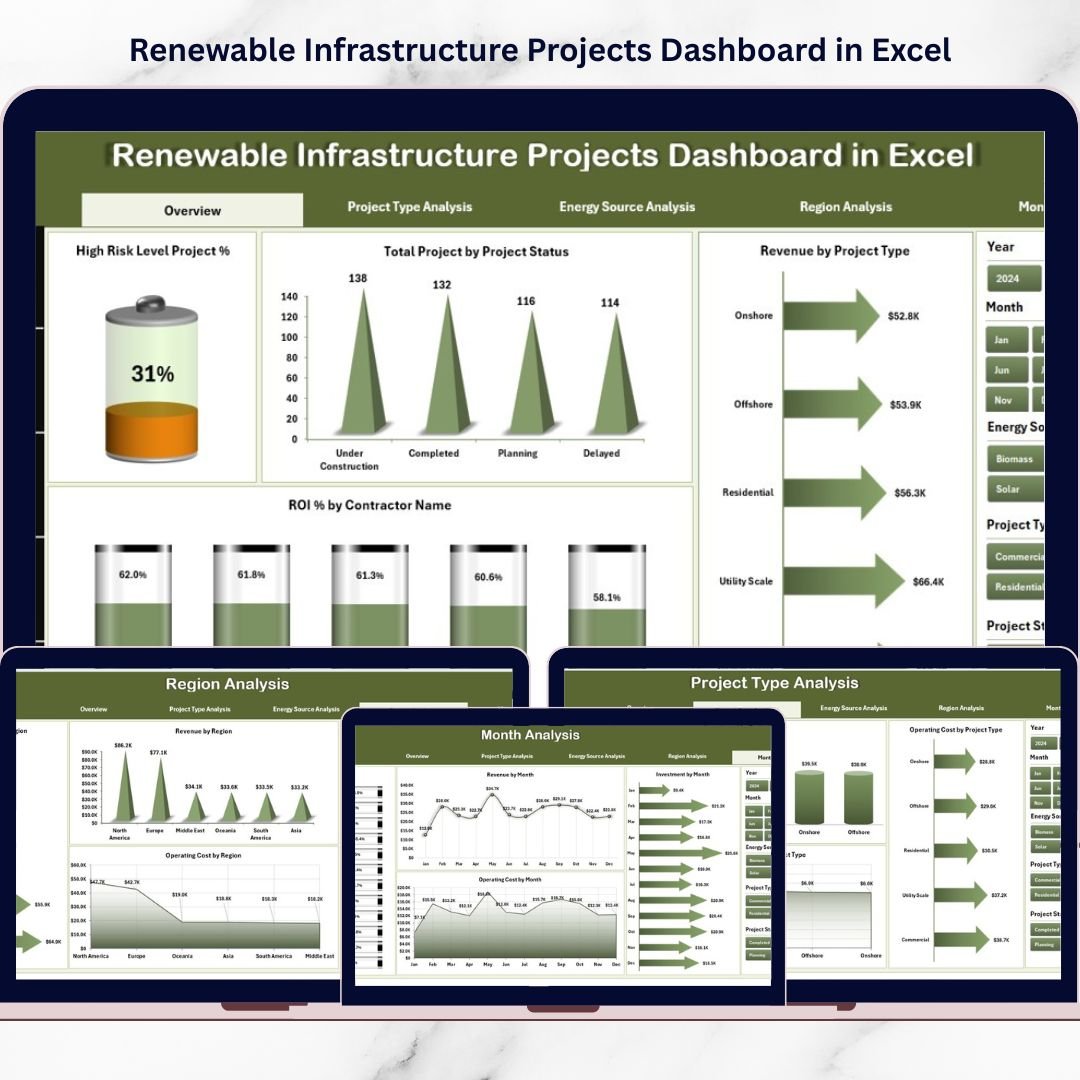
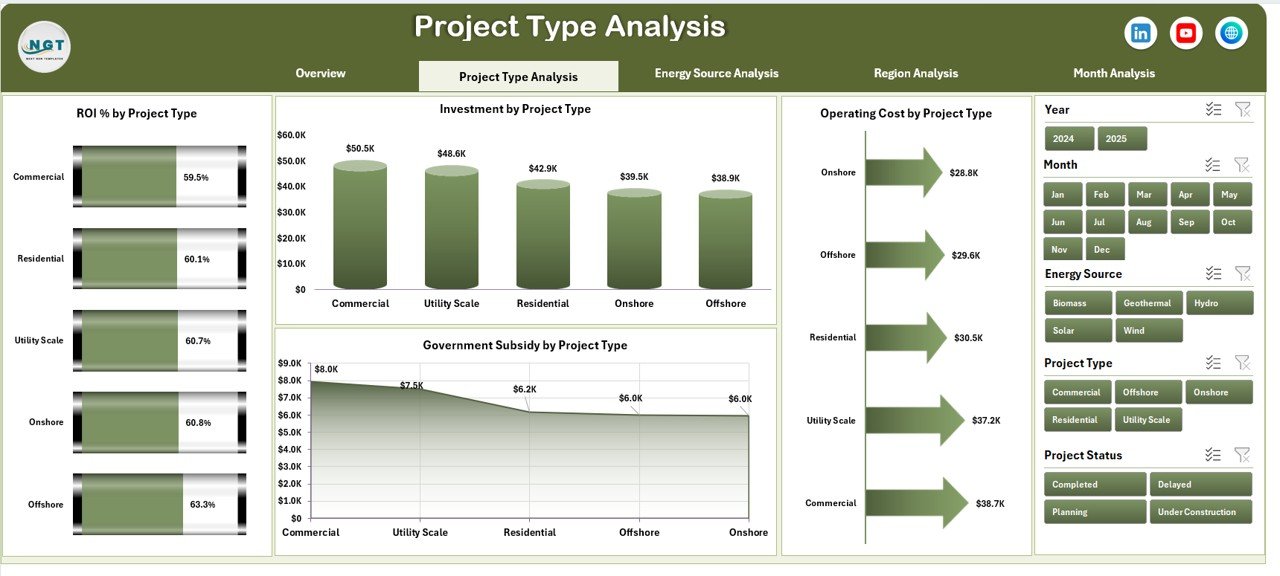
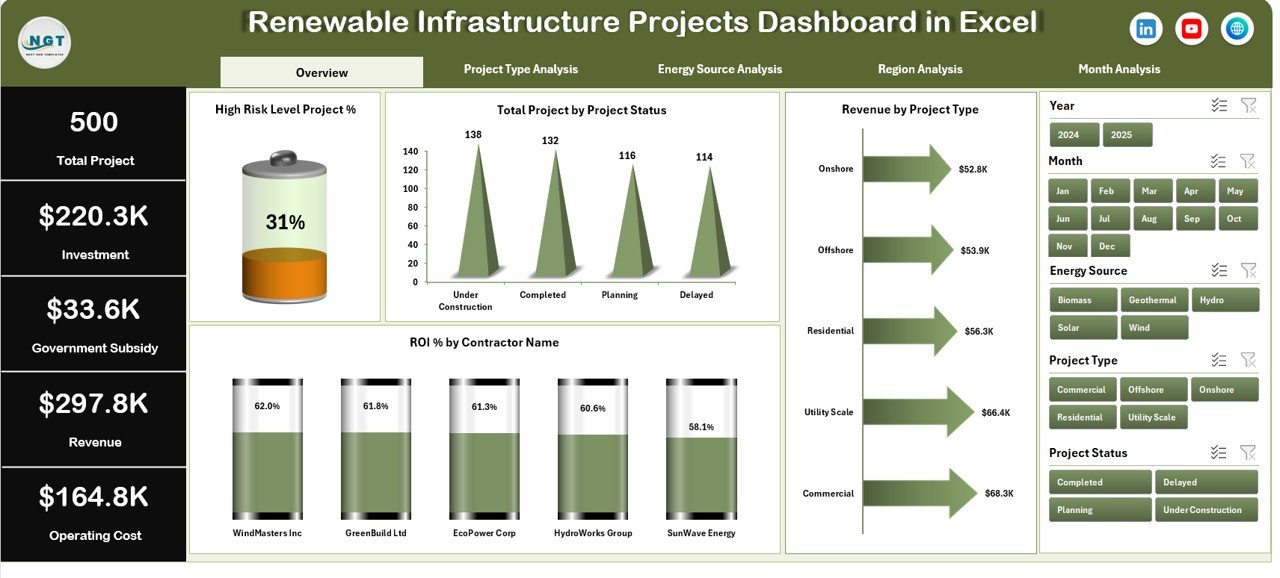
That is why we created the Renewable Infrastructure Projects Dashboard in Excel — a powerful, ready-to-use template designed to centralize renewable project performance in one structured system.
This interactive Excel dashboard helps you monitor ROI %, Investment, Revenue, Operating Cost, Government Subsidy, Risk Level, and Project Status — all inside a professional, easy-to-use file.
If you want smarter capital allocation and stronger investment control, this dashboard is built for you.
🚀 Key Feature of Renewable Infrastructure Projects Dashboard in Excel
This dashboard includes 5 fully structured analytical pages, supported by a Data Sheet and Support Sheet.
📊 Overview Page – Instant snapshot of High-Risk Project %, Total Projects, Total Revenue, and Average ROI %.
🌞 Project Type Analysis – Compare Solar, Wind, Hydro, Biomass, and Geothermal project performance.
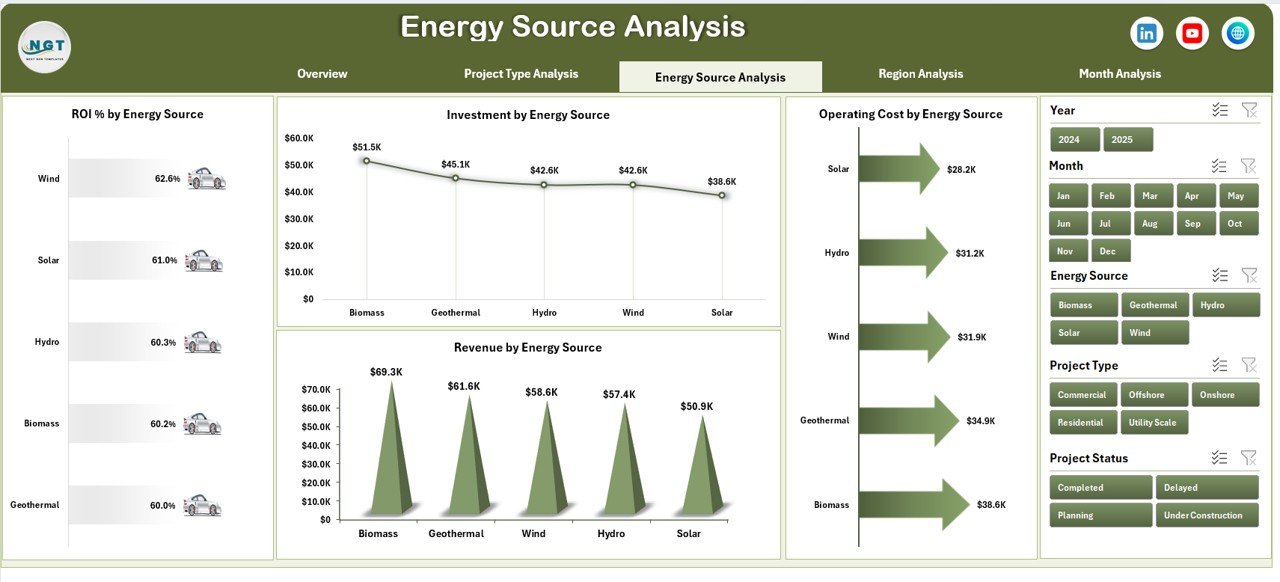
⚡ Energy Source Analysis – Evaluate ROI, Investment, Revenue, and Operating Cost by energy source.
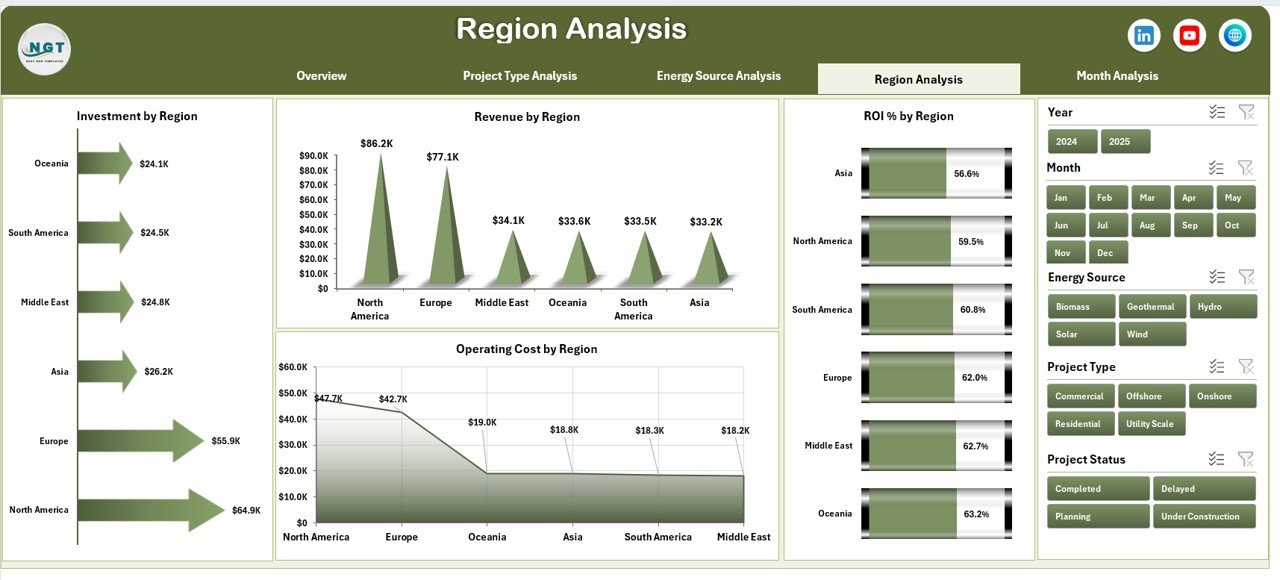
🌍 Region Analysis – Monitor regional profitability and subsidy impact.
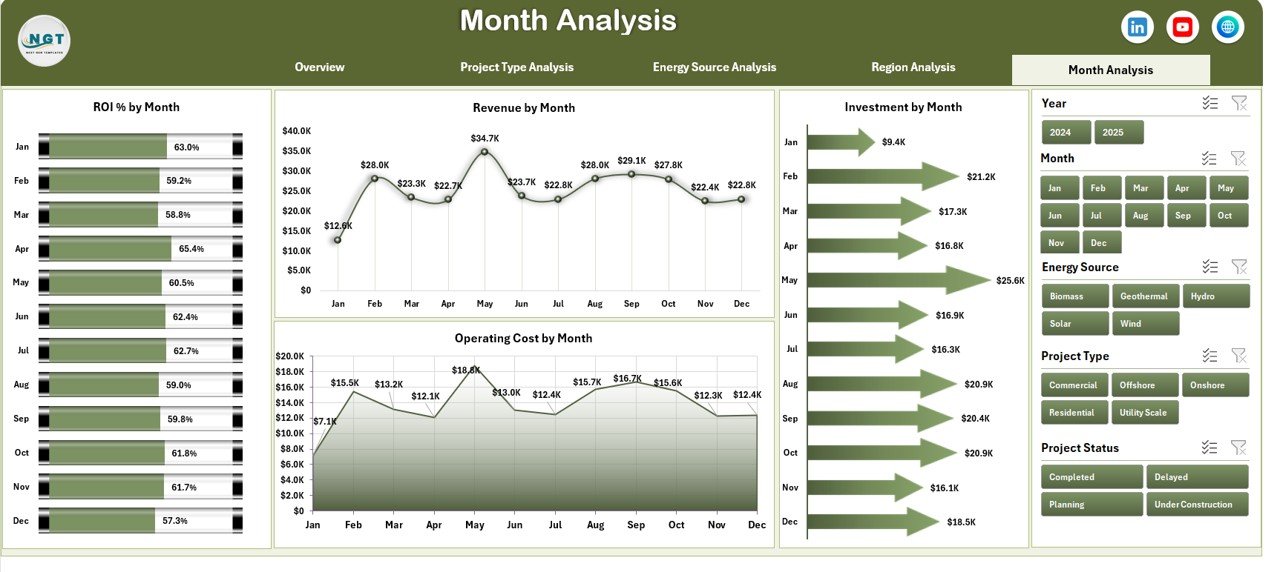
📅 Month Analysis – Track ROI and cost trends month by month.
✨ Additional highlights:
-
Left-side Page Navigator for seamless navigation
-
Right-side slicers for dynamic filtering
-
Pivot Tables & Pivot Charts for automated analysis
-
Structured Data Sheet for easy updates
-
Fully customizable KPI formulas
Because everything runs in Excel, you maintain full control without expensive BI software.
📦 What’s Inside the Renewable Infrastructure Projects Dashboard in Excel
This ready-to-use Excel file contains:
✔ 5 Interactive Dashboard Pages
✔ Structured Data Sheet with project-level inputs
✔ Support Sheet for helper calculations
✔ KPI Cards for Risk %, Revenue & ROI
✔ ROI % tracking by contractor, region & energy source
✔ Investment & Operating Cost monitoring
✔ Government Subsidy distribution analysis
✔ Project Status tracking
✔ Monthly trend visualization
You simply update the Data Sheet and refresh Pivot Tables. The dashboard updates automatically.
🛠 How to Use the Renewable Infrastructure Projects Dashboard in Excel
Using this dashboard is simple:
1️⃣ Enter project data in the Data Sheet (Investment, Revenue, Cost, Subsidy, Risk Level, Region, etc.).
2️⃣ Ensure ROI formula is applied correctly:
ROI % = (Revenue – Operating Cost – Investment + Subsidy) / Investment
3️⃣ Refresh Pivot Tables.
4️⃣ Use slicers to filter by region, project type, contractor, or month.
5️⃣ Analyze performance insights instantly.
For example:
If Solar projects show higher ROI than Wind, you can adjust capital allocation.
If a region reports rising operating costs, you can investigate inefficiencies.
If High-Risk Project % increases, management can act immediately.
Because performance becomes visible, decision-making becomes faster.
👥 Who Can Benefit from This Renewable Infrastructure Projects Dashboard in Excel
This dashboard is ideal for:
🌱 Renewable Energy Companies
💼 Infrastructure Investors
🏛 Government Energy Departments
📊 Financial Analysts
🏗 Project Management Teams
🌍 Sustainability Consultants
Whether you manage a renewable portfolio or analyze green investments, this dashboard supports strategic and operational decisions.
It improves:
✔ ROI monitoring
✔ Risk management
✔ Subsidy tracking
✔ Investment efficiency
✔ Regional profitability analysis
When renewable data becomes structured and visual, sustainable growth becomes achievable.
💰 How This Dashboard Supports Smarter Investment Decisions
Investment discipline drives renewable success.
This dashboard helps you:
-
Compare ROI across energy types
-
Detect underperforming contractors
-
Track subsidy impact on profitability
-
Monitor operating cost spikes
-
Identify high-risk exposure early
Instead of relying on assumptions, you invest based on clear performance data.
And that strengthens long-term sustainability.
Click hare to read the Detailed blog post
Visit our YouTube channel to learn step-by-step video tutorials