In today’s competitive market, CRM development teams cannot afford unclear reporting. You manage customer engagement, feature delivery, revenue contribution, system uptime, and productivity — all at once. However, when KPIs sit inside scattered Excel sheets, visibility disappears.
That is exactly why we built the CRM Development KPI Dashboard in Power BI — a powerful, ready-to-use dashboard that converts raw Excel data into structured, interactive insights.
Instead of spending hours preparing reports, you can monitor MTD and YTD performance instantly, compare Actual vs Target, evaluate Previous Year results, and identify underperforming KPIs in seconds.
If you want clarity, speed, and accountability in CRM reporting, this dashboard delivers.
🚀 Key Feature of CRM Development KPI Dashboard in Power BI
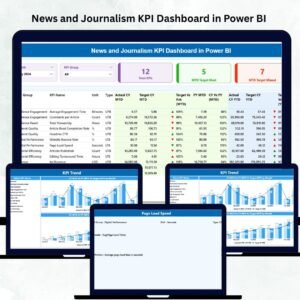
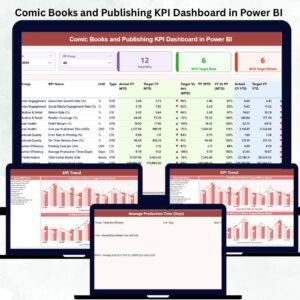
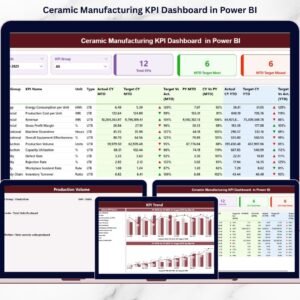
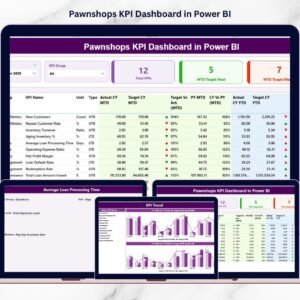
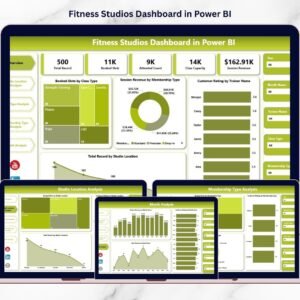
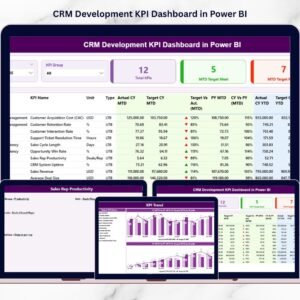
This dashboard includes 3 structured analytical pages, each designed to simplify KPI tracking:
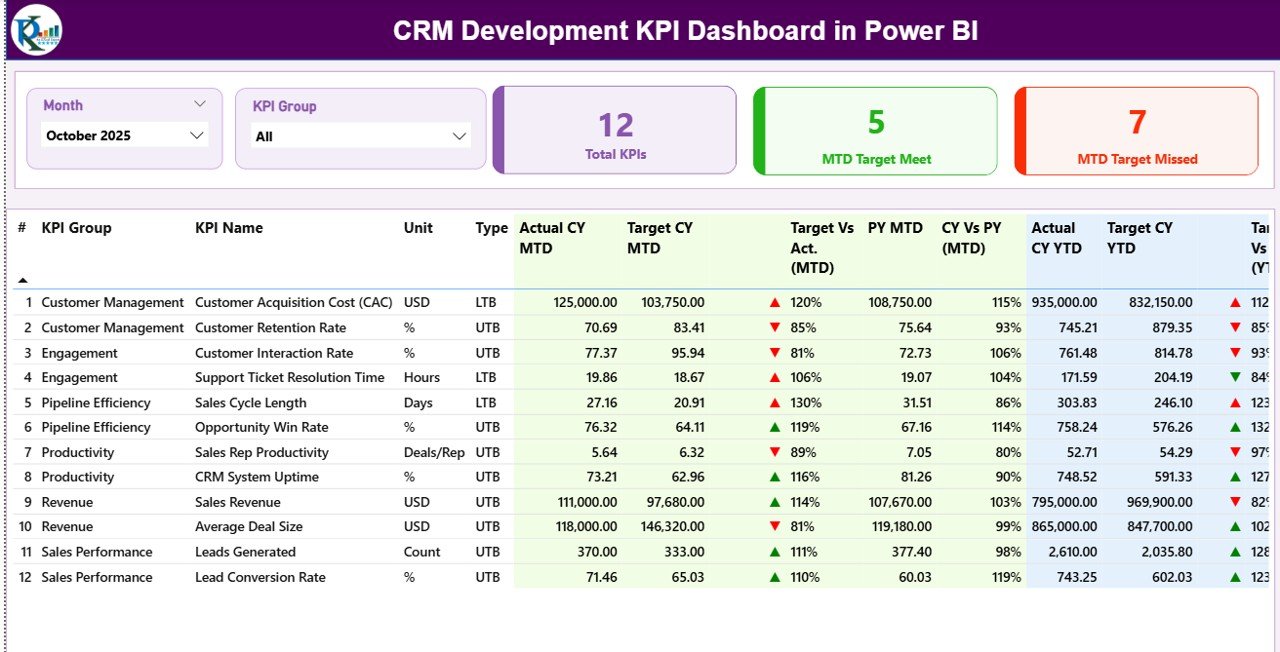
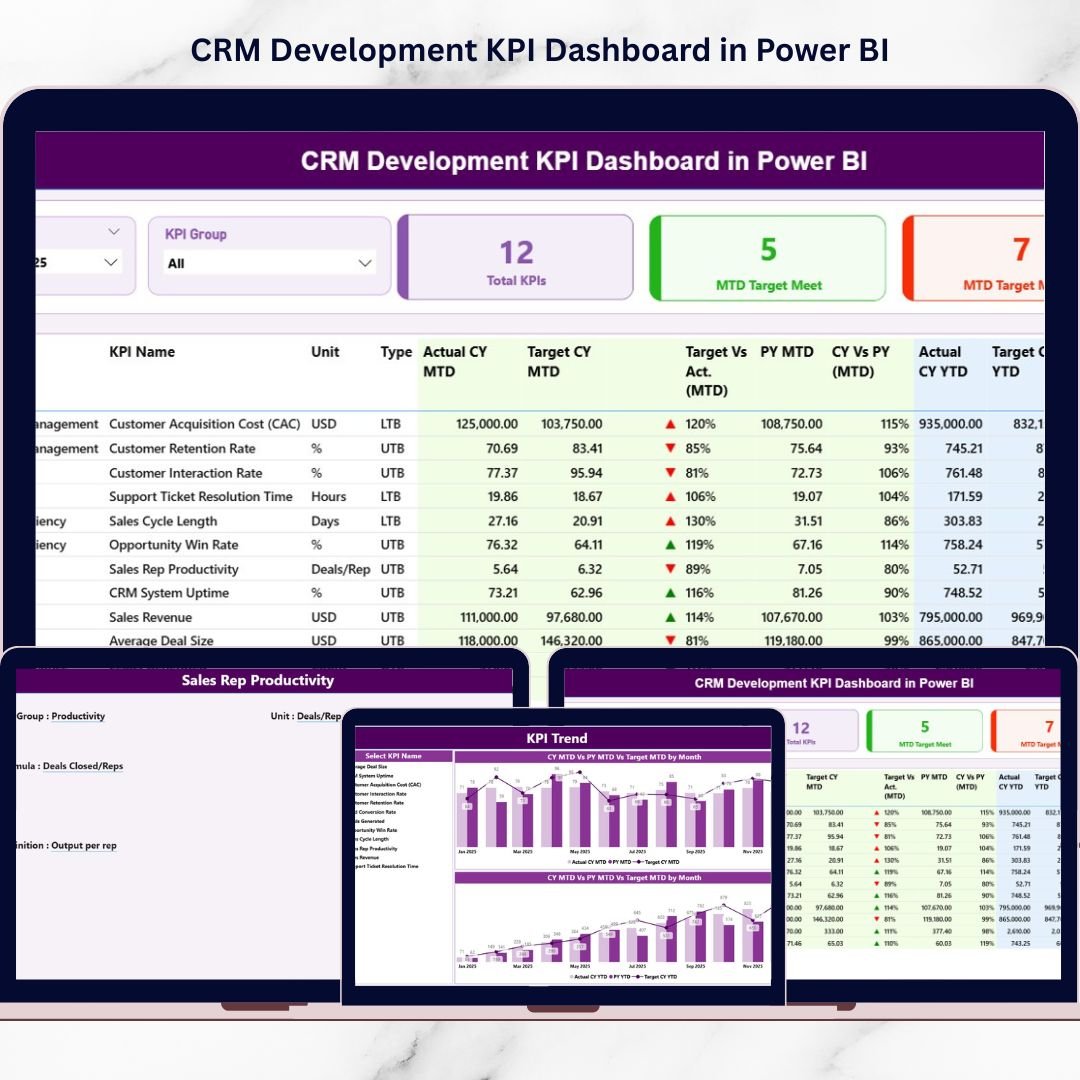
📊 Summary Page (Main Control Panel) – View all KPIs with MTD & YTD comparisons, performance icons (▲▼), and dynamic slicers.
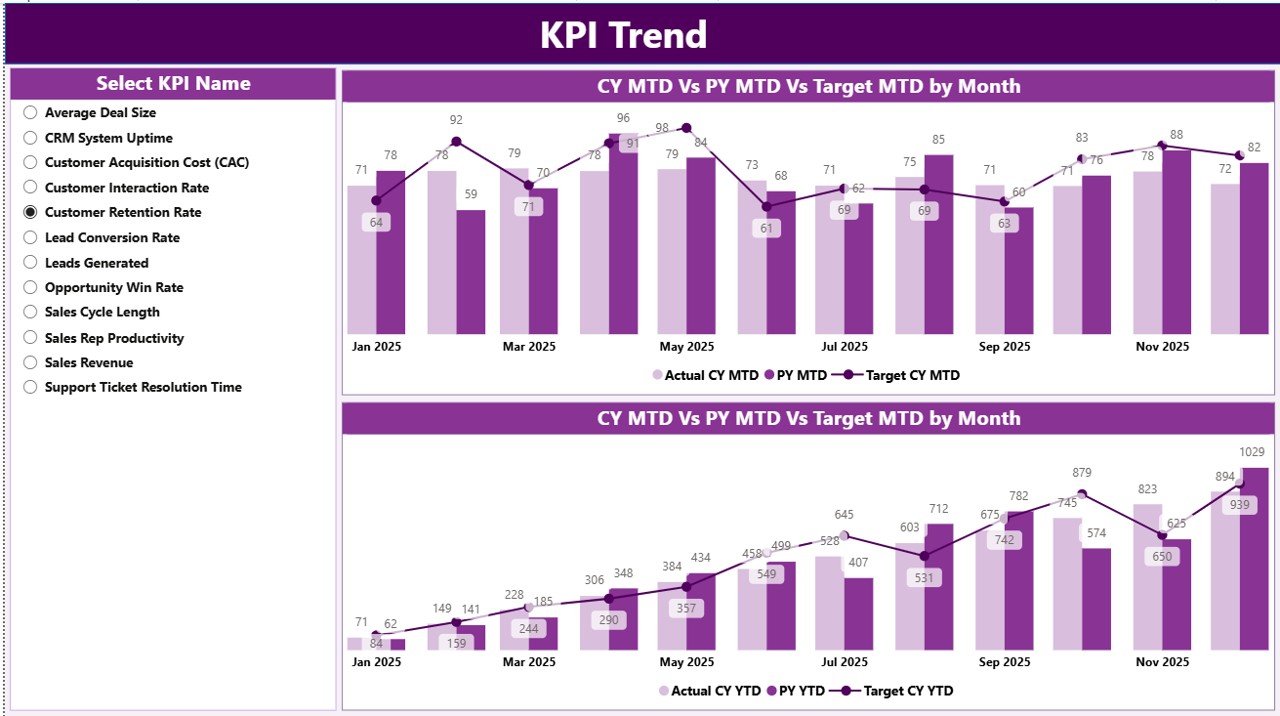
📈 KPI Trend Page – Visual combo charts comparing Current Year, Previous Year, and Target values.
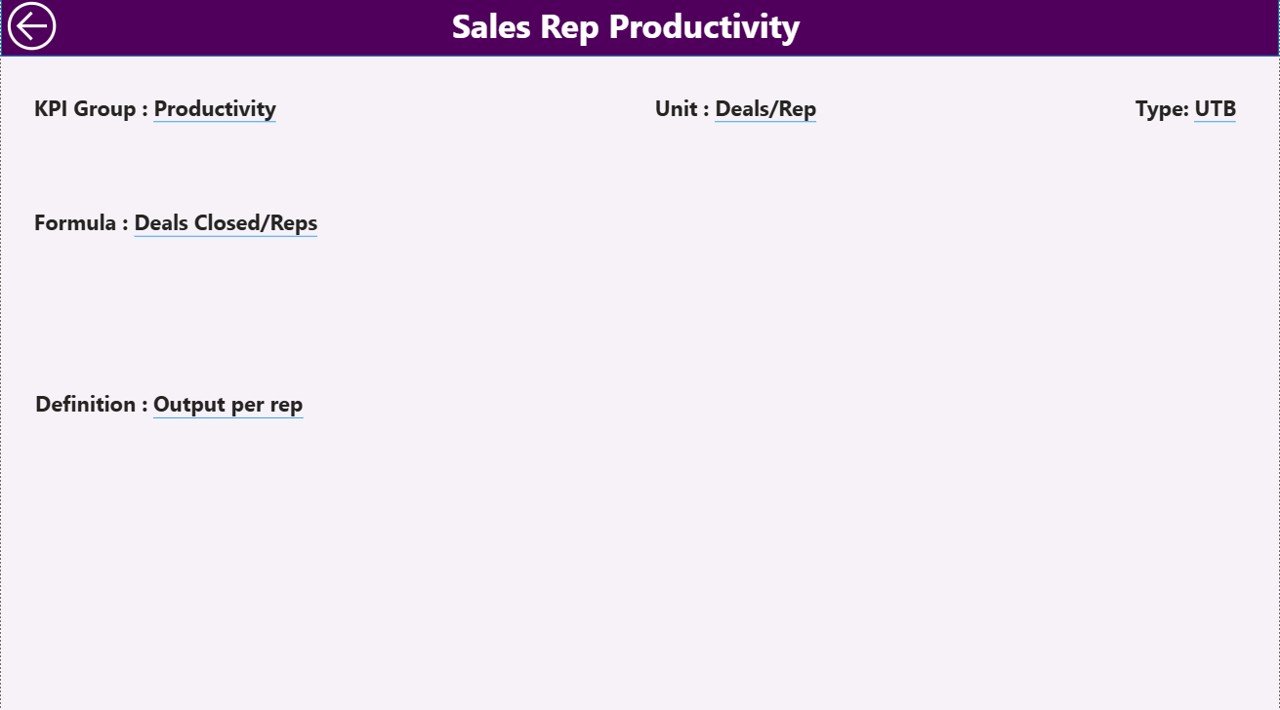
📘 KPI Definition Page (Drill-Through) – Instantly view KPI formula, definition, and KPI type (LTB or UTB).
✨ Advanced capabilities include:
-
Month slicer for dynamic filtering
-
KPI Group slicer for category analysis
-
Target Meet & Missed KPI count cards
-
Visual performance indicators
-
Drill-through functionality
-
Excel-connected data refresh
Because everything updates dynamically, you gain real-time performance control.
📦 What’s Inside the CRM Development KPI Dashboard in Power BI
This ready-to-use Power BI file connects to a structured Excel data source containing:
✔ Input_Actual Sheet – Enter KPI Name, Month, MTD & YTD values
✔ Input_Target Sheet – Define monthly MTD & YTD targets
✔ KPI Definition Sheet – Set KPI Number, Group, Unit, Formula, Definition & Type
Inside Power BI, you get:
✔ Total KPI Count Card
✔ MTD Target Meet Count
✔ MTD Target Missed Count
✔ MTD & YTD Actual vs Target Comparison
✔ Previous Year vs Current Year Analysis
✔ Performance icons (Green ▲ / Red ▼)
✔ Combo charts for deep trend insights
You only update Excel. Power BI handles the analytics.
🛠 How to Use the CRM Development KPI Dashboard in Power BI
Using this dashboard is simple:
1️⃣ Define your KPIs in the KPI Definition sheet.
2️⃣ Enter actual MTD & YTD numbers in Input_Actual.
3️⃣ Enter monthly targets in Input_Target.
4️⃣ Connect Excel to Power BI.
5️⃣ Refresh the dashboard.
Select any month using the slicer.
For example:
If Lead Conversion Rate falls below target, the red ▼ icon highlights it immediately.
If Revenue Growth exceeds previous year, the green ▲ confirms improvement.
If Bug Resolution Time increases (LTB KPI), the system flags it clearly.
Because you see MTD and YTD side by side, short-term and long-term performance become transparent.
👥 Who Can Benefit from This CRM Development KPI Dashboard in Power BI
This dashboard is ideal for:
👨💼 CRM Development Managers
📊 Business Analysts
🚀 CRM Product Owners
💼 Project Managers
🏢 Senior Leadership Teams
💻 CTOs & SaaS Companies
Whether you manage small CRM teams or enterprise-level systems, this dashboard improves:
✔ KPI visibility
✔ Performance accountability
✔ Data-driven decision-making
✔ Monthly review meetings
✔ Long-term growth tracking
When teams see performance clearly, they improve faster.
💡 How This Dashboard Improves CRM Performance
Performance improves when gaps become visible.
This dashboard helps you:
-
Identify underperforming KPIs
-
Track revenue and customer metrics
-
Compare Current Year vs Previous Year
-
Monitor developer productivity
-
Reduce reporting preparation time
Instead of reacting late, you act early.
And that changes results.
Click hare to read the Detailed blog post
Visit our YouTube channel to learn step-by-step video tutorials