In wood and furniture manufacturing, every delay increases cost. Every inefficient production line reduces margin. And every missed delivery impacts customer trust.
If you are still managing performance using scattered Excel sheets, you are losing valuable time and visibility.
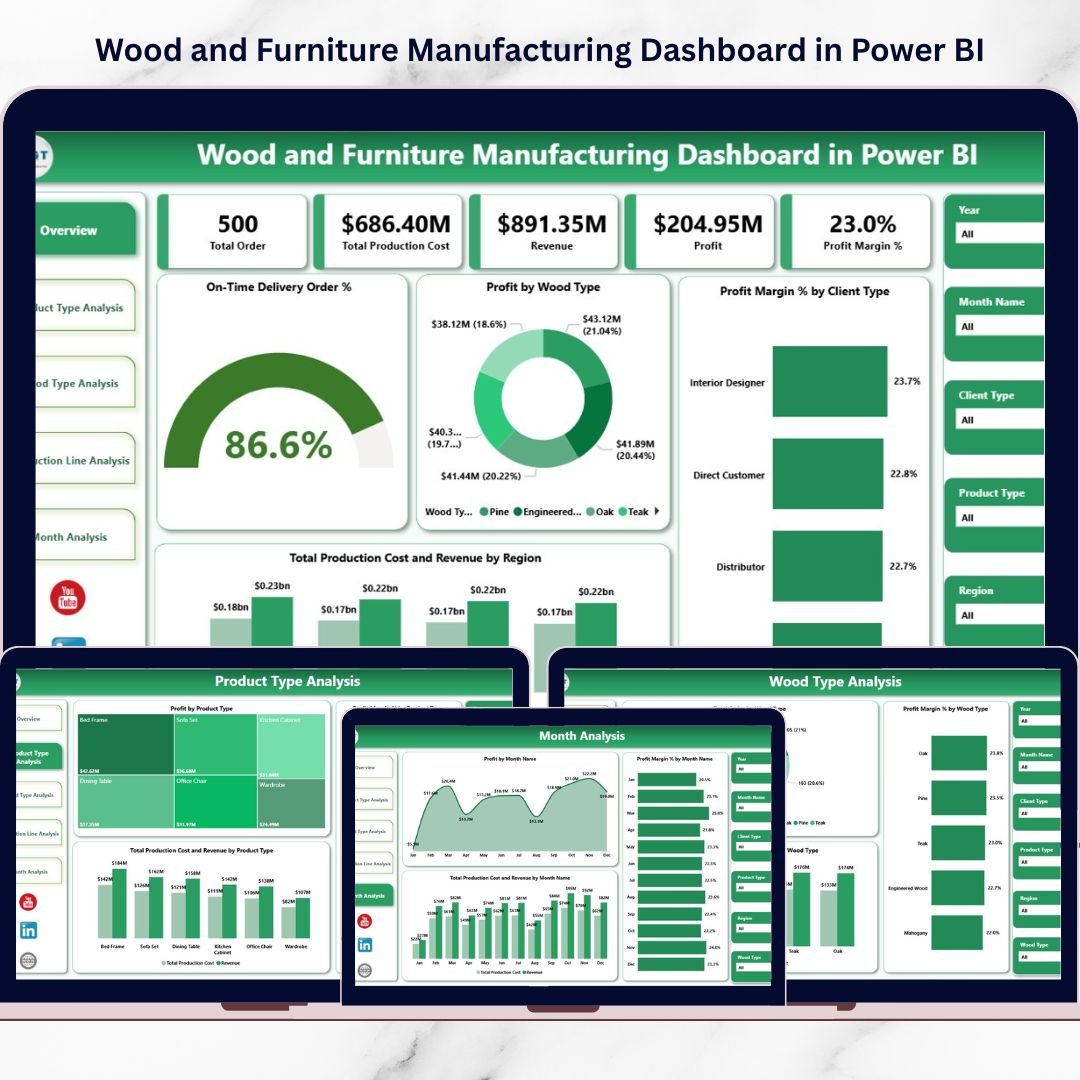
What if you could track profit, production cost, revenue, wood type performance, production line efficiency, and on-time delivery — all in one interactive Power BI dashboard?
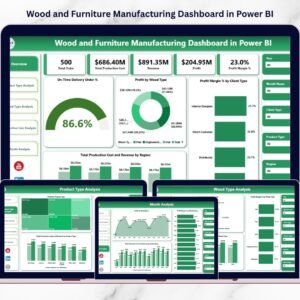
Introducing the Wood and Furniture Manufacturing Dashboard in Power BI — a ready-to-use, interactive analytics solution built specifically for furniture factories and wood processing units.
This dashboard converts raw production and financial data into clear visuals, KPI cards, and dynamic comparisons. Instead of compiling manual reports, you gain instant business intelligence with slicers and drill-down capabilities.
No complex reporting. No confusion. Just structured, data-driven manufacturing control.
🚀 Key Feature of Wood and Furniture Manufacturing Dashboard in Power BI
📊 5 Fully Interactive Dashboard Pages – Overview, Product Type, Wood Type, Production Line, and Month Analysis.
🎯 Powerful KPI Cards – Instantly track On-Time Delivery %, Profit, Profit Margin %, Production Cost, and Revenue.
💰 Cost vs Revenue Comparison – Detect margin issues early with side-by-side analysis.
🪵 Wood Type Performance Insights – Evaluate profitability by raw material category.
🏭 Production Line Efficiency Monitoring – Identify underperforming or high-cost lines.
📆 Monthly Trend Analysis – Monitor seasonal demand and growth patterns.
🧩 Dynamic Slicers – Filter by Month, Region, Product Type, Wood Type, Production Line, and Client Type.
⚡ Real-Time Interactive Visuals – Instantly update insights when filters change.
📦 What’s Inside the Wood and Furniture Manufacturing Dashboard in Power BI
This Power BI file includes 5 structured analytical pages:
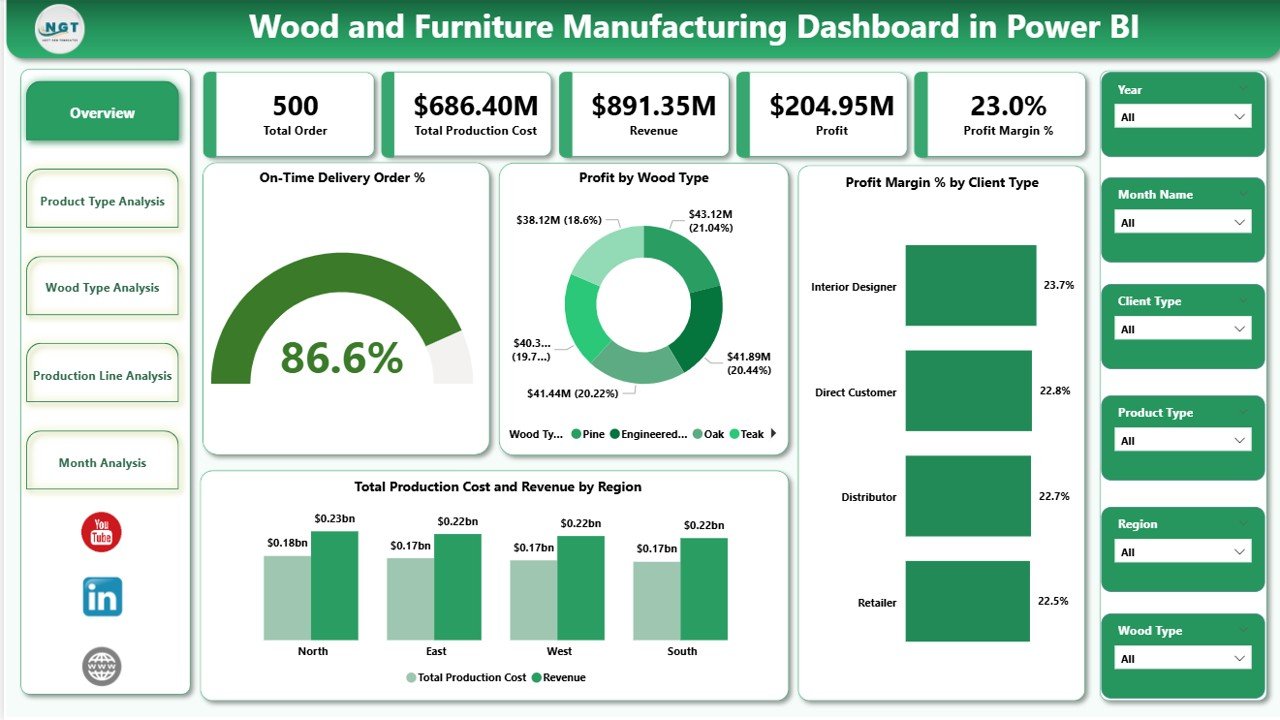
1️⃣ Overview Page – Complete Business Snapshot
Includes slicers for:
-
Month
-
Region
-
Product Type
-
Wood Type
-
Production Line
-
Client Type
KPI Cards Display:
-
On-Time Delivery Order %
-
Profit by Wood Type
-
Profit Margin % by Client Type
-
Total Production Cost
-
Revenue by Region
This page gives leadership instant clarity on overall performance.
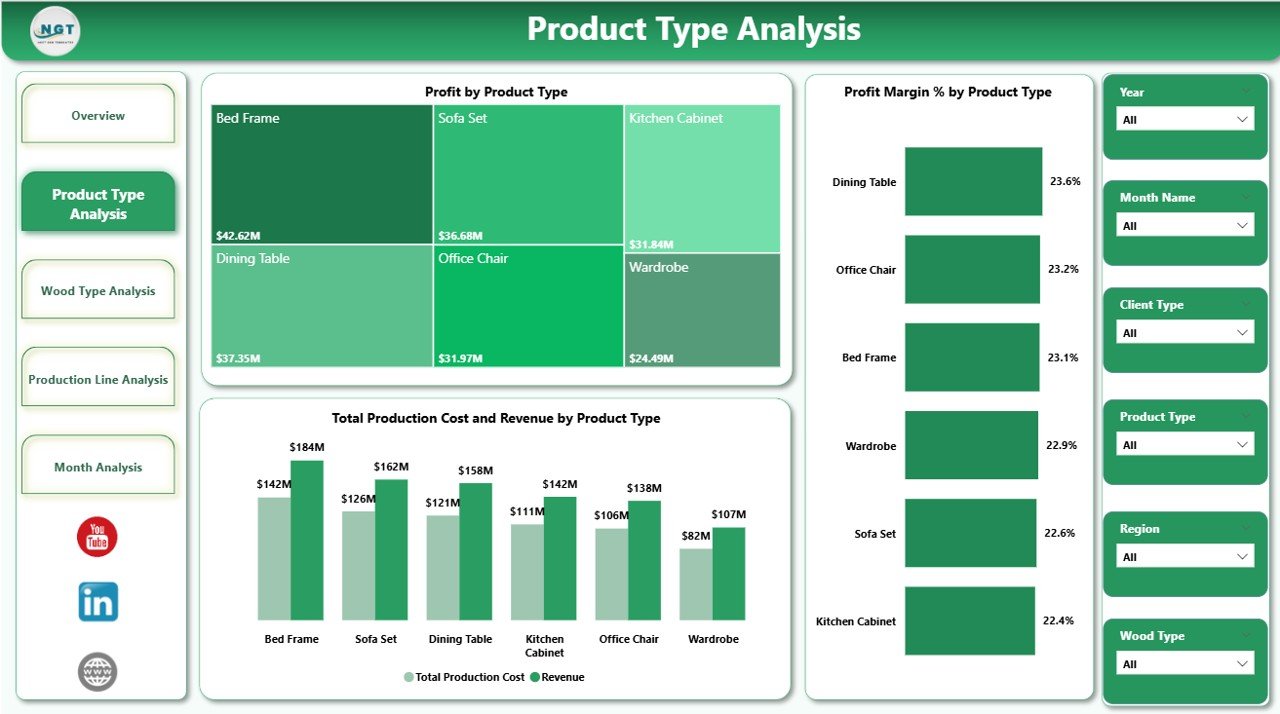
2️⃣ Product Type Analysis
-
Profit by Product Type
-
Profit Margin % by Product Type
-
Production Cost vs Revenue by Product Type
Identify which furniture category generates the highest return and which needs pricing adjustment.
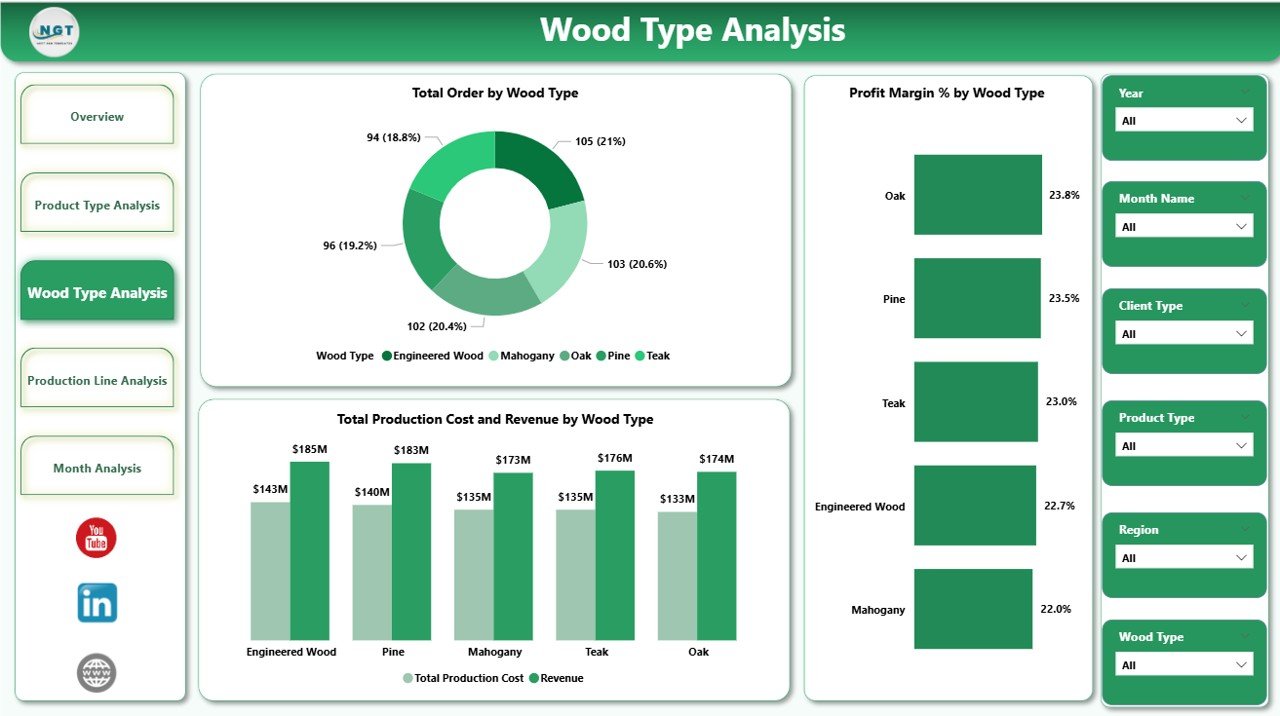
3️⃣ Wood Type Analysis
-
Total Orders by Wood Type
-
Profit Margin % by Wood Type
-
Production Cost vs Revenue by Wood Type
Optimize raw material strategy and improve margin performance.
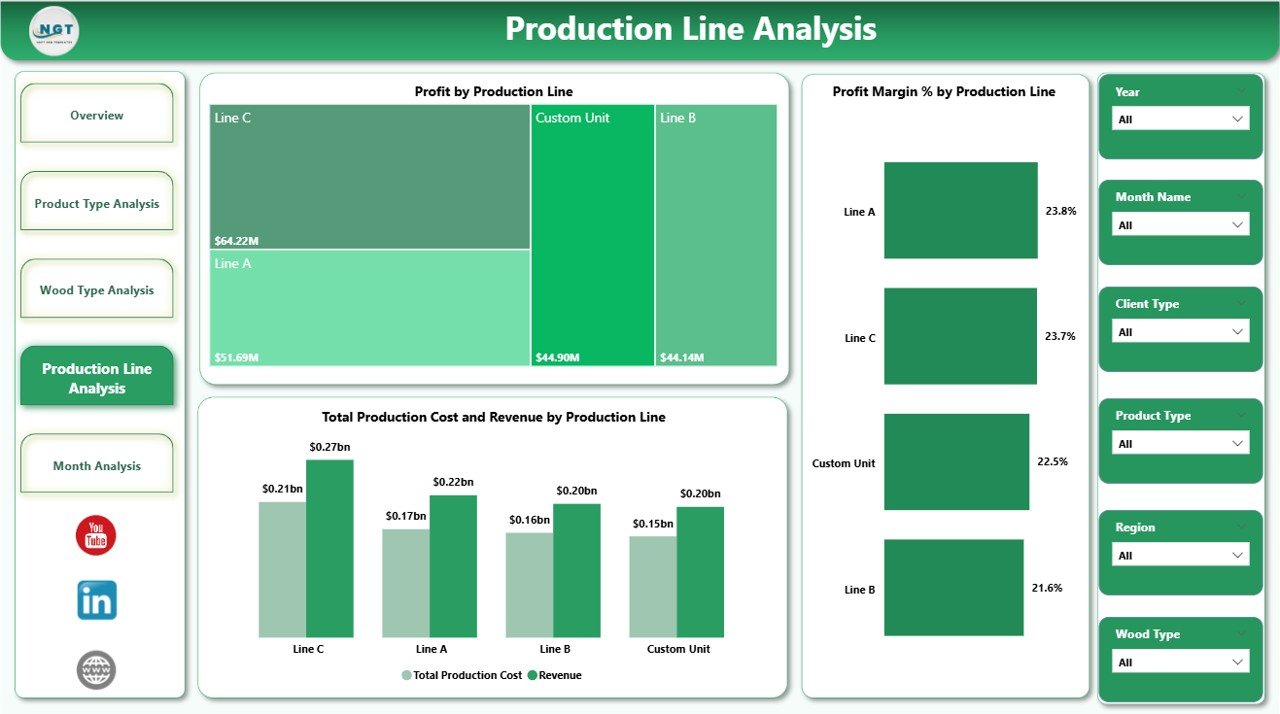
4️⃣ Production Line Analysis
-
Profit by Production Line
-
Profit Margin % by Production Line
-
Production Cost vs Revenue by Production Line
Detect inefficient lines and support lean manufacturing improvements.
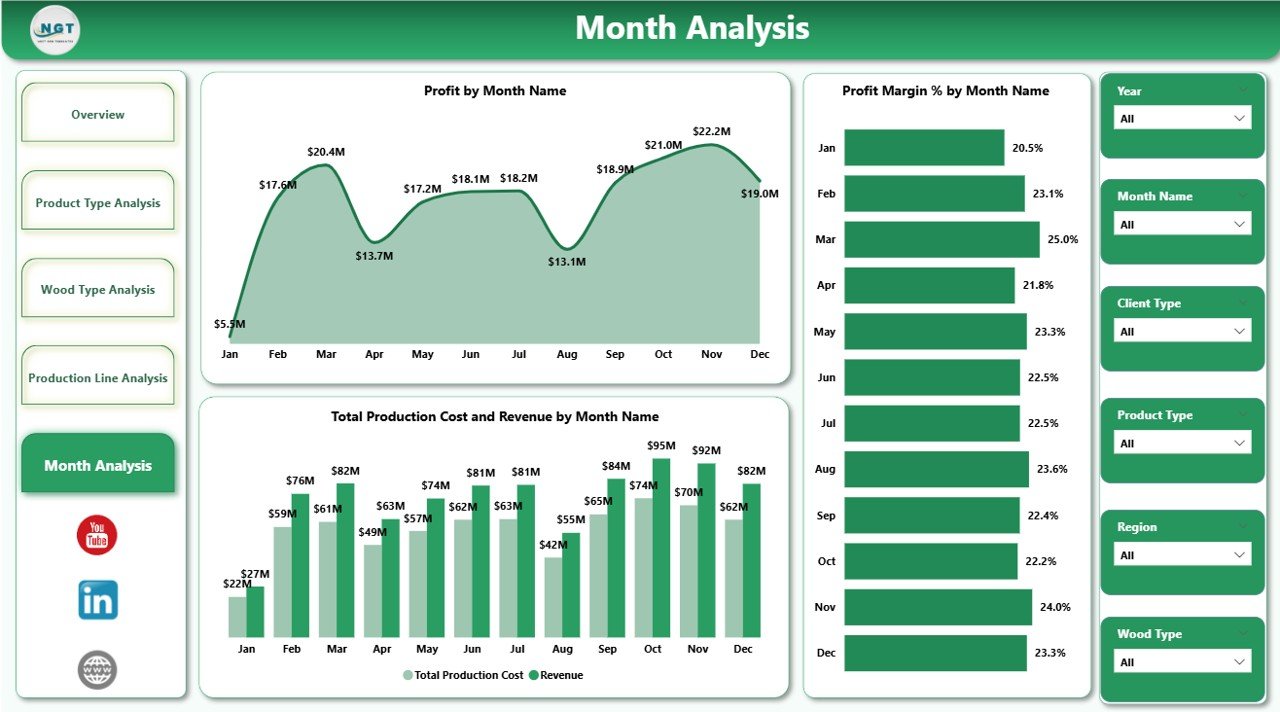
5️⃣ Month Analysis
-
Profit by Month
-
Profit Margin % by Month
-
Production Cost vs Revenue by Month
Understand seasonal patterns and improve budget planning.
🛠 How to Use the Wood and Furniture Manufacturing Dashboard in Power BI
Using the dashboard is simple:
1️⃣ Prepare structured Excel data with columns like Product Type, Wood Type, Revenue, Production Cost, and Delivery Status.
2️⃣ Import the data into Power BI.
3️⃣ Refresh the dashboard.
4️⃣ Use slicers to filter insights instantly.
5️⃣ Analyze KPI cards and visual trends for action.
Because Power BI handles large datasets efficiently, the dashboard scales with your business growth.
👥 Who Can Benefit from This Wood and Furniture Manufacturing Dashboard in Power BI
✔ Furniture Factory Owners
✔ Production Managers
✔ Finance Managers
✔ Supply Chain Heads
✔ Regional Sales Managers
✔ Manufacturing Analysts
Whether you operate a single factory or multiple units, this dashboard helps you monitor performance professionally.
Why This Dashboard Is a Game-Changer for Manufacturers
Instead of guessing which product generates profit, you see exact margin percentages.
Instead of reacting to cost overruns, you identify cost-heavy production lines instantly.
Instead of struggling with regional comparisons, you analyze revenue distribution clearly.
From teak to MDF, from cutting line to polishing line, from monthly trends to delivery performance — every important metric becomes measurable and actionable.
If you want stronger margins, better operational control, and smarter strategic planning, this dashboard gives you the competitive advantage.
Click here to read the Detailed blog post
Visit our YouTube channel to learn step-by-step video tutorials
👉 YouTube Channel – PKAnExcelExpert