Managing postal operations without clear performance visibility is risky. Thousands of parcels, tight delivery timelines, rising customer expectations, and strict service targets require structured tracking.
What if you could monitor delivery performance, revenue growth, customer complaints, and operational efficiency — all inside one powerful Excel dashboard?
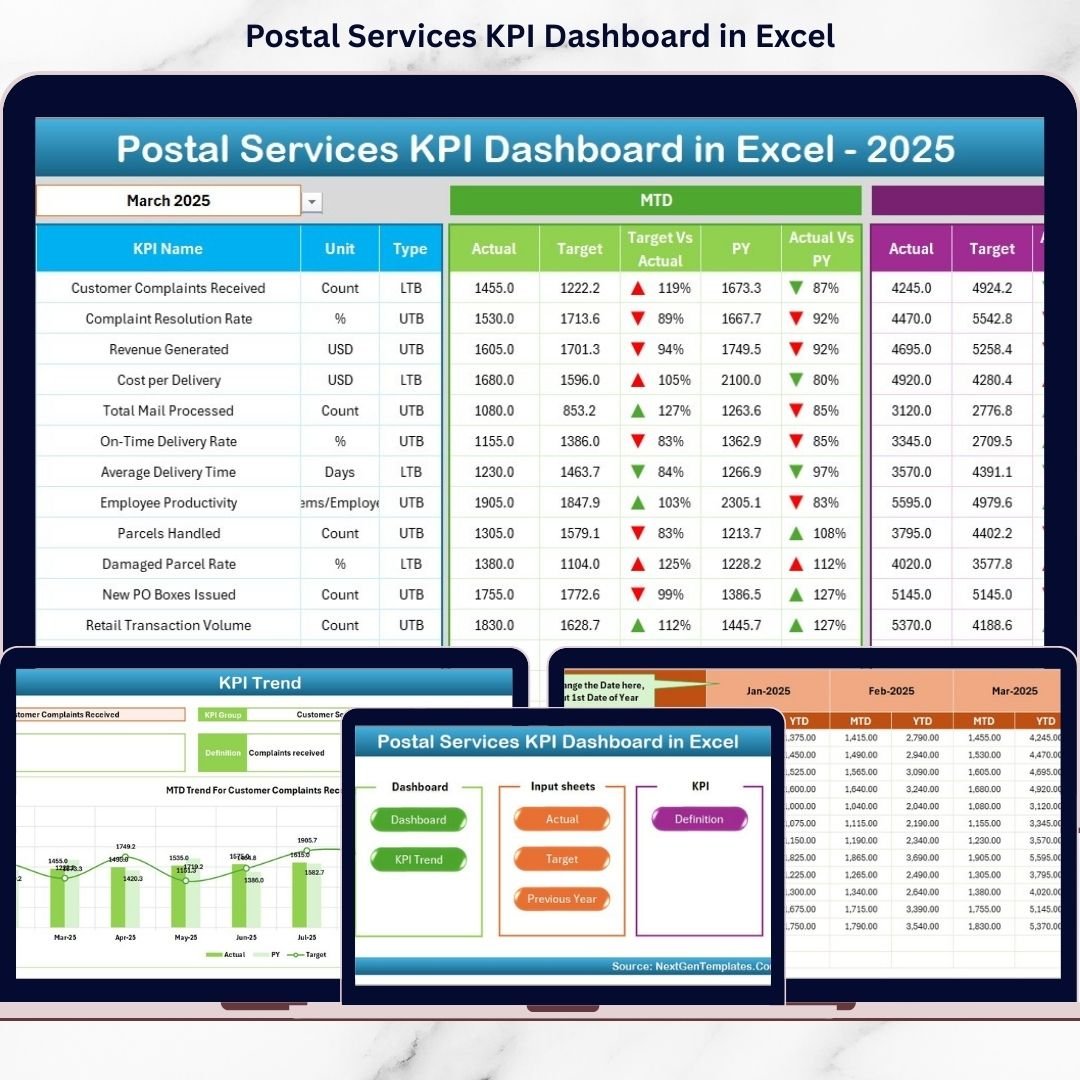
Introducing the Postal Services KPI Dashboard in Excel — a ready-to-use performance tracking system designed for postal departments, courier services, and logistics operations.
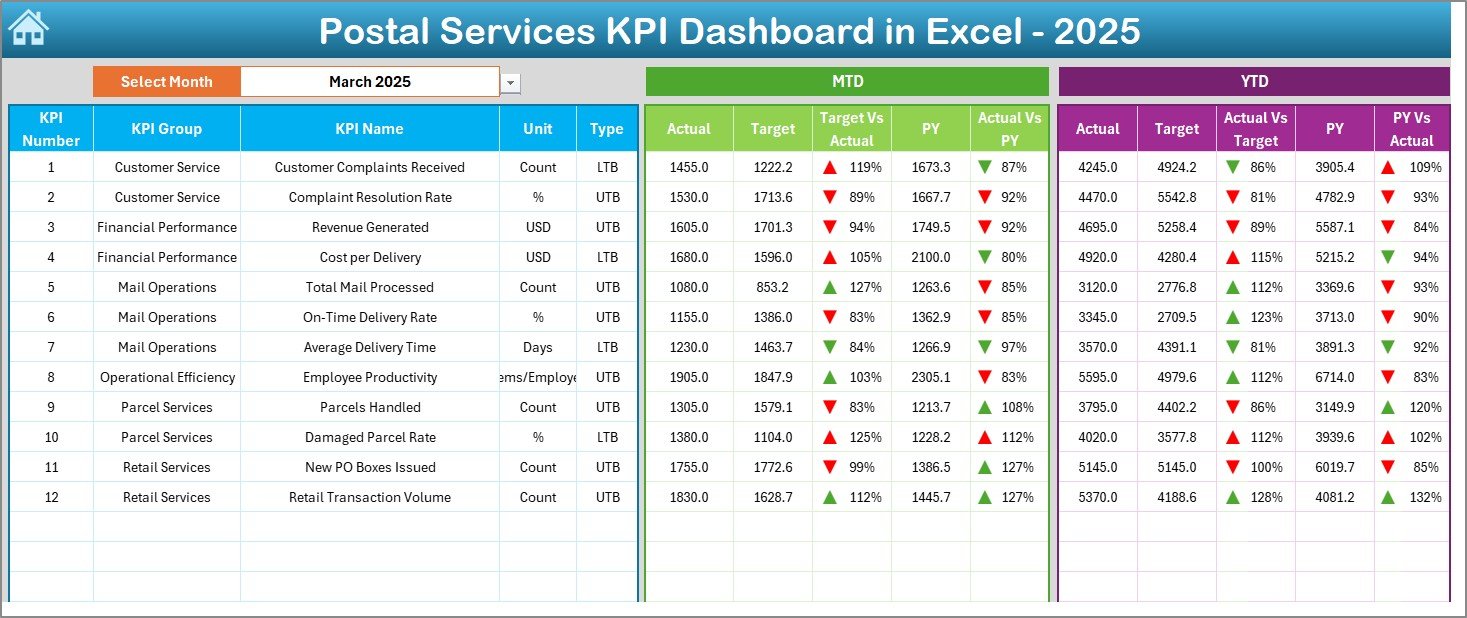
This dashboard transforms scattered reports into a centralized control center. With just one month selection from a drop-down (Cell D3), the entire dashboard updates instantly. You can track MTD, YTD, Target vs Actual, and Previous Year comparisons with clear visual indicators.
No complicated setup. No complex formulas to build. Just structured, professional KPI monitoring in Excel.
🚀 Key Feature of Postal Services KPI Dashboard in Excel
✨ 7 Structured Worksheets – Organized system for Dashboard, Trends, Targets, Actuals, Previous Year, and KPI Definitions.
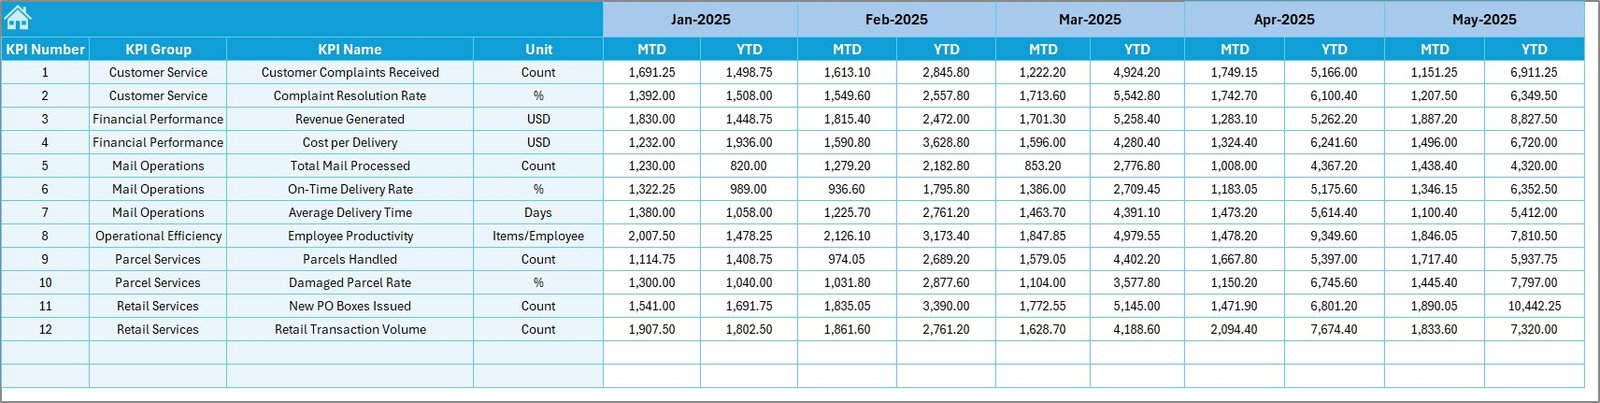
📊 MTD & YTD Performance Tracking – Monitor both short-term and long-term performance instantly.
🎯 Target vs Actual Comparison – Quickly identify underperforming KPIs using conditional formatting arrows.
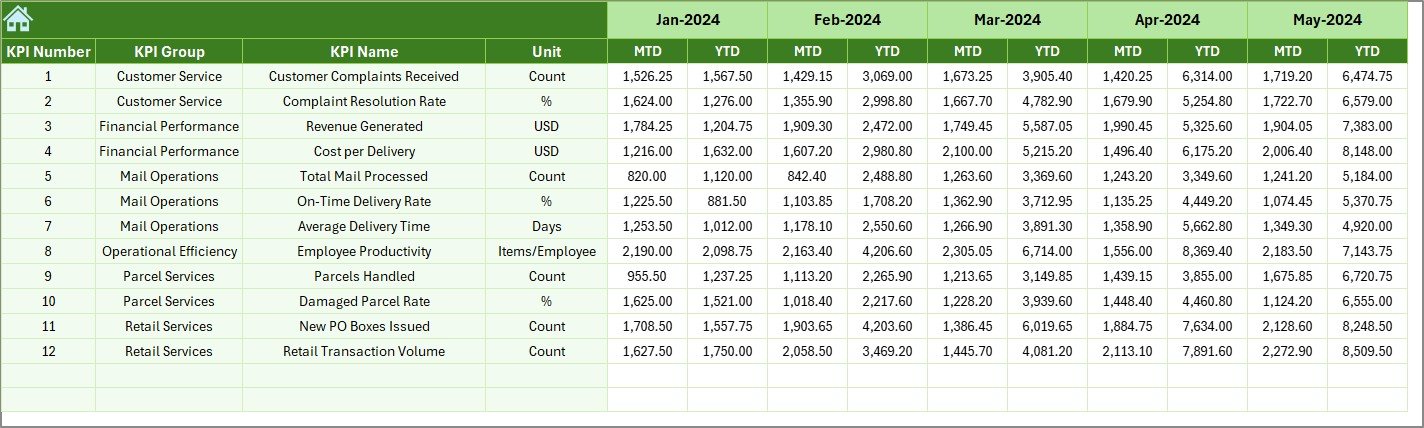
📈 Previous Year Comparison – Analyze year-over-year growth and measure operational improvement.
🔄 Dynamic Month Selection – Select the month from a drop-down and view instant updates.
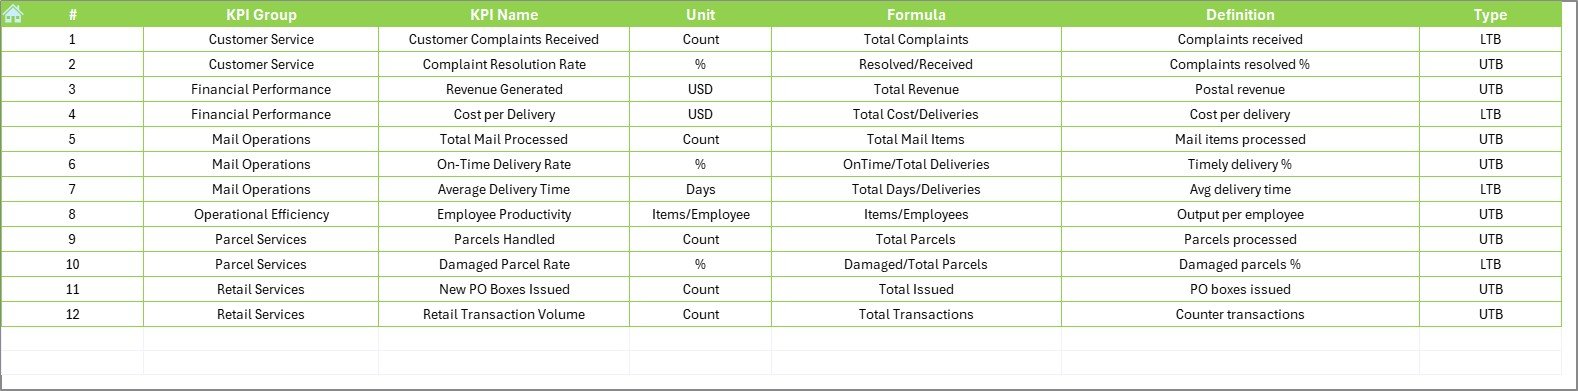
📑 Detailed KPI Documentation – Track KPI Name, Group, Unit, Formula, and Definition in one structured sheet.
🧭 Navigation Home Page – Jump across sheets using quick navigation buttons.
📂 What’s Inside the Postal Services KPI Dashboard in Excel
This ready-to-use Excel file includes 7 powerful worksheets:
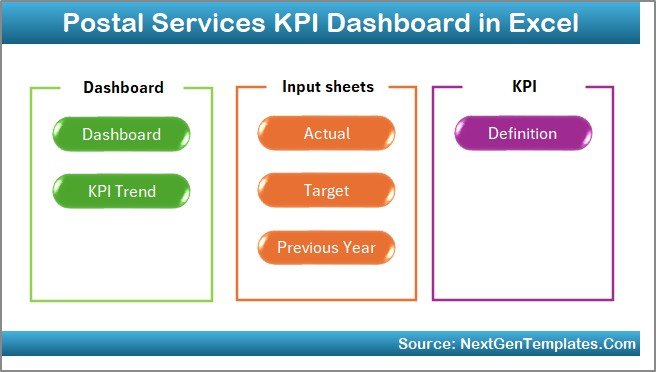
1️⃣ Home Sheet – Navigation center with quick access buttons.
2️⃣ Dashboard Sheet – Main performance overview with MTD & YTD comparison.
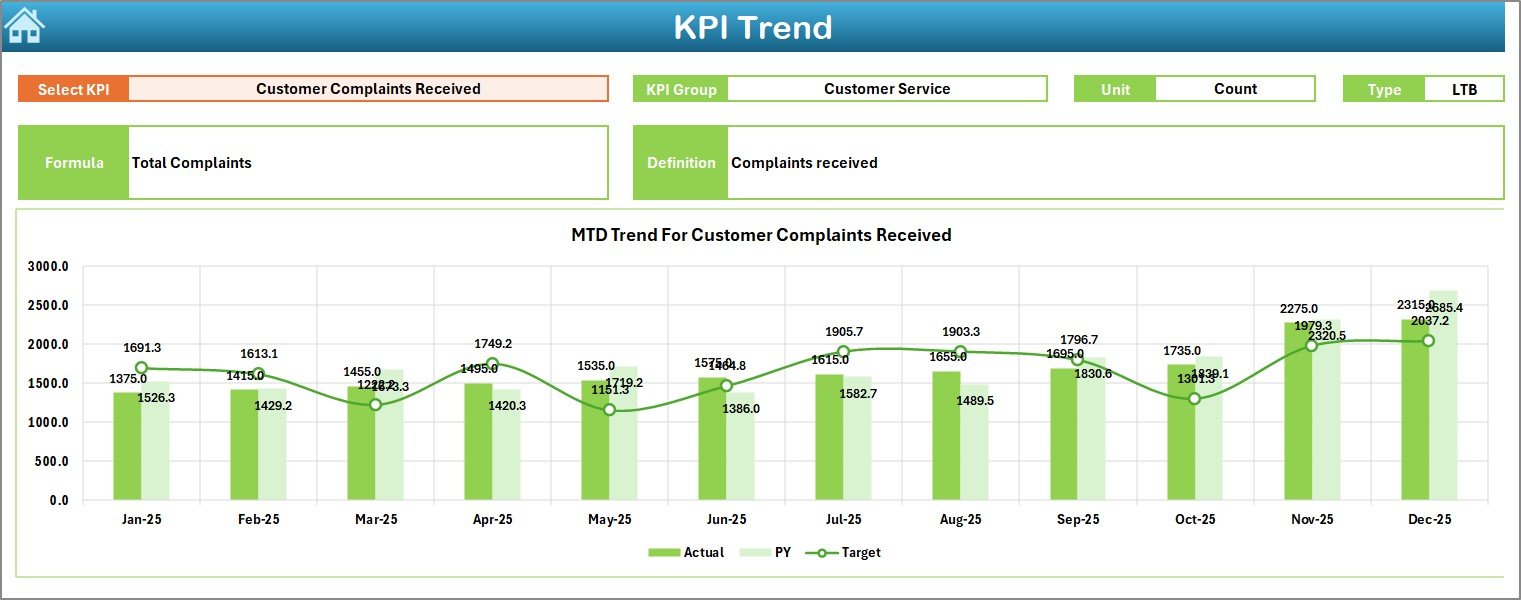
3️⃣ KPI Trend Sheet – Detailed trend charts for selected KPI (Actual vs Target vs Previous Year).
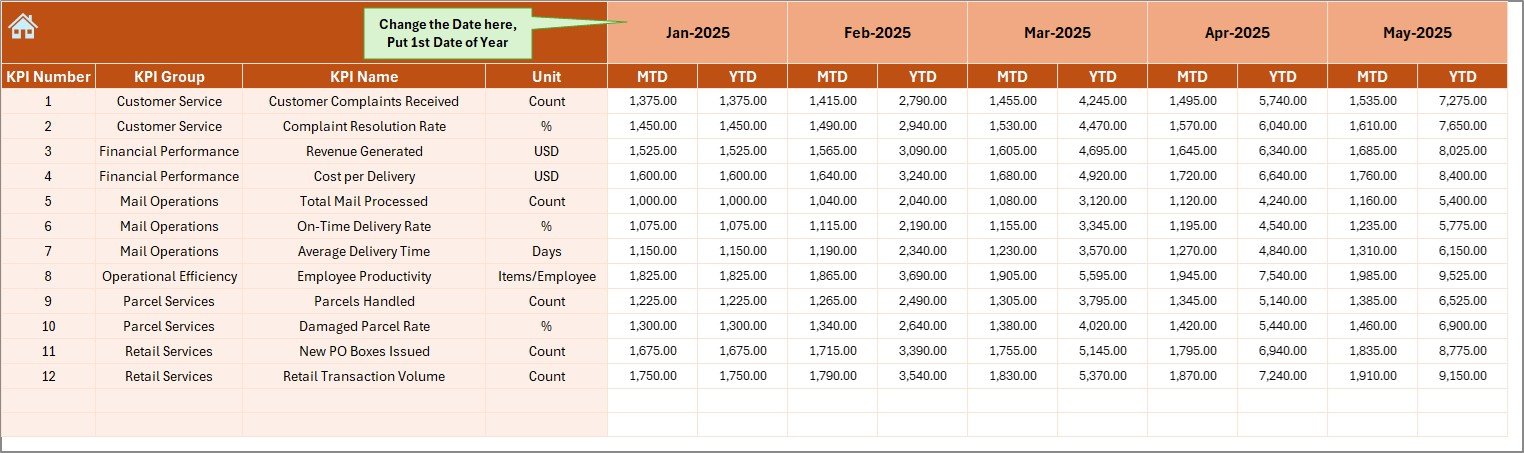
4️⃣ Actual Numbers Input Sheet – Structured input for current year data.
5️⃣ Target Sheet – Planned KPI targets for monthly and yearly tracking.
6️⃣ Previous Year Sheet – Historical data entry for growth analysis.
7️⃣ KPI Definition Sheet – Complete KPI documentation to ensure clarity and consistency.
Everything is structured for clean data flow and accurate reporting.
🛠 How to Use the Postal Services KPI Dashboard in Excel
Using the dashboard is simple:
1️⃣ Enter monthly data in the Actual Numbers Sheet.
2️⃣ Update targets in the Target Sheet.
3️⃣ Add previous year data in the Previous Year Sheet.
4️⃣ Select a month from the drop-down in Cell D3.
5️⃣ Review performance instantly on the Dashboard.
6️⃣ Use the KPI Trend Sheet to analyze patterns and improvement areas.
Because data sheets are separated clearly, updates remain structured and error-free.
👥 Who Can Benefit from This Postal Services KPI Dashboard in Excel
✔ Postal Department Managers
✔ Regional Postal Supervisors
✔ Courier & Logistics Companies
✔ Government Postal Authorities
✔ Operations Managers
✔ Finance & Revenue Analysts
✔ Customer Service Managers
Whether you manage a small branch or a national network, this dashboard helps you track performance professionally.
Why This Dashboard Is a Game-Changer
Instead of reacting late to performance issues, you act early.
Instead of reviewing scattered spreadsheets, you see centralized insights.
Instead of guessing performance, you measure it.
From delivery success rate to revenue per parcel, from complaint resolution time to operational cost per parcel — every important KPI becomes visible and measurable.
If you want stronger control, faster decisions, and improved service performance, this dashboard is your complete postal performance command center.
Click here to read the Detailed blog post
Visit our YouTube channel to learn step-by-step video tutorials
👉 YouTube Channel – PKAnExcelExpert


