Managing international aid projects is not simple. Funds must be monitored. Beneficiaries must be tracked. Donor expectations must be met. And impact must be reported clearly.
Yet many organizations still rely on scattered spreadsheets and manual reports.
What if you could track everything in one structured, automated Excel dashboard?
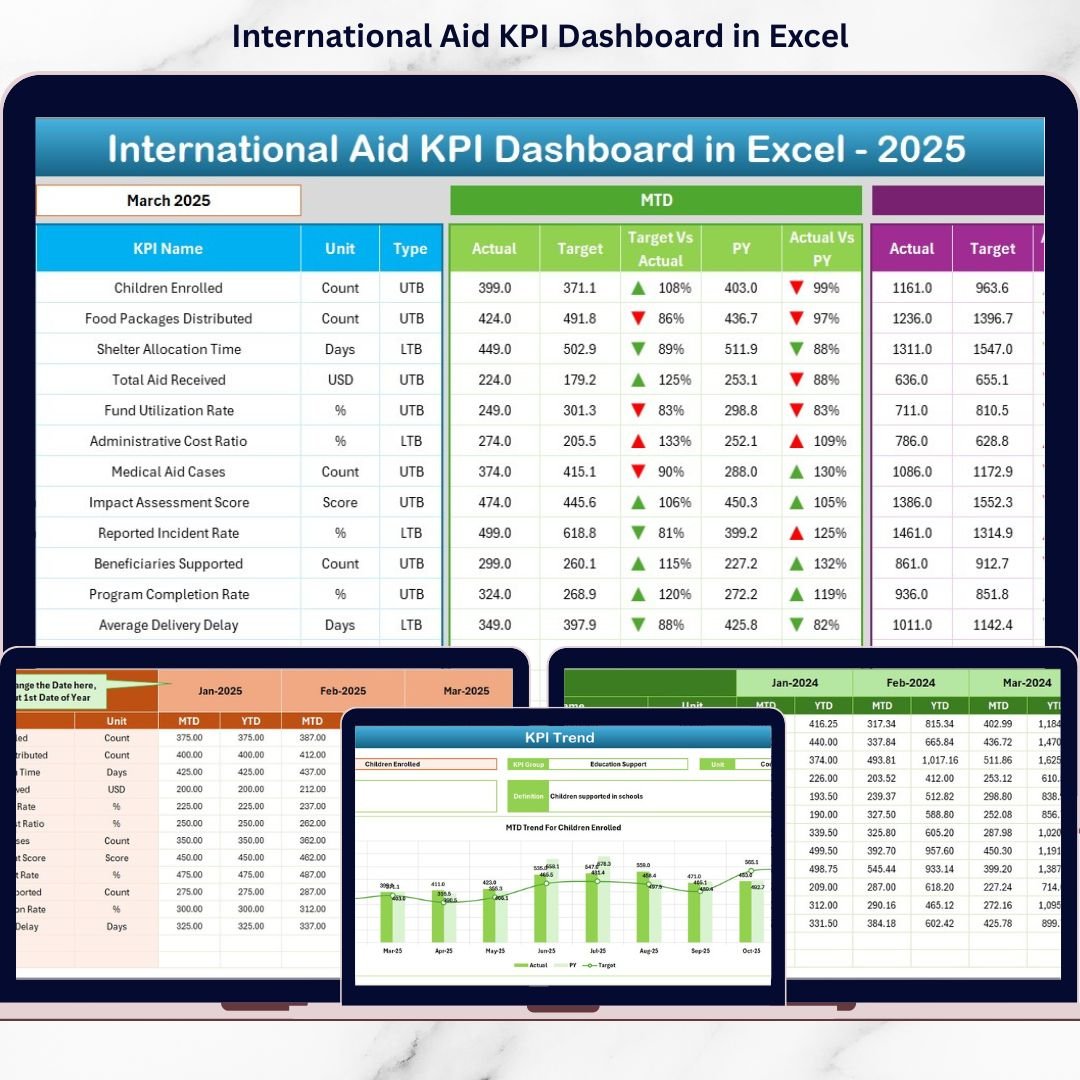
The International Aid KPI Dashboard in Excel is a ready-to-use, professionally designed performance tracking system built specifically for NGOs, humanitarian agencies, donor-funded programs, and development organizations.
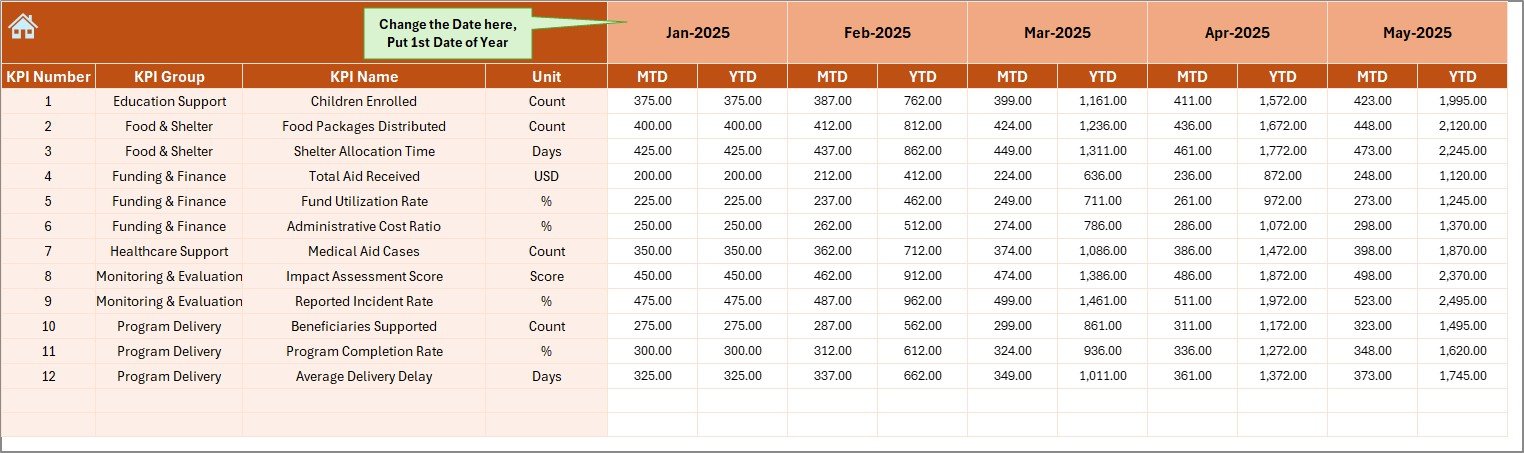
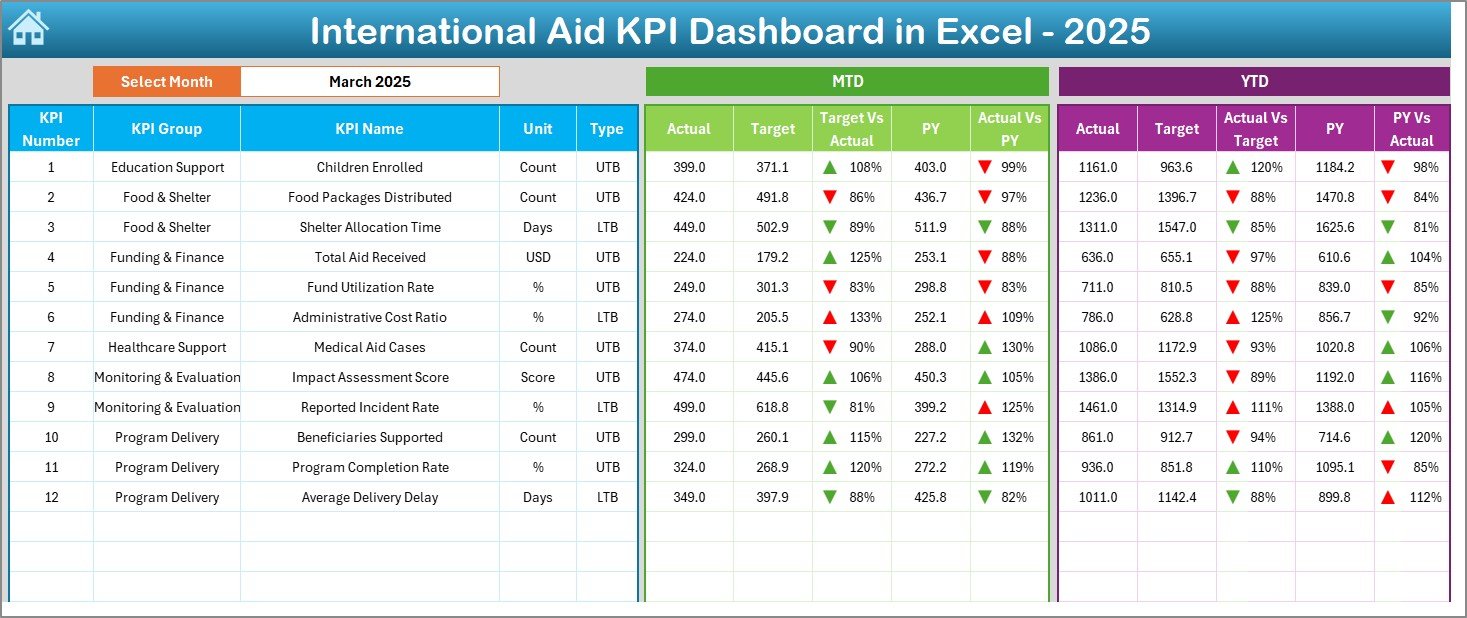
It helps you monitor MTD (Month-to-Date) and YTD (Year-to-Date) performance, compare Actual vs Target, analyze Previous Year trends, and visualize performance using smart indicators — all inside Excel.
No complex software. No technical headaches. Just powerful insights.
🚀 Key Feature of International Aid KPI Dashboard in Excel
✅ 7 Structured Worksheets for complete monitoring control
📊 Interactive Dashboard with automatic month selection (Cell D3)
📈 MTD & YTD Comparisons with Actual, Target & Previous Year
🔺 Conditional Formatting Arrows for instant performance signals
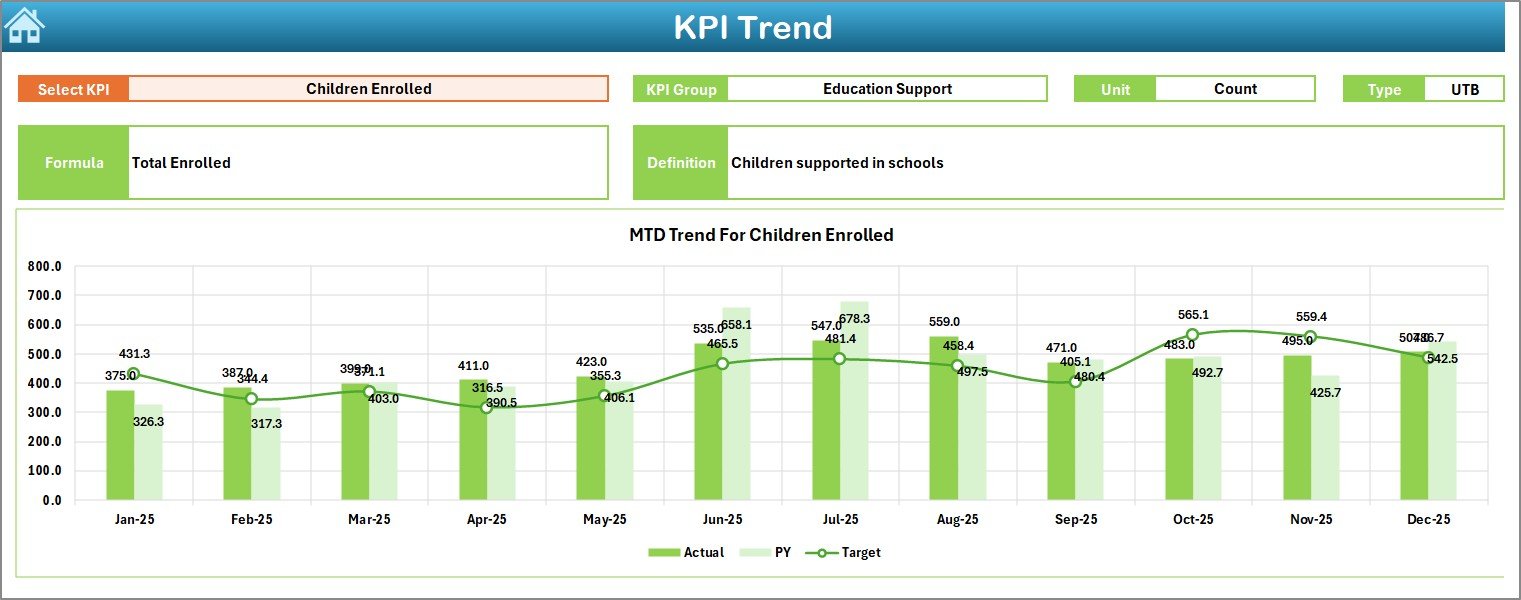
📉 Trend Analysis Sheet with dynamic KPI selection (Cell C3)
🗂️ Separate Data Entry Sheets to reduce formula errors
📘 Centralized KPI Definition Sheet for clarity & documentation
🎯 UTB & LTB KPI Type Support (Upper/Lower the Better)
Everything updates automatically when you select a month. That means leadership gets real-time visibility in seconds.
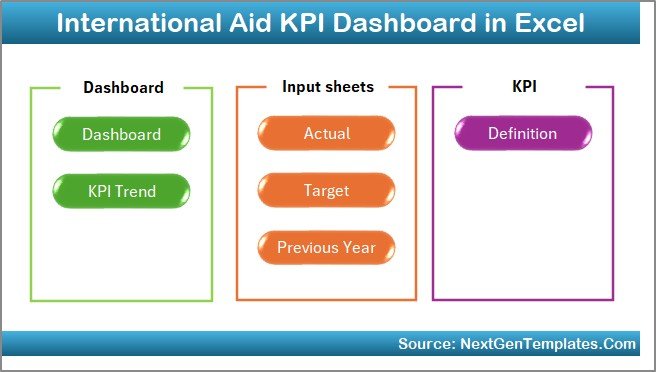
📦 What’s Inside the International Aid KPI Dashboard in Excel
This professional Excel template includes:
1️⃣ Summary Page – Navigation hub with 6 quick buttons
2️⃣ Dashboard Sheet – Complete MTD & YTD performance overview
3️⃣ Trend Sheet – KPI-wise trend charts with detailed definitions
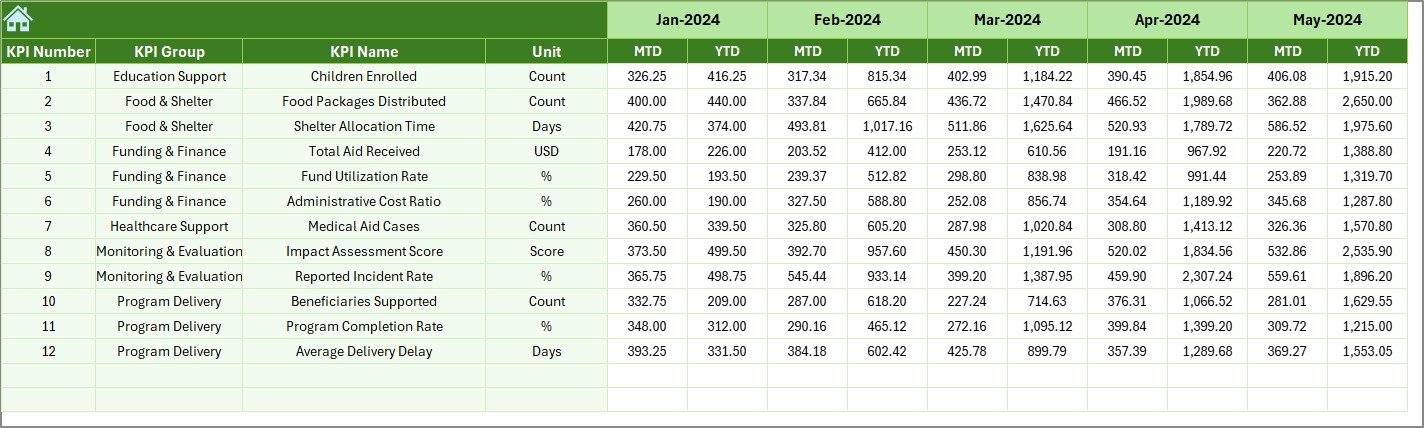
4️⃣ Actual Numbers Input Sheet – Structured MTD & YTD data entry
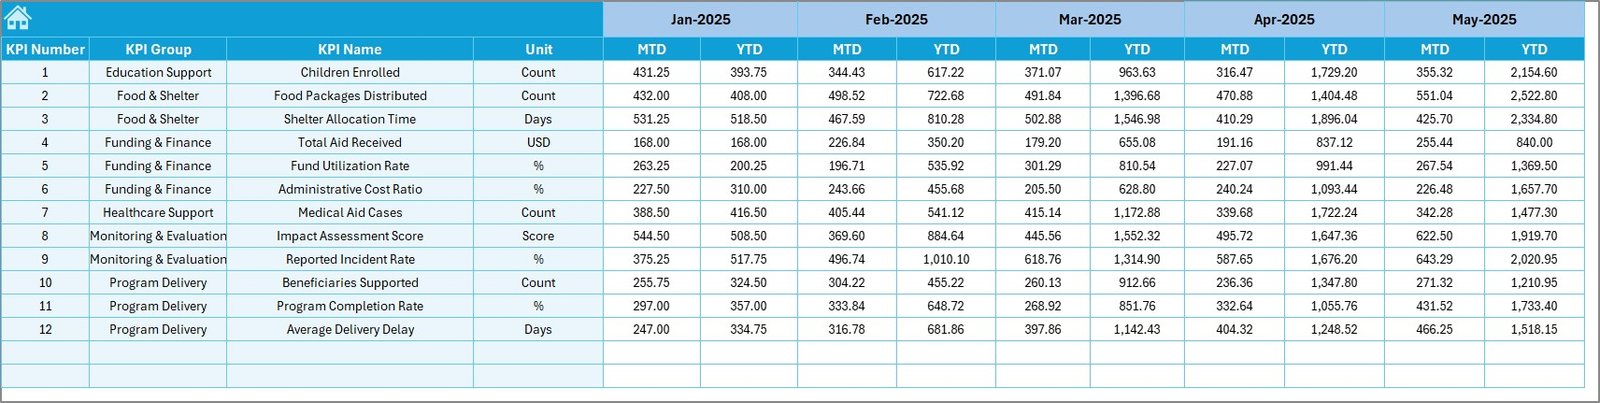
5️⃣ Target Sheet – Monthly goal setting system
6️⃣ Previous Year Sheet – Historical comparison input
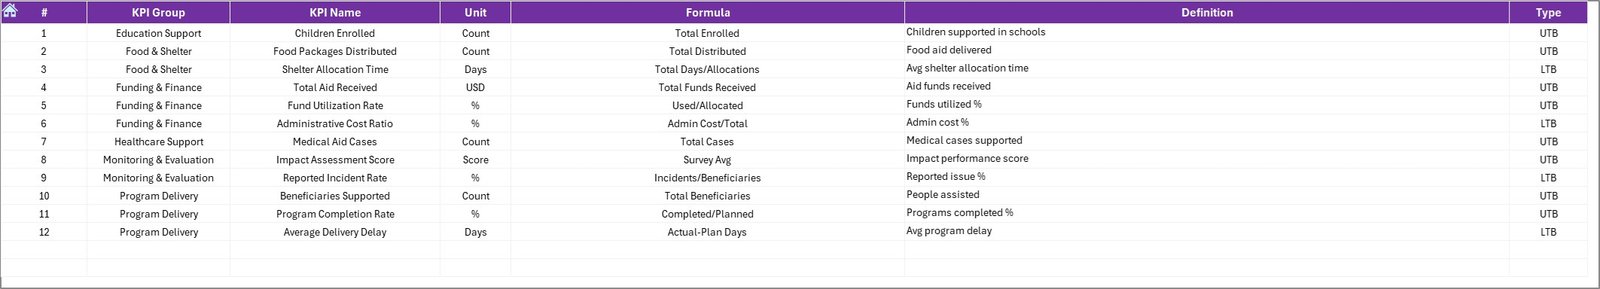
7️⃣ KPI Definition Sheet – KPI Name, Group, Unit, Formula & Definition
Each worksheet is logically structured to ensure smooth workflow and minimal manual effort.
🛠️ How to Use the International Aid KPI Dashboard in Excel
Using this dashboard is simple:
1️⃣ Enter KPI details in the KPI Definition sheet
2️⃣ Add monthly targets in the Target sheet
3️⃣ Input previous year numbers
4️⃣ Enter actual monthly data
5️⃣ Go to Dashboard sheet
6️⃣ Select month from D3
7️⃣ Instantly analyze performance
For deeper insights, go to the Trend sheet and select any KPI from C3 to view detailed MTD and YTD charts.
Even users with basic Excel knowledge can operate this dashboard easily.
🌍 Who Can Benefit from This International Aid KPI Dashboard in Excel
✔ International NGOs
✔ Humanitarian Relief Agencies
✔ UN & Government Aid Programs
✔ CSR Foundations
✔ Development Consultants
✔ Monitoring & Evaluation Teams
✔ Donor Reporting Teams
Whether you manage one project or multiple regions, this dashboard gives you centralized control and professional reporting.
This dashboard improves:
🔍 Transparency
⚡ Decision-making speed
📊 Reporting accuracy
🕒 Time efficiency
📈 Historical performance analysis
🤝 Donor confidence
Instead of reacting late to problems, you identify gaps early and take action immediately.
If you want structured monitoring, clean reporting, and better accountability — this is your complete Excel solution.
Click hare to read the Detailed blog post
Watch the step-by-step video tutorial: