In today’s fast-moving workplace, Knowledge Sharing and Collaboration Dashboard competitive advantage. Teams collaborate across departments, locations, and time zones. However, many companies still track training sessions and collaboration programs using scattered Excel files.
As a result, managers cannot measure session cost accurately. HR teams struggle to analyze satisfaction scores. Leadership cannot see which departments actively contribute to knowledge sharing.
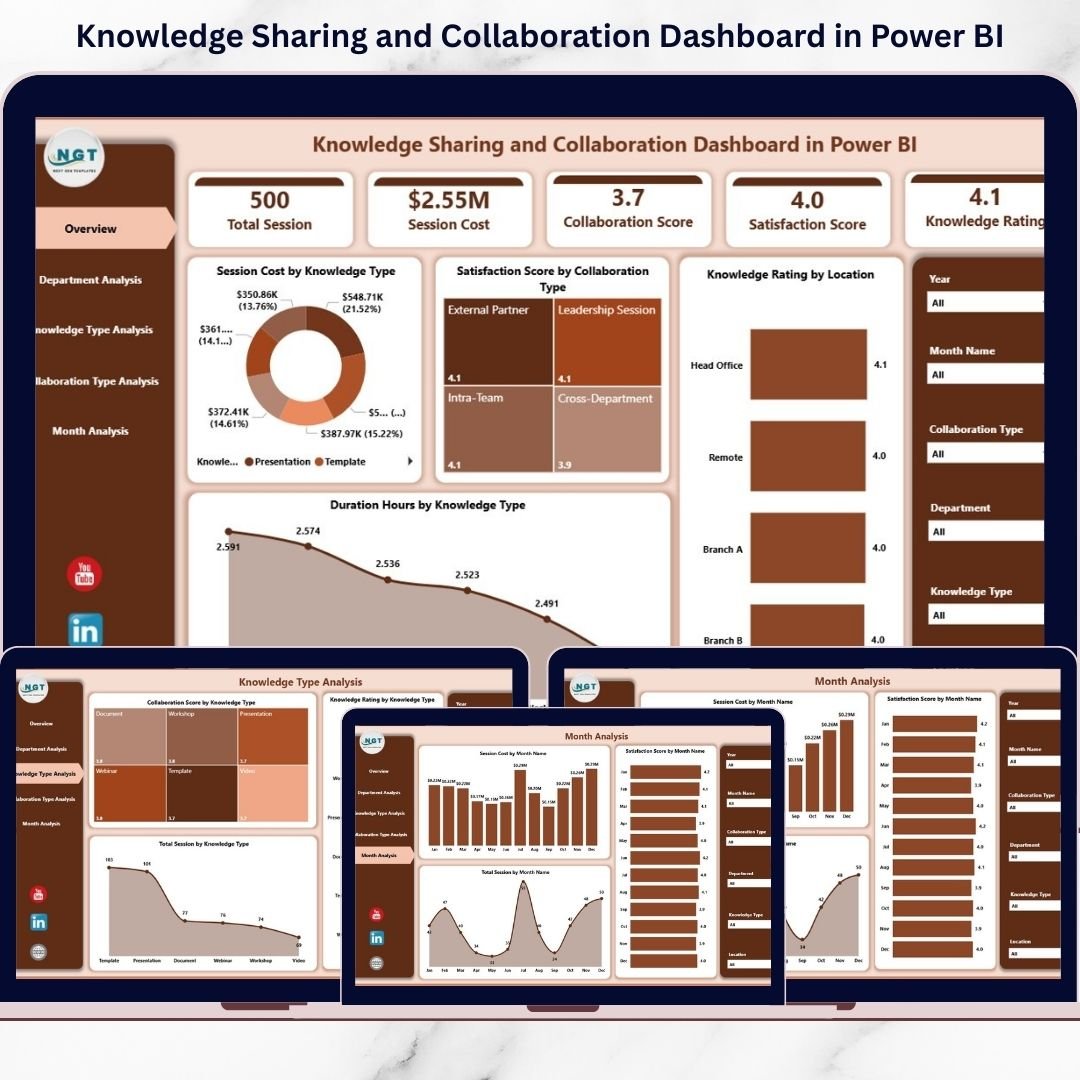
Now imagine tracking Session Cost, Knowledge Rating, Satisfaction Score, Collaboration Type, Duration Hours, and Department Performance — all in one powerful, interactive Power BI dashboard.
That is exactly what the Knowledge Sharing and Collaboration Dashboard in Power BI delivers.
This ready-to-use business intelligence solution transforms raw session data into dynamic visuals, KPI cards, and drill-down insights. As a result, decision-makers gain clarity, improve engagement, and optimize training investments.
Stop guessing the impact of collaboration. Start measuring it.
🚀 Key Features of Knowledge Sharing and Collaboration Dashboard in Power BI
📊 5 Interactive Analytical Pages
🎯 KPI Cards for Instant Performance Overview
🔎 Dynamic Slicers for Department, Month & Location
📈 Trend Analysis for Continuous Improvement
💰 Session Cost Monitoring
🤝 Collaboration Score Tracking
📅 Monthly Performance Insights
⚡ Real-Time Data Refresh
📤 Secure Sharing & Cloud Integration
Built in Power BI, this dashboard offers drill-through capabilities, real-time filtering, and automated calculations — making collaboration measurable and strategic.
📦 What’s Inside the Knowledge Sharing and Collaboration Dashboard in Power BI
This dashboard includes five powerful analytical pages, each designed to measure collaboration effectiveness clearly.
1️⃣ Overview Page – Your Command Center
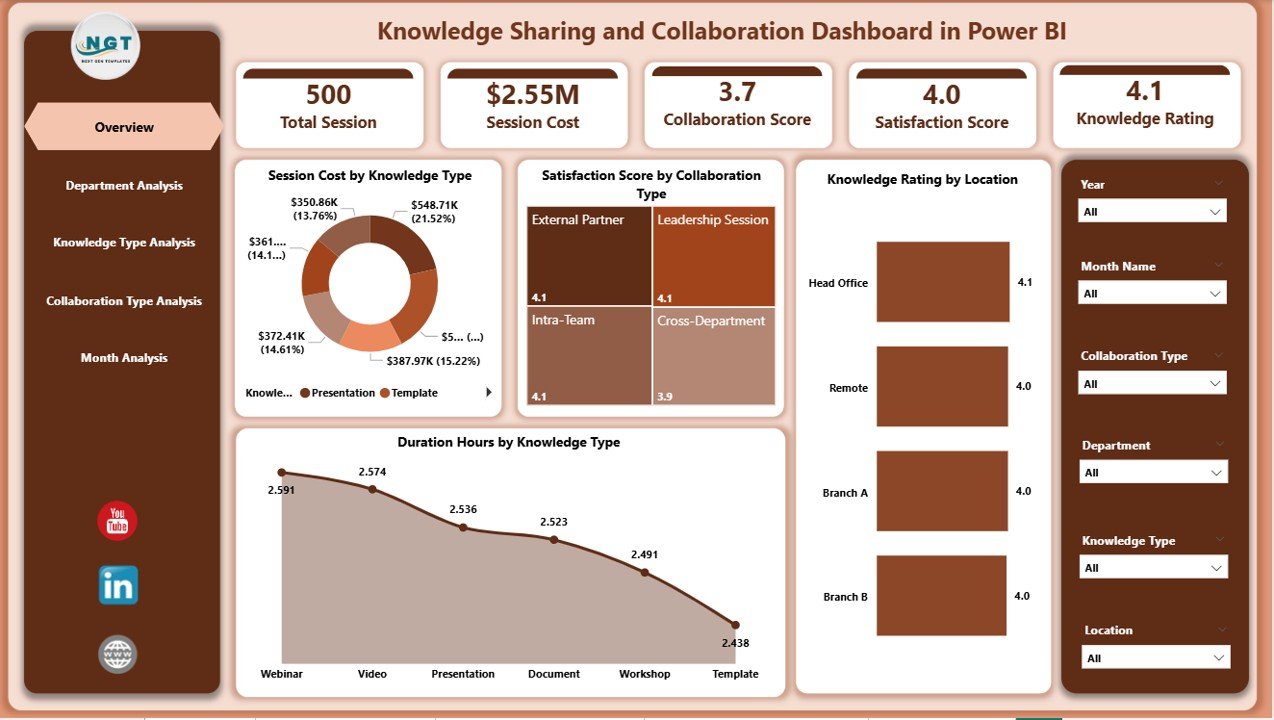
The Overview page provides a snapshot of overall knowledge-sharing performance.
Key Metrics Displayed:
-
Session Cost by Knowledge Type
-
Satisfaction Score by Collaboration Type
-
Knowledge Rating by Location
-
Duration Hours by Knowledge Type
Interactive slicers allow filtering by:
-
Department
-
Month
-
Knowledge Type
-
Collaboration Type
-
Location
Managers can quickly identify cost spikes or satisfaction declines within seconds.
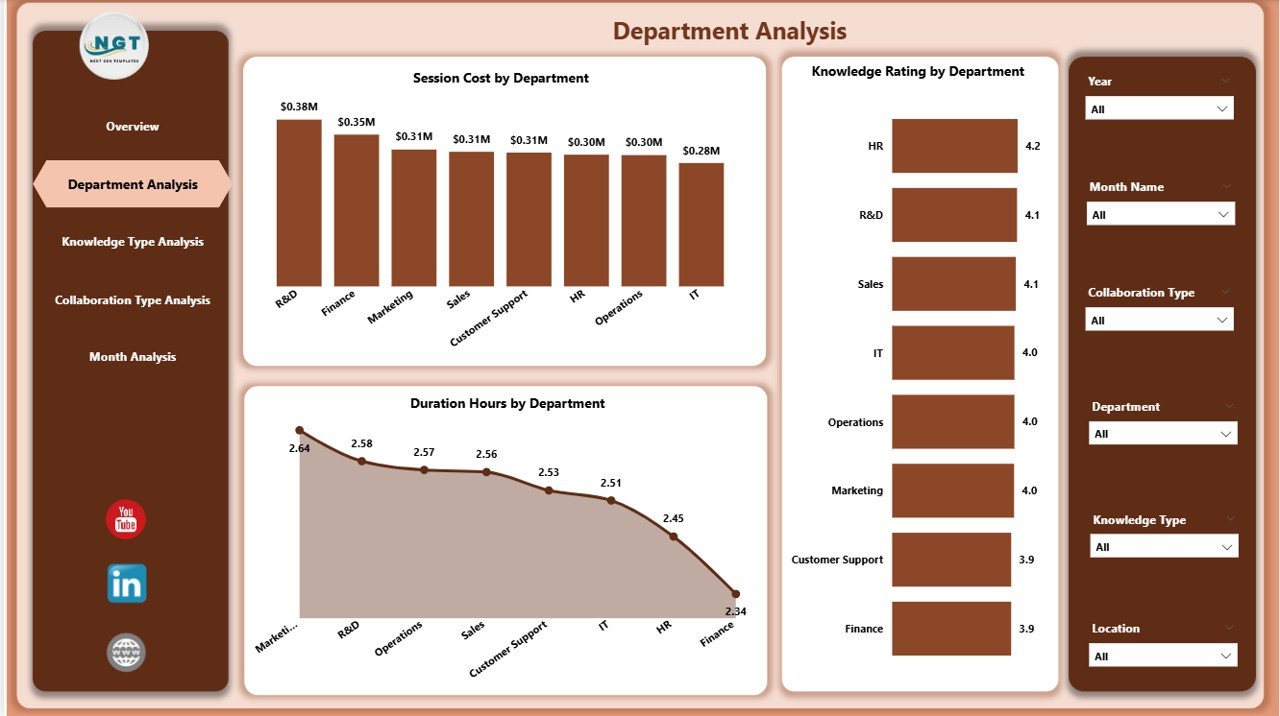
2️⃣ Department Analysis – Team-Level Insights
Compare departments easily.
Track:
-
Session Cost by Department
-
Knowledge Rating by Department
-
Duration Hours by Department
Identify departments that invest heavily but deliver lower satisfaction — and take corrective action.
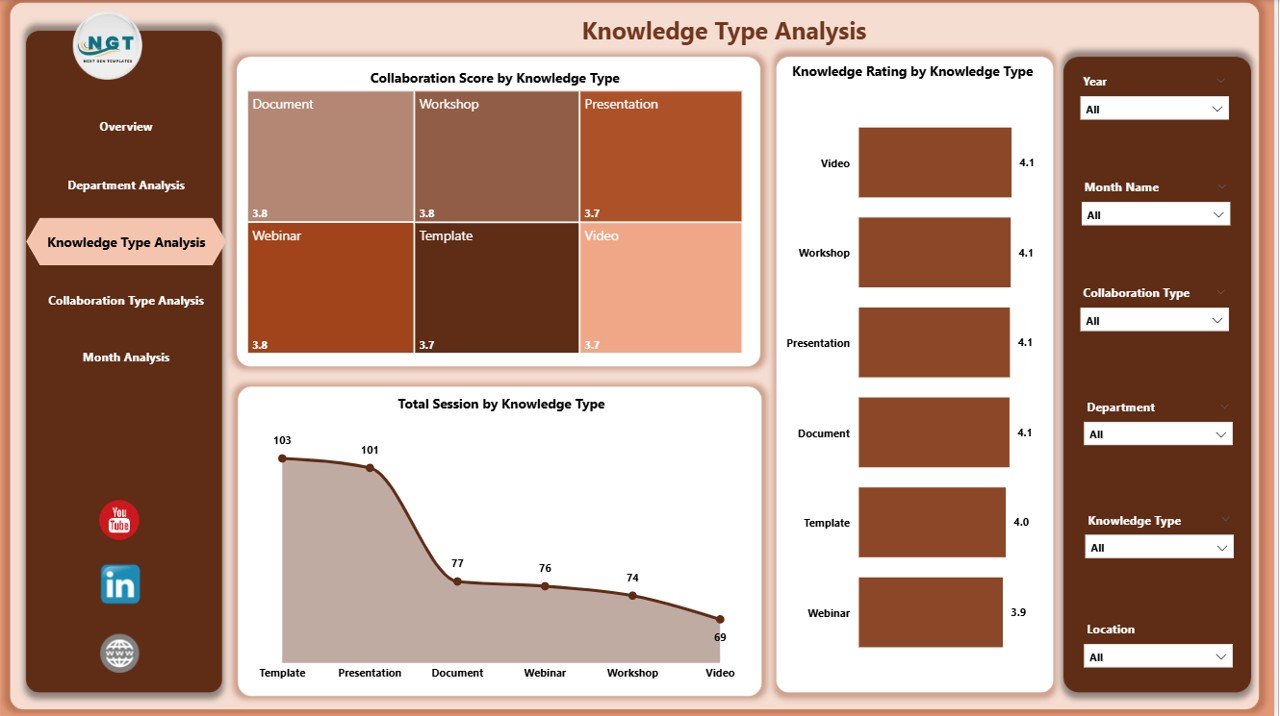
3️⃣ Knowledge Type Analysis – Training Strategy Optimization
Evaluate performance across:
-
Technical Training
-
Soft Skills Workshops
-
Compliance Sessions
-
Leadership Programs
-
Product Training
Charts show:
-
Knowledge Rating by Knowledge Type
-
Collaboration Score by Knowledge Type
-
Total Sessions by Knowledge Type
Focus on high-impact training categories and redesign weaker ones.
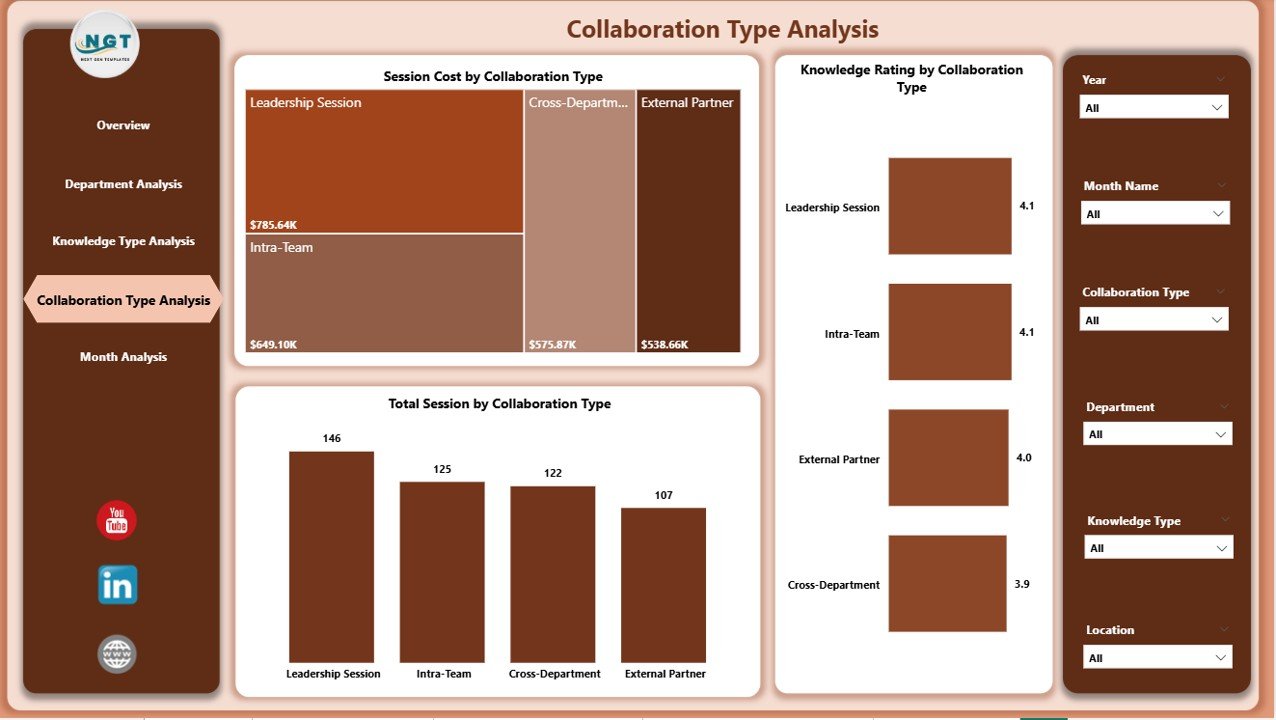
4️⃣ Collaboration Type Analysis – Best Engagement Format
Compare collaboration methods such as:
-
Workshops
-
Webinars
-
Virtual Meetings
-
Group Discussions
-
Brainstorming Sessions
Track:
-
Knowledge Rating by Collaboration Type
-
Session Cost by Collaboration Type
-
Total Sessions by Collaboration Type
Optimize collaboration formats based on cost and satisfaction performance.
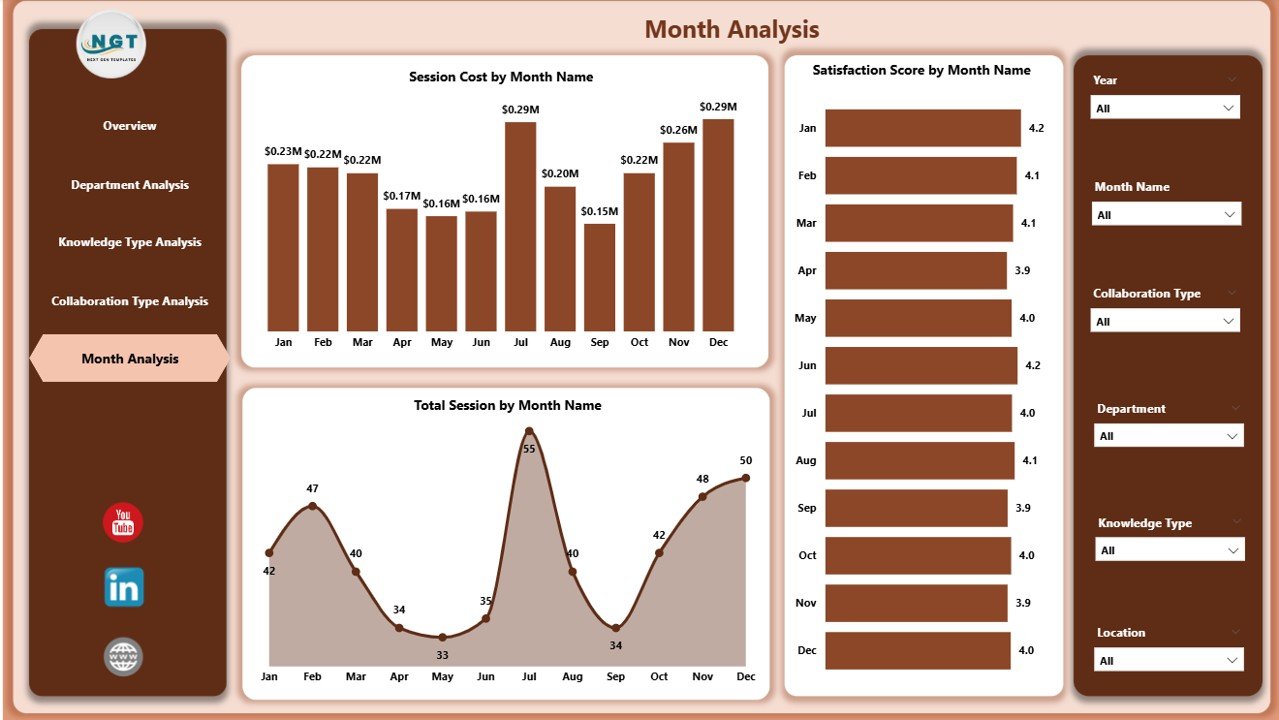
5️⃣ Month Analysis – Performance Trends Over Time
Monitor trends using:
-
Satisfaction Score by Month
-
Session Cost by Month
-
Total Sessions by Month
Identify seasonal patterns, budget usage trends, and engagement fluctuations early.
🛠 How to Use the Knowledge Sharing and Collaboration Dashboard in Power BI
Using this dashboard is simple:
1️⃣ Import structured session data
2️⃣ Refresh the Power BI model
3️⃣ Use slicers to filter analysis
4️⃣ Drill down into specific KPIs
No advanced Power BI skills required. The structure is already designed for business users.
👥 Who Can Benefit from This Knowledge Sharing and Collaboration Dashboard in Power BI
🏢 HR Managers
📚 Learning & Development Teams
📊 Department Heads
👩💼 Corporate Trainers
👨💻 Remote Team Leaders
📈 Senior Management
Whether your organization operates locally or globally, this dashboard supports measurable collaboration tracking.
By using this dashboard, you:
✔ Measure training effectiveness accurately
✔ Monitor employee satisfaction
✔ Control collaboration budgets
✔ Identify knowledge gaps
✔ Improve departmental accountability
✔ Strengthen teamwork culture
✔ Align learning initiatives with business goals
Instead of relying on assumptions, you gain data-driven insights.
This is not just a Power BI file. It is a structured knowledge performance management system designed for modern organizations.
If you want stronger collaboration, improved employee engagement, and measurable training impact — this dashboard provides the clarity you need.