


The floriculture industry blooms with opportunity 🌼🌹. Demand rises during weddings, festivals, Valentine’s season, and export cycles. Prices fluctuate weekly. Transportation costs change frequently. Farm productivity varies by region. Therefore, floriculture businesses must track performance carefully — daily, monthly, and yearly.
However, many growers and flower distributors still rely on scattered spreadsheets. As a result, they miss seasonal spikes. They fail to compare targets with actual sales. They struggle to identify high-margin flower types and underperforming farms.
That is exactly why the Floriculture Dashboard in Excel becomes a powerful solution.
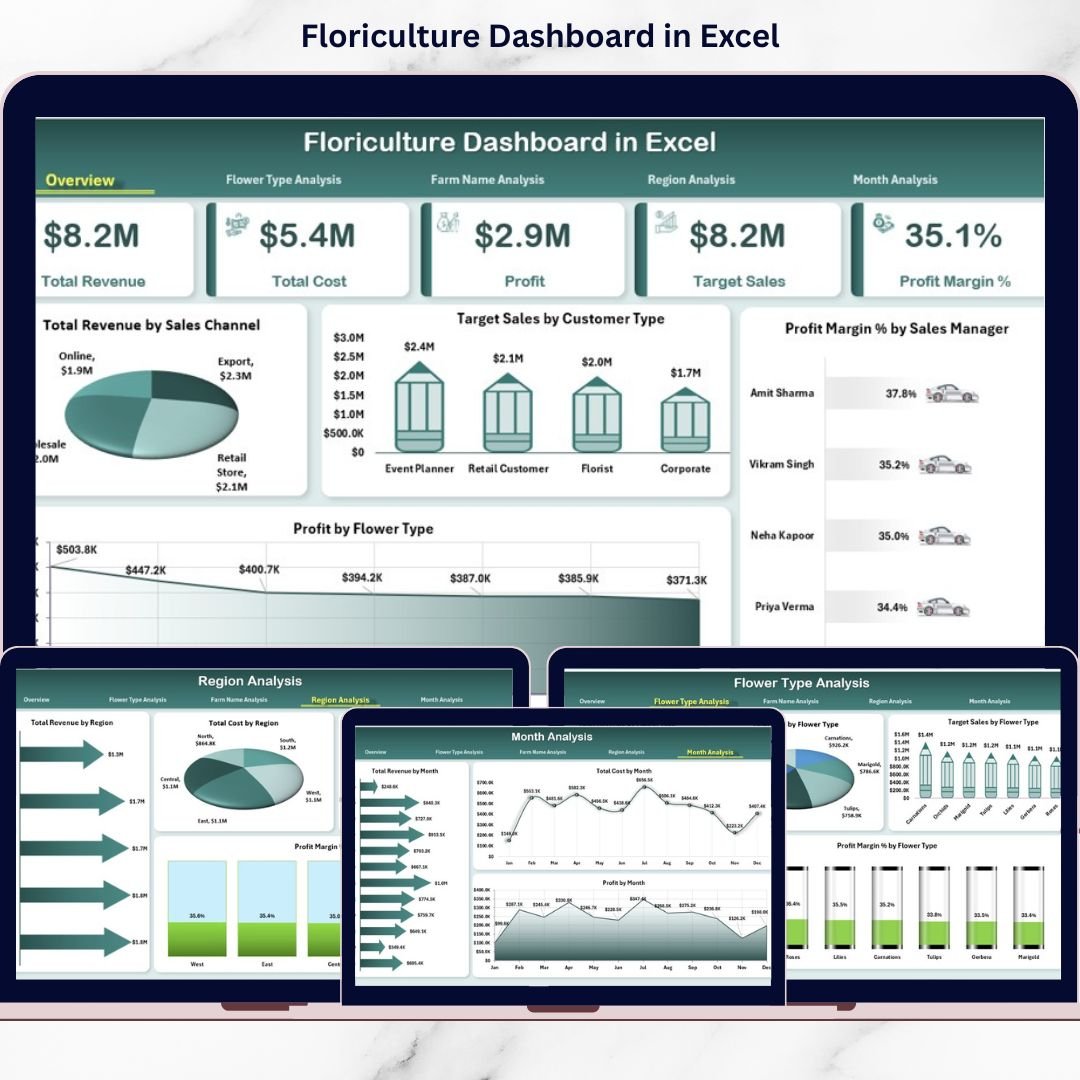
This ready-to-use Excel dashboard transforms raw sales, target, cost, and profit data into structured, interactive insights. Instead of switching between multiple sheets, you can monitor revenue trends, profit margins, farm performance, regional growth, and flower type profitability — all in one centralized system.
Because it is built in Excel using Pivot Tables, Pivot Charts, slicers, and structured tables, you do not need expensive BI tools. You simply update the data sheet, refresh, and the dashboard updates automatically.
If you want clarity, control, and confident decision-making for your flower business, this dashboard is built for you.
🌼 Key Features of Floriculture Dashboard in Excel
📊 5 Interactive Analytical Pages
Track performance from multiple business angles.
🎯 Target vs Actual Sales Comparison
Monitor goal achievement clearly.
💰 Revenue, Cost & Profit Monitoring
Understand financial performance instantly.
📈 Profit Margin % Analysis
Identify high-margin flowers and regions.
🌍 Farm & Region Performance Tracking
Compare operational efficiency easily.
📅 Seasonality & Monthly Trends
Plan production around demand cycles.
🔄 Right-Side Slicers for Dynamic Filtering
Filter by Month, Region, Flower Type, Sales Channel & Manager.
📊 Pivot-Based Structure
All charts are built using Pivot Tables & Pivot Charts.
📦 What’s Inside the Floriculture Dashboard in Excel
This template includes 5 analytical dashboard pages along with Data and Support sheets.
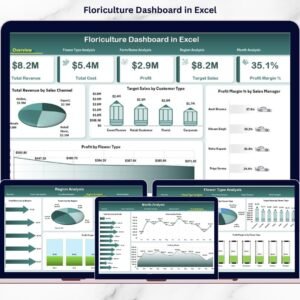
🌸 1️⃣ Overview Page – Executive Snapshot

This is the control center of the dashboard.
🔹 Right-Side Slicer
Filter by:
-
Month
-
Region
-
Flower Type
-
Sales Channel
-
Sales Manager
🔹 KPI Cards
-
Total Revenue
-
Total Cost
-
Total Profit
-
Profit Margin %
These cards give instant visibility into financial health.
🔹 Charts Included
📊 Total Revenue by Sales Channel
Compare Wholesale, Retail, Export, and Online sales.
📊 Target Sales by Customer Type
Track performance for Event Planners, Retailers, Supermarkets, Export Buyers.
📊 Profit Margin % by Sales Manager
Evaluate manager efficiency.
📊 Profit by Flower Type
Identify the most profitable flowers.
Within seconds, leadership can understand business performance.
🌺 2️⃣ Flower Type Analysis – Which Flowers Win?
Track detailed flower performance.
Charts Included:
🌼 Total Revenue by Flower Type
🌼 Target Sales by Flower Type
🌼 Profit Margin % by Flower Type
🌼 Total Cost by Flower Type
You can quickly identify:
✔ High-volume flowers
✔ High-margin flowers
✔ Cost-heavy varieties
✔ Underperforming types
For example, roses may drive volume while orchids drive margin. Now you can balance both strategically.
🌾 3️⃣ Farm Name Analysis – Compare Farms
For businesses operating multiple farms, this page is critical.
Charts Included:
🌱 Total Revenue by Farm
🌱 Profit by Farm
🌱 Profit Margin % by Farm
🌱 Total Cost by Farm
This helps you:
✔ Detect underperforming farms
✔ Improve operational efficiency
✔ Benchmark high-performing farms
🌍 4️⃣ Region Analysis – Optimize Geography
Regional demand and pricing vary significantly.
Charts Included:
🌎 Total Revenue by Region
🌎 Target Sales by Region
🌎 Profit Margin % by Region
🌎 Total Cost by Region
You can:
✔ Identify high-growth regions
✔ Control logistics cost
✔ Strengthen regional distribution strategy
📅 5️⃣ Month Analysis – Seasonality Insights
Floriculture is highly seasonal.
Examples:
💘 Valentine’s Day → Rose demand spikes
💍 Wedding season → Orchid demand rises
🎉 Festival season → Marigold sales increase
Charts Included:
📊 Total Revenue by Month
📊 Profit by Month
📊 Total Cost by Month
This helps you:
✔ Plan inventory
✔ Forecast production
✔ Allocate marketing budget
🗂 Data Sheet Structure
The Data Sheet includes:
-
Invoice Date
-
Month
-
Region
-
Farm Name
-
Flower Type
-
Sales Channel
-
Customer Type
-
Sales Manager
-
Target Sales
-
Actual Revenue
-
Total Cost
-
Profit
-
Profit Margin %
Update this sheet and refresh the dashboard — that’s it.
⚙ How to Use the Floriculture Dashboard in Excel
1️⃣ Enter sales & cost data in Data Sheet
2️⃣ Ensure structured table format
3️⃣ Refresh Pivot Tables
4️⃣ Use slicers to filter by Month/Region
5️⃣ Review Overview page
6️⃣ Analyze Flower, Farm & Region pages
7️⃣ Review Month trends
8️⃣ Take action based on insights
Within minutes, you gain full business visibility.
👥 Who Can Benefit from This Dashboard?
🌹 Flower Growers
🌷 Exporters
🌼 Wholesale Distributors
🌸 Retail Flower Chains
🌿 Farm Owners
📦 Event Flower Suppliers
Whether small farm or large exporter, this template scales easily.
🚀 Advantages of Floriculture Dashboard in Excel
✅ Centralized performance tracking
✅ Faster decision-making
✅ Better cost control
✅ Improved farm comparison
✅ Clear seasonal planning
✅ Easy customization
✅ No expensive software required
Because it runs entirely in Excel, implementation is simple and cost-effective.
📈 Best Practices for Maximum Results
✔ Keep data clean and structured
✔ Update data weekly or monthly
✔ Review high-margin flowers regularly
✔ Monitor seasonal patterns
✔ Conduct monthly performance meetings
✔ Compare targets consistently
✔ Focus on cost-heavy farms
Consistent review leads to consistent growth.
### Click here to read the Detailed blog post
🔗 Visit our YouTube channel to learn step-by-step video tutorials
👉 https://youtube.com/@PKAnExcelExpert