Forestry operations require structured planning, clear visibility, and continuous monitoring. However, many forestry businesses still rely on scattered spreadsheets. As a result, managers struggle to track harvesting performance, revenue, cost, and profitability in one place. They miss key trends. They lose control over regional efficiency and plantation performance.
That is exactly why the Forestry Dashboard in Excel becomes a powerful operational tool 🌲📊.
This ready-to-use Excel dashboard transforms raw forestry data into structured, visual insights using Pivot Tables, Pivot Charts, and interactive slicers. Instead of reviewing multiple sheets, you get one centralized system to monitor harvested forest percentage, revenue, cost, profit margin, and performance by forest type, plantation type, tree species, and month.
Because it runs fully in Excel, you do not need expensive software or complex systems. You only need structured data — and the dashboard does the rest.
🔑 Key Features of Forestry Dashboard in Excel
🌲 Harvested Forest % Tracking
Monitor operational harvesting efficiency clearly.
💰 Revenue, Cost & Profit Analysis
Track financial performance in one centralized dashboard.
📊 Forest Type & Plantation Type Insights
Compare performance across forest and plantation categories.
🌍 Regional Profitability Monitoring
Analyze profit margin by region for better decision-making.
📅 Monthly Trend Analysis
Review revenue, cost, and margin movement over time.
🎛️ Interactive Slicers for Filtering
Filter data instantly by region, forest type, manager, and species.
📂 5 Analytical Pages + Data & Support Sheets
Structured layout for smooth navigation and scalability.
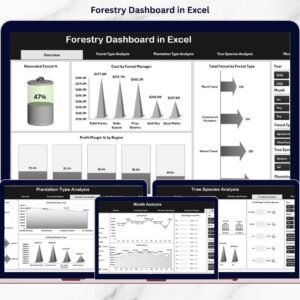
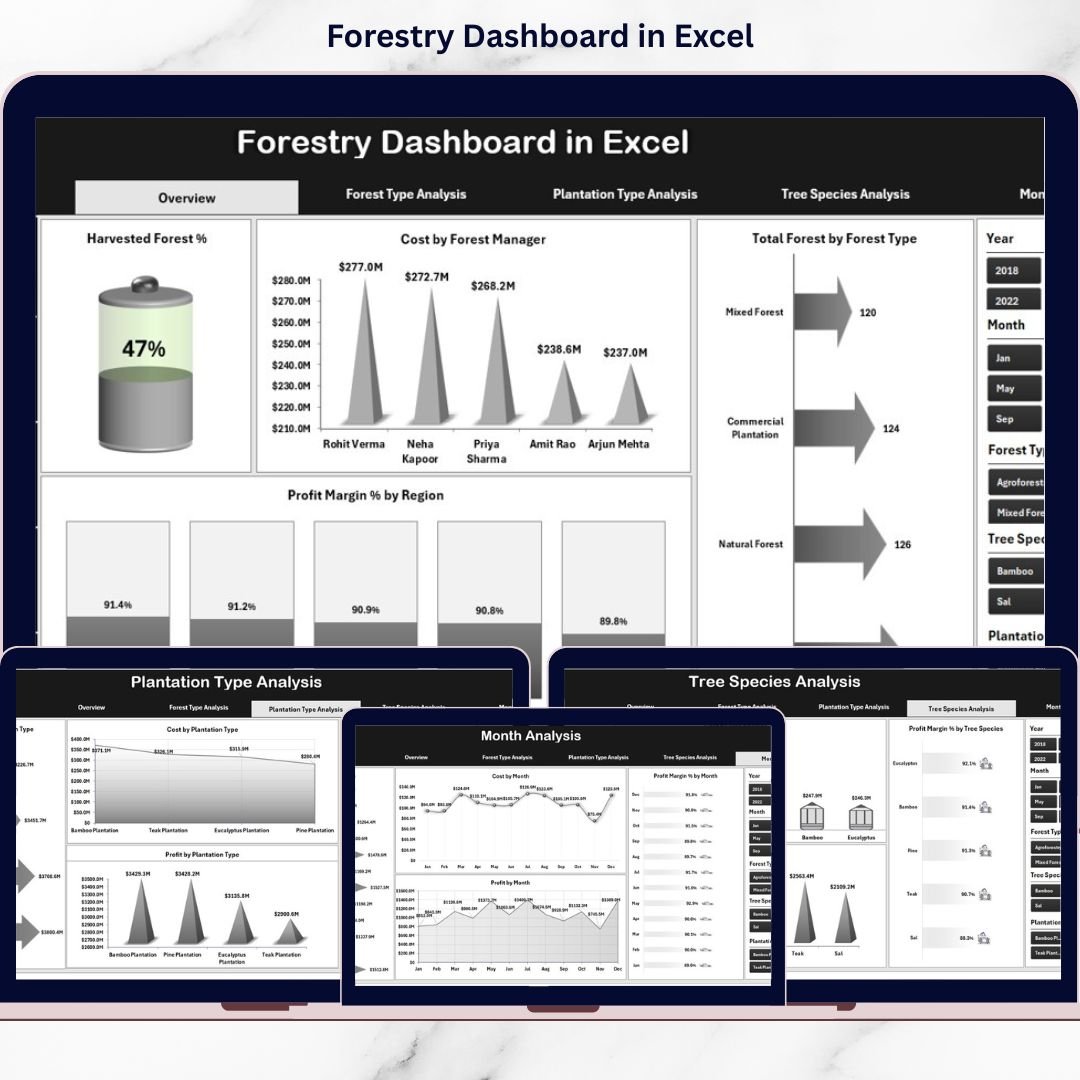
📦 What’s Inside the Forestry Dashboard in Excel
This dashboard includes 5 analytical pages, supported by Data and Support sheets.
1️⃣ Overview Page – Executive Snapshot
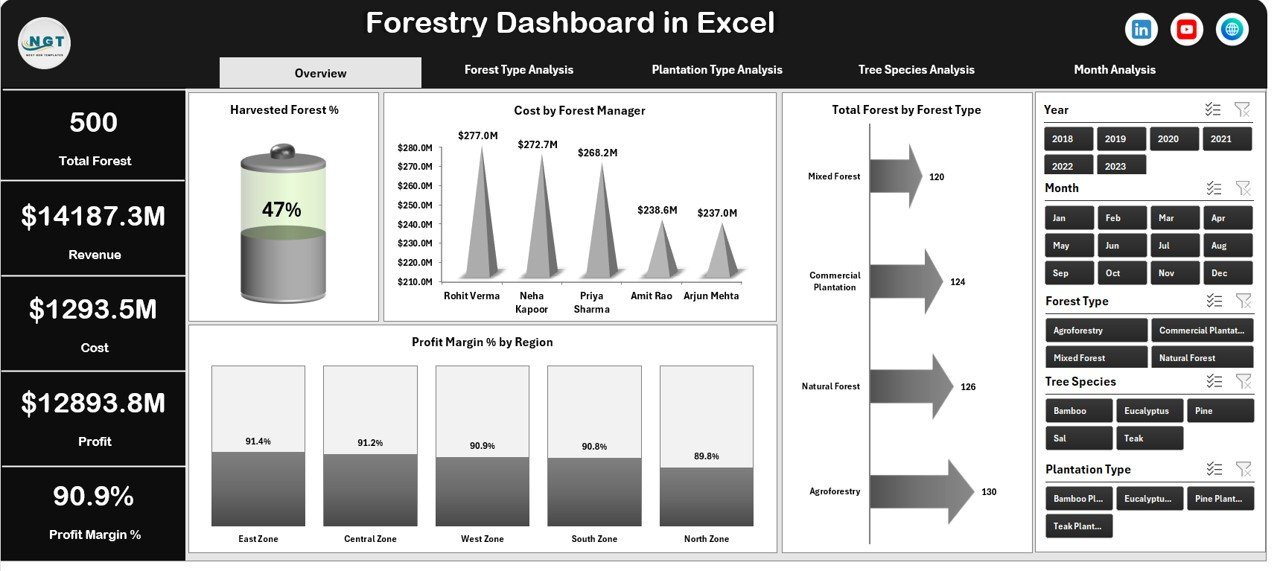
This is the central control panel.
🔹 4 KPI Cards:
-
Total Revenue
-
Total Cost
-
Total Profit
-
Harvested Forest %
🔹 4 Pivot Charts:
-
Harvested Forest %
-
Cost by Forest Manager
-
Total Forest by Forest Type
-
Profit Margin % by Region
This page provides high-level performance visibility within seconds.
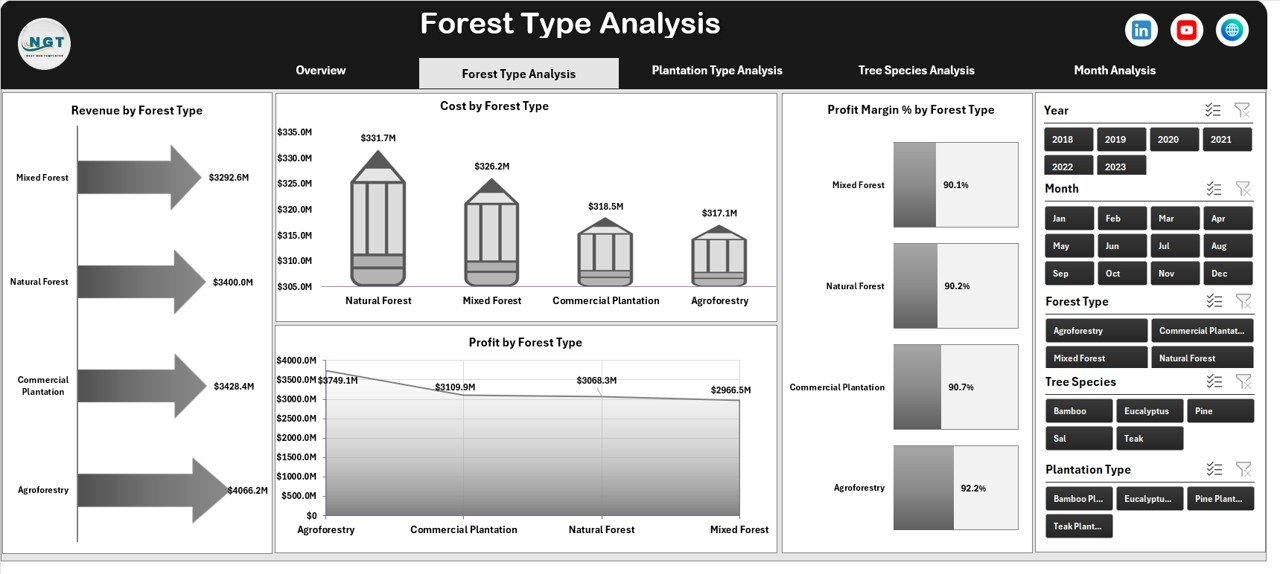
2️⃣ Forest Type Analysis Page
Compare different forest categories such as:
Natural Forest
Plantation Forest
Mixed Forest
Bamboo Forest
🔹 Charts Included:
-
Revenue by Forest Type
-
Cost by Forest Type
-
Profit Margin % by Forest Type
-
Profit by Forest Type
Identify which forest type delivers the best financial return.
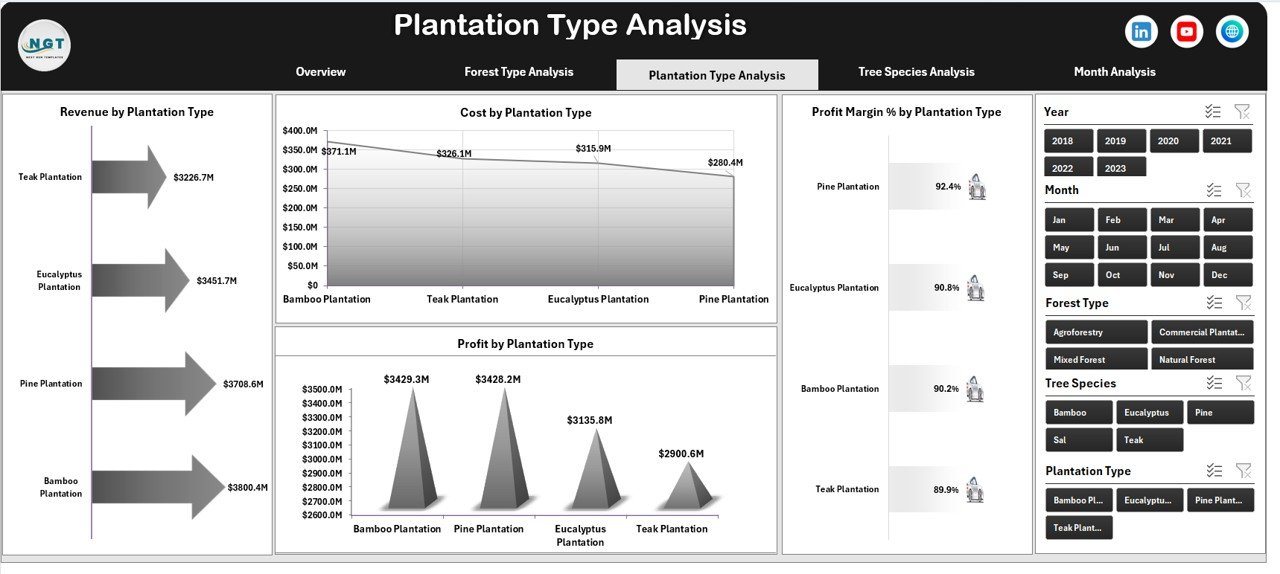
3️⃣ Plantation Type Analysis Page
Analyze plantation strategies such as:
Commercial Plantation
Agroforestry
Timber Plantation
Reforestation Projects
🔹 Charts Included:
-
Revenue by Plantation Type
-
Cost by Plantation Type
-
Profit Margin % by Plantation Type
-
Profit by Plantation Type
Make long-term investment decisions with confidence.
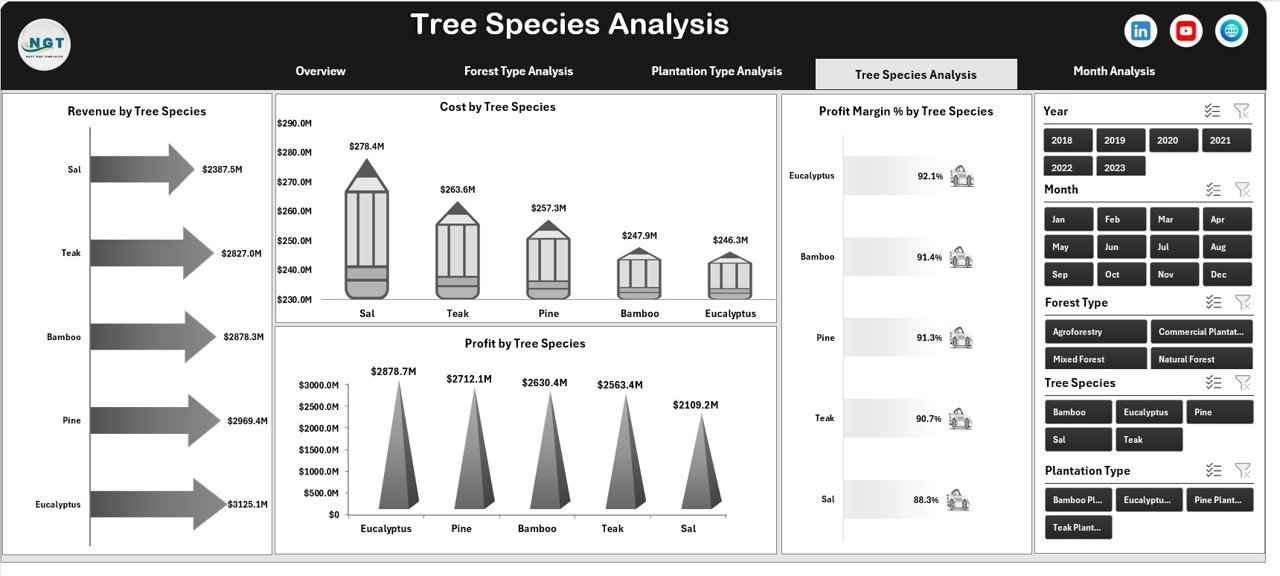
4️⃣ Tree Species Analysis Page
Evaluate species profitability.
Examples:
Teak
Eucalyptus
Pine
Bamboo
Sal
🔹 Charts Included:
-
Revenue by Tree Species
-
Cost by Tree Species
-
Profit Margin % by Tree Species
-
Profit by Tree Species
Focus on high-value species and reduce costly cultivation.
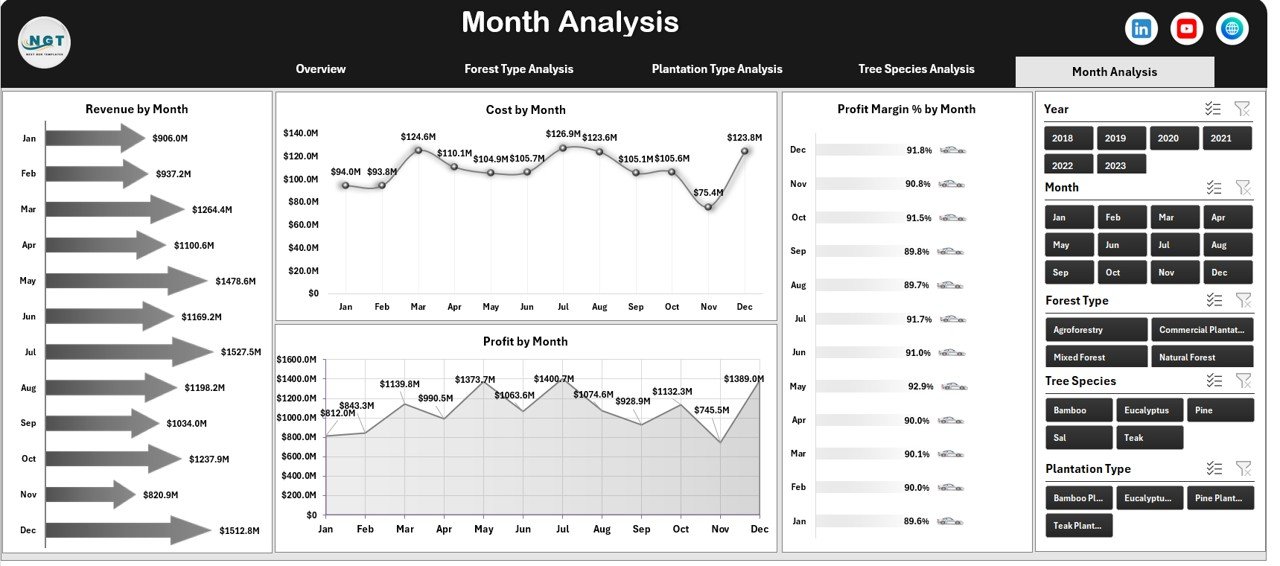
5️⃣ Month Analysis Page
Track seasonal performance.
🔹 Charts Included:
-
Revenue by Month
-
Cost by Month
-
Profit Margin % by Month
-
Profit by Month
Plan harvesting, budgeting, and expansion strategically.
🛠️ How to Use the Forestry Dashboard in Excel
1️⃣ Enter structured forestry data in the Data Sheet
2️⃣ Ensure columns include Date, Region, Forest Type, Plantation Type, Tree Species, Revenue, Cost, Profit
3️⃣ Refresh Pivot Tables
4️⃣ Use slicers to filter by month, region, or species
5️⃣ Review KPI cards and charts
6️⃣ Identify underperforming areas
7️⃣ Take corrective action
Within minutes, your forestry data becomes actionable insight.
👥 Who Can Benefit from This Forestry Dashboard in Excel
🌲 Forestry Companies
🏭 Timber & Plantation Businesses
🌍 Environmental & Land Management Agencies
📊 Operations Managers
💰 Financial Controllers
📦 Regional Forest Managers
If you manage forestry revenue, harvesting operations, or plantation performance, this dashboard strengthens decision-making.