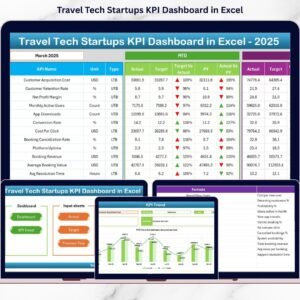
Travel tech startups move fast—but scattered spreadsheets, manual reports, and unclear KPIs can slow growth instantly. If your team still struggles to track performance across bookings, revenue, operations, and customer experience, this Travel Tech Startups KPI Dashboard in Excel is the smart upgrade you need.
This ready-to-use Excel KPI dashboard helps founders, operations teams, and growth leaders monitor critical startup KPIs in one structured, interactive, and visually clear system. Instead of spending hours preparing reports, you get instant MTD, YTD, and trend-based insights—all inside Microsoft Excel.
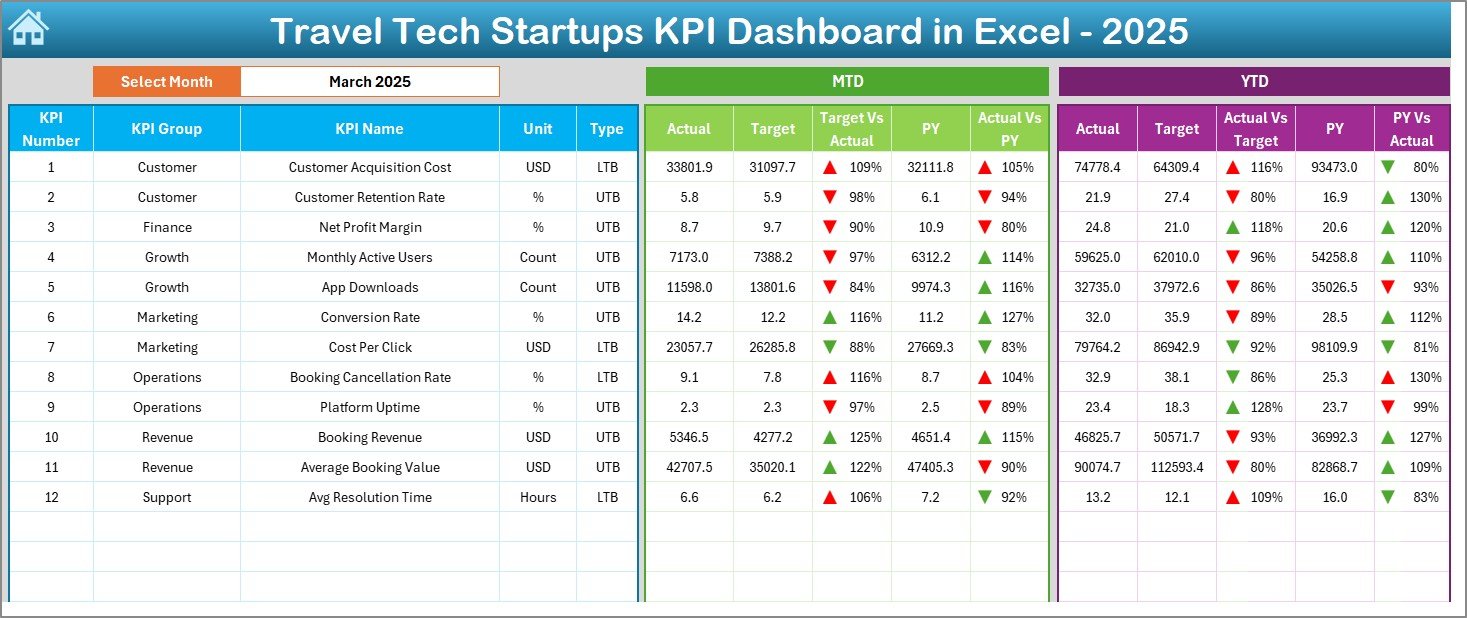
Designed specifically for travel technology startups, this dashboard transforms raw numbers into actionable insights so you can scale faster, smarter, and with confidence.
🚀 Key Features of Travel Tech Startups KPI Dashboard in Excel
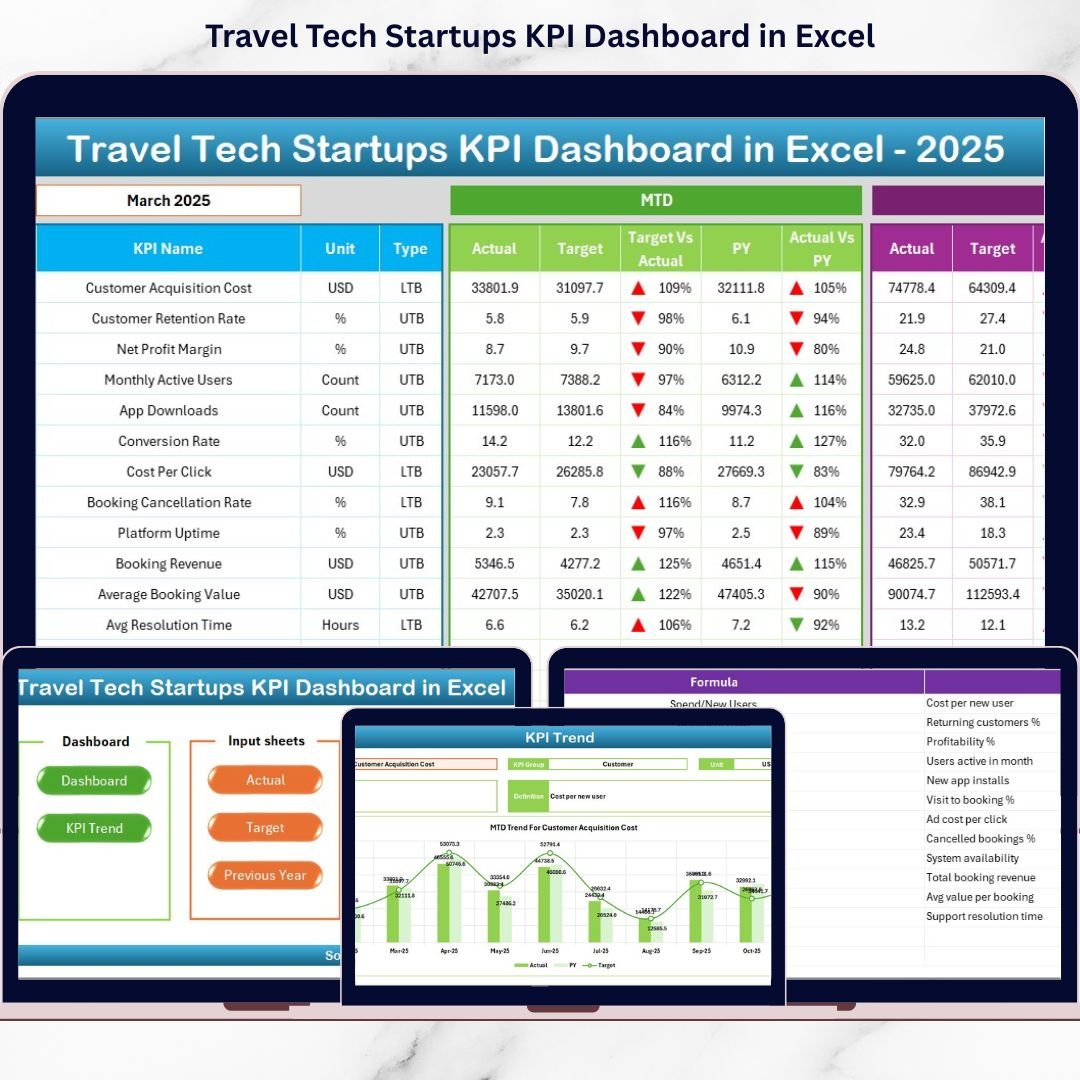
📈 MTD & YTD Performance Tracking
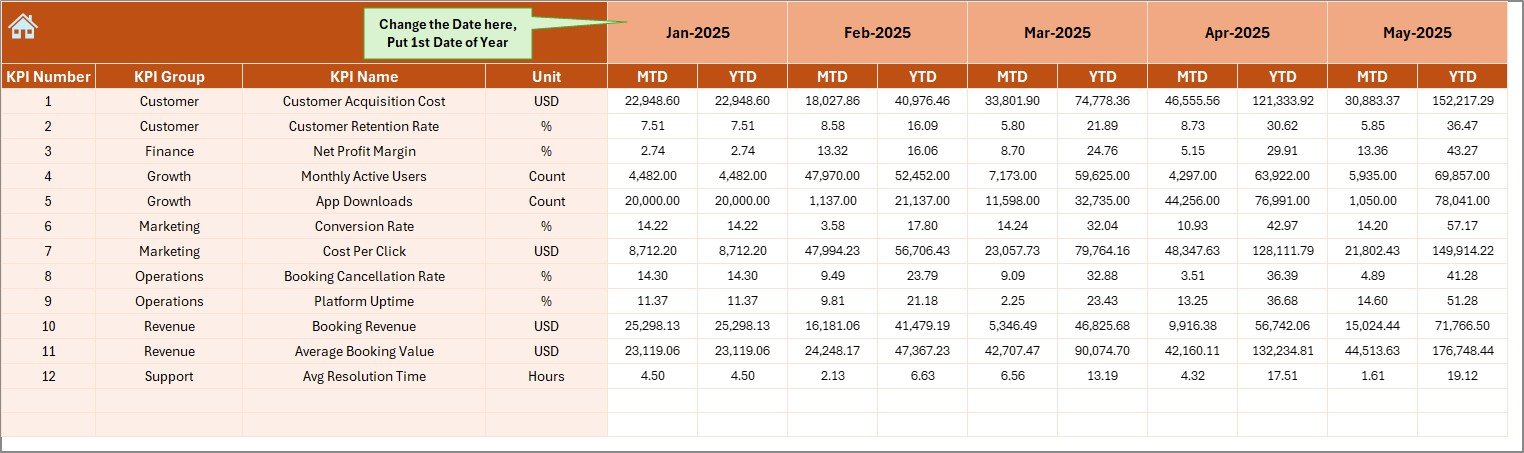
Track Month-to-Date and Year-to-Date KPIs side by side to understand short-term execution and long-term growth.
🎯 Actual vs Target vs Previous Year Comparison
Instantly compare actual performance against targets and last year’s numbers to identify gaps and opportunities.
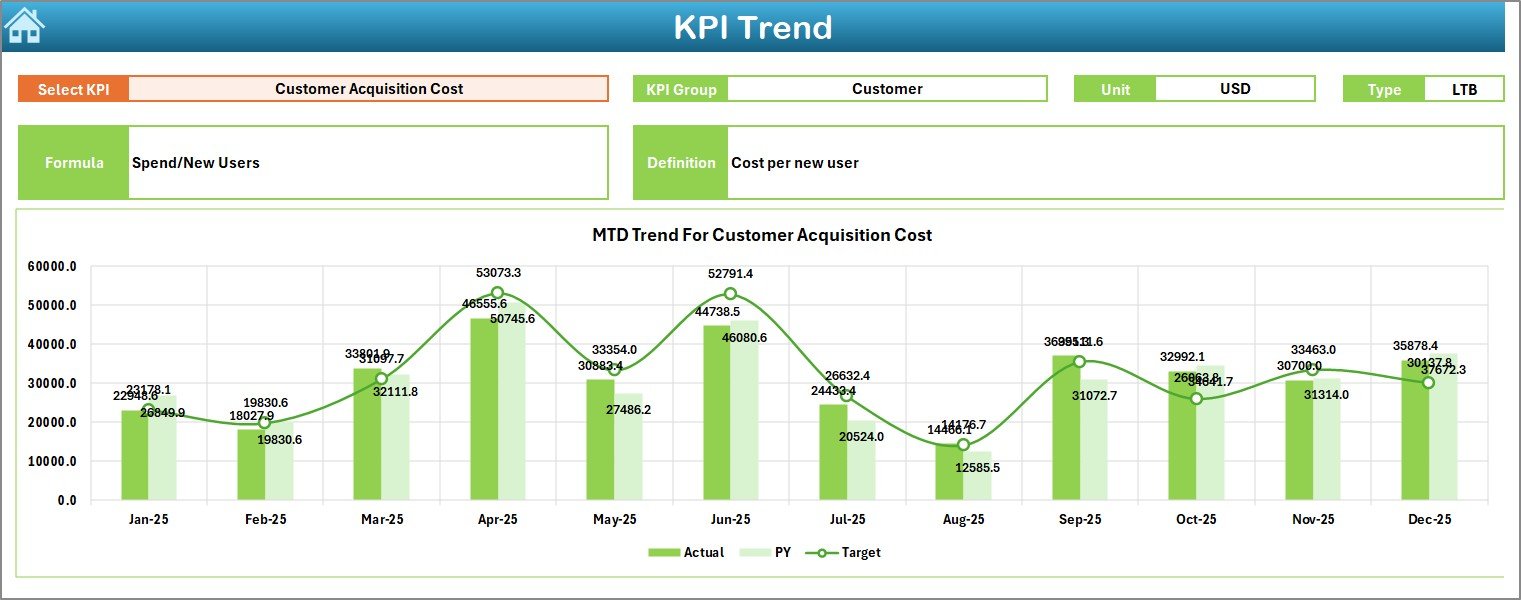
📊 Dynamic KPI Trend Analysis
Visual trend charts display KPI movement over time for deeper insight into performance consistency and seasonality.
🔄 Automatic Dashboard Refresh
Change the selected month once, and all KPIs, variances, and visuals update automatically—no manual recalculation.
🧭 Smart Navigation & Clean Layout
Use one-click navigation buttons to move across sheets without scrolling or confusion.
🧠 Built-in KPI Definitions
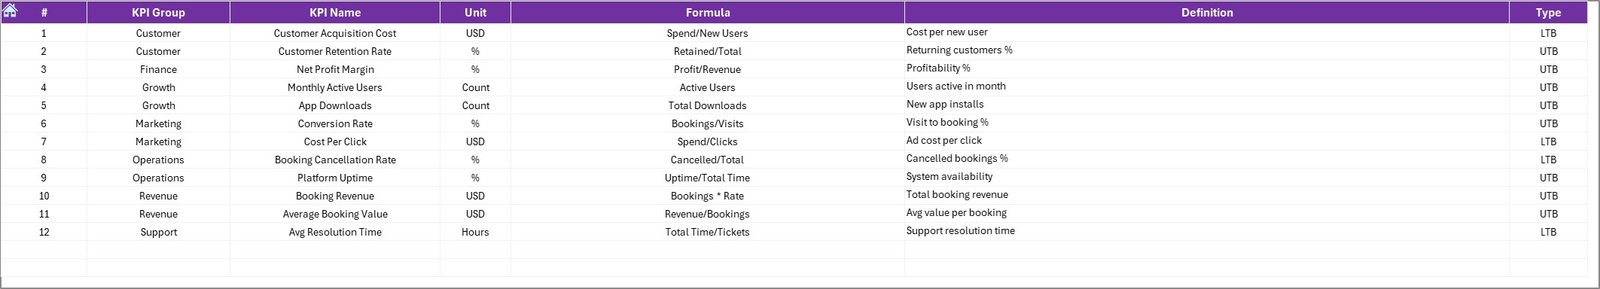
Every KPI includes its group, unit, formula, and definition—ensuring clarity and consistency across teams.
💡 Fully Customizable in Excel
Add or remove KPIs, adjust targets, modify formulas, or change formats—no coding required.
🔒 Offline, Secure & Excel-Native
Runs entirely in Excel with no internet dependency or external BI tools.
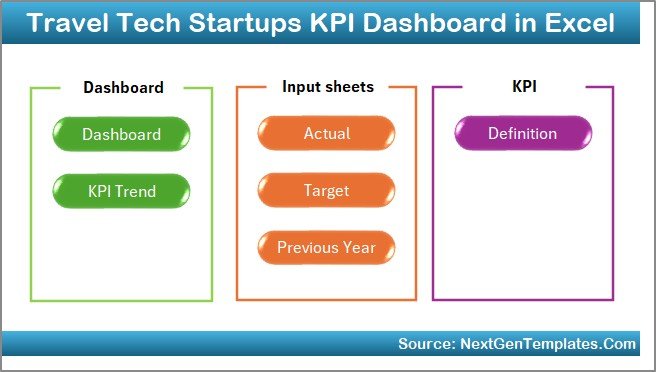
📁 What’s Inside the Travel Tech Startups KPI Dashboard in Excel
This dashboard includes 7 well-structured worksheets, each designed for a specific purpose:
📌 Summary Page – Navigation hub with one-click access to all sheets
📌 Dashboard Page – Central KPI view with MTD & YTD comparisons
📌 Trend Analysis Page – KPI-level trend charts and KPI metadata
📌 Actual Numbers Input Sheet – Enter current performance data
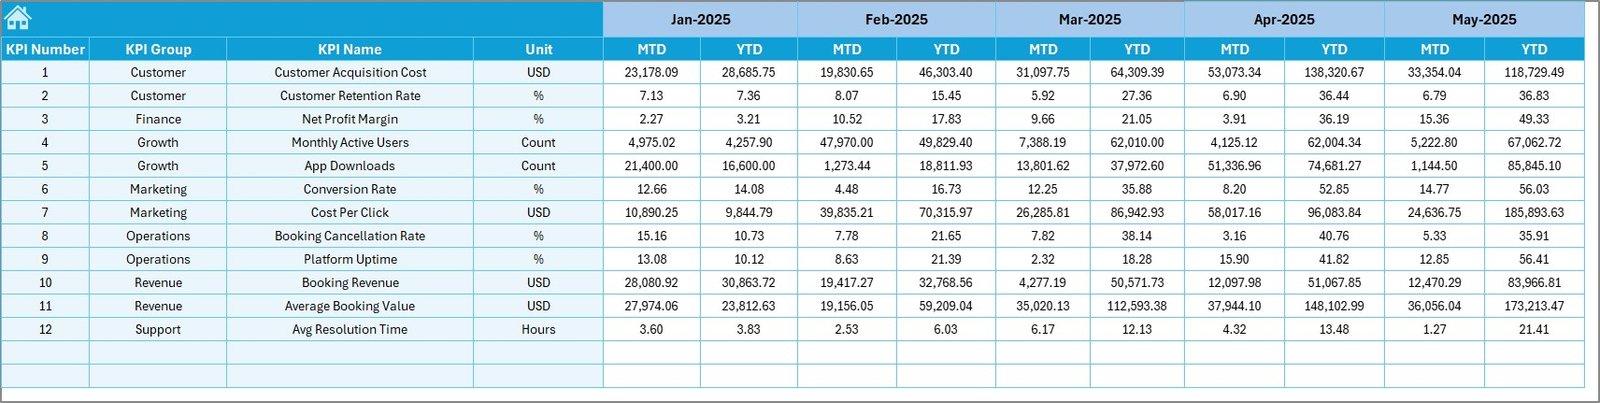
📌 Target Sheet – Define monthly and yearly KPI targets
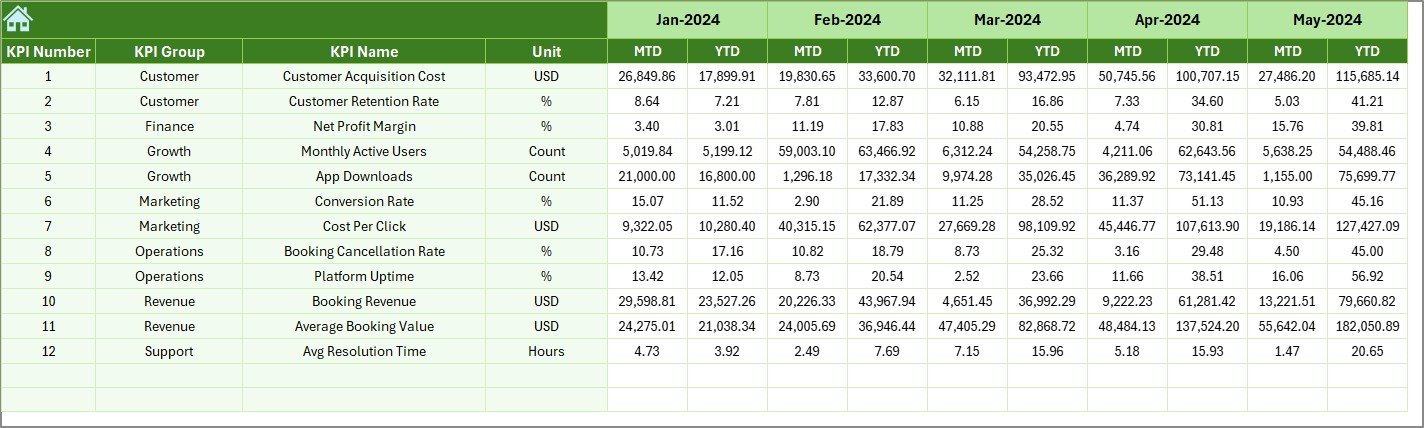
📌 Previous Year Numbers Sheet – Enable year-over-year analysis
📌 KPI Definition Sheet – Single source of truth for KPI logic
Together, these sheets create a complete KPI management system for travel tech startups.
🛠️ How to Use the Travel Tech Startups KPI Dashboard in Excel
1️⃣ Open the Excel file and review the KPI Definition Sheet
2️⃣ Enter monthly performance data in the Actual Numbers Input Sheet
3️⃣ Define goals in the Target Sheet
4️⃣ Add last year’s data in the Previous Year Numbers Sheet
5️⃣ Select the reporting month from the dropdown
6️⃣ Instantly analyze KPIs in the Dashboard and Trend pages
That’s it—no macros, no Power BI, no complex setup.
👥 Who Can Benefit from This Travel Tech KPI Dashboard?
This dashboard is ideal for:
🚀 Travel Tech Startup Founders
📊 Operations & Strategy Teams
💰 Finance & Revenue Managers
📈 Growth & Marketing Teams
🧑💼 Product & Platform Leaders
Whether you are early-stage or scaling fast, this dashboard adapts to your business model.
Click here to read the Detailed Blog Post
Watch the step-by-step video tutorial: