Managing business Travel & Expense Tracking with Excel, Power BI & Google Sheets Dashboards can quickly become a tangled mess of receipts, spreadsheets, approvals, and last-minute reports. Thankfully, modern digital dashboards make it easier to stay on top of every trip cost, trend, and team spend — all in real time.Travel & Expense Tracking with Excel Power BI & Google Sheets Dashboards
In this guide, we’ll explore three powerful travel and expense solutions from NextGenTemplates that help professionals track, visualize, and optimize travel costs using Excel, Power BI, and Google Sheets — without coding or complex setup. Whether you’re a finance leader, office admin, or business owner, these tools will transform how you monitor travel spend.Travel & Expense Tracking with Excel Power BI & Google Sheets Dashboards
🧠 Why Modern Dashboards Matter for Travel & Expense Tracking with Excel, Power BI & Google Sheets Dashboards
Traditional expense tracking with static Excel sheets or manual reports is slow, error-prone, and difficult to scale as your business grows. Dashboards provide:
-
Real-time insights into costs and travel patterns
-
Visual reporting through charts, cards, and filters
-
Faster approvals & accountability
-
Better team and department cost comparisons
-
Easy sharing and collaboration
With the right templates, anyone — even without technical expertise — can generate powerful reports in minutes.
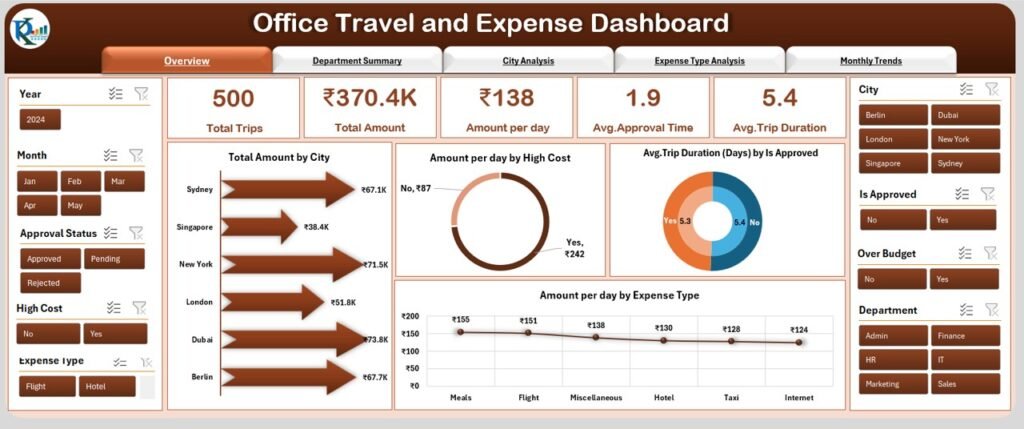
📊 1. Track Office Travel Costs in Excel
For many professionals, Excel remains the most accessible and flexible analytics tool. If you love Excel and want a powerful dashboard within your familiar environment, then the Excel version is perfect.
👉 Grab it here: Office Travel and Expense Dashboard in Excel.
📌 Key Benefits
-
📅 Integrated Expense Views – All travel-related spend (flights, hotels, transport, meals) shown on a clear dashboard.
-
📊 Instant Visuals – Charts and trend visuals help you identify peak spending periods.
-
📈 Advanced Filters – Analyze by employee, department, travel type or date range.
-
💡 No Coding Needed – Ready-to-use, just plug in your data and start tracking.
💡 Best For
-
Small businesses or teams relying on Excel for internal reporting
-
Users who prefer offline access
-
Finance pros who need fully customizable analytics
Excel dashboards give you total control over formulas, layouts, and data structure — ideal for deep, detailed analysis.

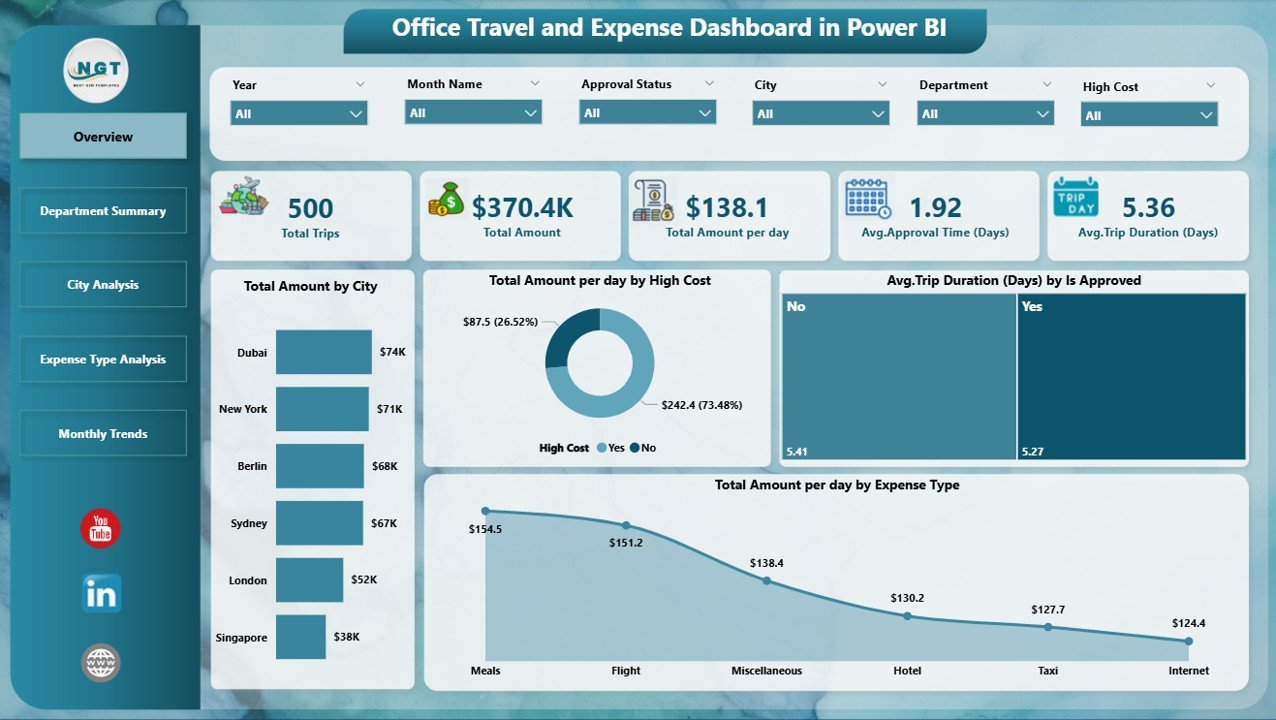
📈 2. Visualize Every Trip With Power BI
If your focus is dynamic data, interactive visuals, and executive-ready reporting, then the Power BI version is the best choice.
👉 Get it here: Office Travel and Expense Dashboard in Power BI.
🔥 What Makes It Stand Out
-
📊 Dynamic Interactive Visuals – Slice and dice data with one click.
-
📅 Trend Monitoring – Track how travel expenses evolve over time.
-
📌 Department & Trip Insights – Drill down into specifics like city-wise spend.
-
🎯 Executive Dashboards – Perfect for presentations, board reviews, or stakeholder reporting.
🧩 Best For
-
Mid-to-large businesses using Power BI for analytics
-
Teams that rely on interactive filtering, real-time visuals, and visuals on the go
-
Decision-makers who need granular insights without manual work
Power BI dashboards take your raw travel and expense data and turn it into clear, actionable business intelligence.
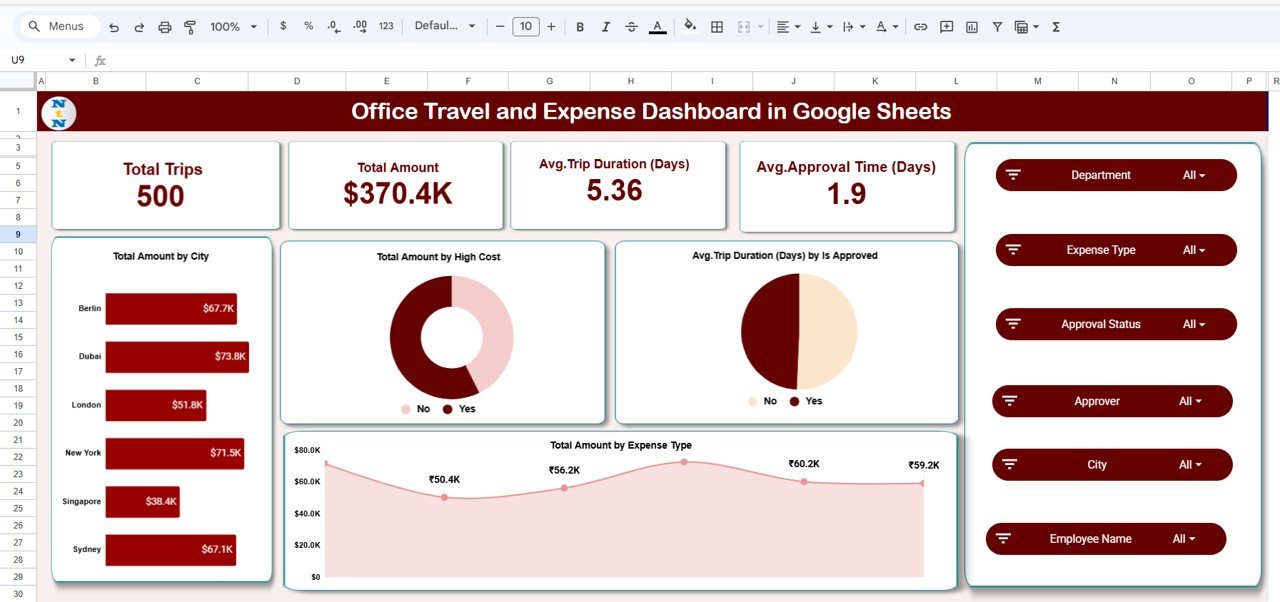
☁️ 3. Cloud-Powered with Google Sheets
Prefer cloud collaboration and real-time teamwork? The Google Sheets version lets teams work together from anywhere with up-to-date dashboards.
👉 Check it out: Office Travel and Expense Dashboard in Google Sheets.
📍 Highlights
-
🌐 Live Collaboration – Multiple users can view and edit data in real time.
-
📊 Clean Visualization – Simple charts and internal tracking views.
-
☁️ Anywhere Access – Works on any device with an internet connection.
-
⚡ Automated Analytics – Formulas and dynamic calculations built in.
👥 Best For
-
Remote teams and distributed offices
-
Users who prefer cloud over desktop solutions
-
Organizations already using Google Workspace
🆚 Excel vs Power BI vs Google Sheets — Which One Should You Choose?
| Feature | Excel Dashboard | Power BI Dashboard | Google Sheets Dashboard |
|---|---|---|---|
| Ease of Use | ⭐⭐⭐⭐ | ⭐⭐⭐ | ⭐⭐⭐⭐⭐ |
| Visual Interactivity | ⭐⭐⭐ | ⭐⭐⭐⭐⭐ | ⭐⭐ |
| Cloud Collaboration | ⭐⭐ | ⭐⭐⭐⭐ | ⭐⭐⭐⭐⭐ |
| Advanced Analytics | ⭐⭐⭐⭐ | ⭐⭐⭐⭐⭐ | ⭐⭐ |
| Best for Teams | ⭐⭐⭐ | ⭐⭐⭐⭐ | ⭐⭐⭐⭐⭐ |
-
Choose Excel when you need deep offline analysis and custom logic.
-
Choose Power BI when your team needs interactive visuals and executive dashboards.
-
Choose Google Sheets when collaboration and cloud access are top priorities.
📌 Real Use Cases — When Dashboards Add Value
These dashboards are more than templates — they are productivity tools that solve everyday problems:
✈️ Business Travel Approval Workflows
Visual trackers help managers pre-approve travel based on historic spend patterns.
📊 Monthly Cost Reporting
Eliminate manual reporting and generate automated monthly reports instantly.
🕒 Time Savings
Stop wrestling with spreadsheets — get ready-made dashboards that update as your data grows.
💼 Stakeholder Presentations
Export or present interactive insights without extra formatting work.
🏁 Final Thoughts: Supercharge Your Expense Reporting Today
Tracking travel and expense data manually is outdated — and costly. With dashboards designed for Excel, Power BI, and Google Sheets, you can automate, visualize, and analyze your data like a pro — in minutes.
Visit our YouTube channel to learn step-by-step video tutorials