Customer experience can make or break a business. Today’s customers expect fast responses, quick resolutions, and consistent service across every support channel. However, when customer support teams rely on scattered Excel files or static reports, visibility drops, performance suffers, and customer satisfaction declines.
That is exactly where the Customer Support Dashboard in Power BI becomes a powerful game-changer.
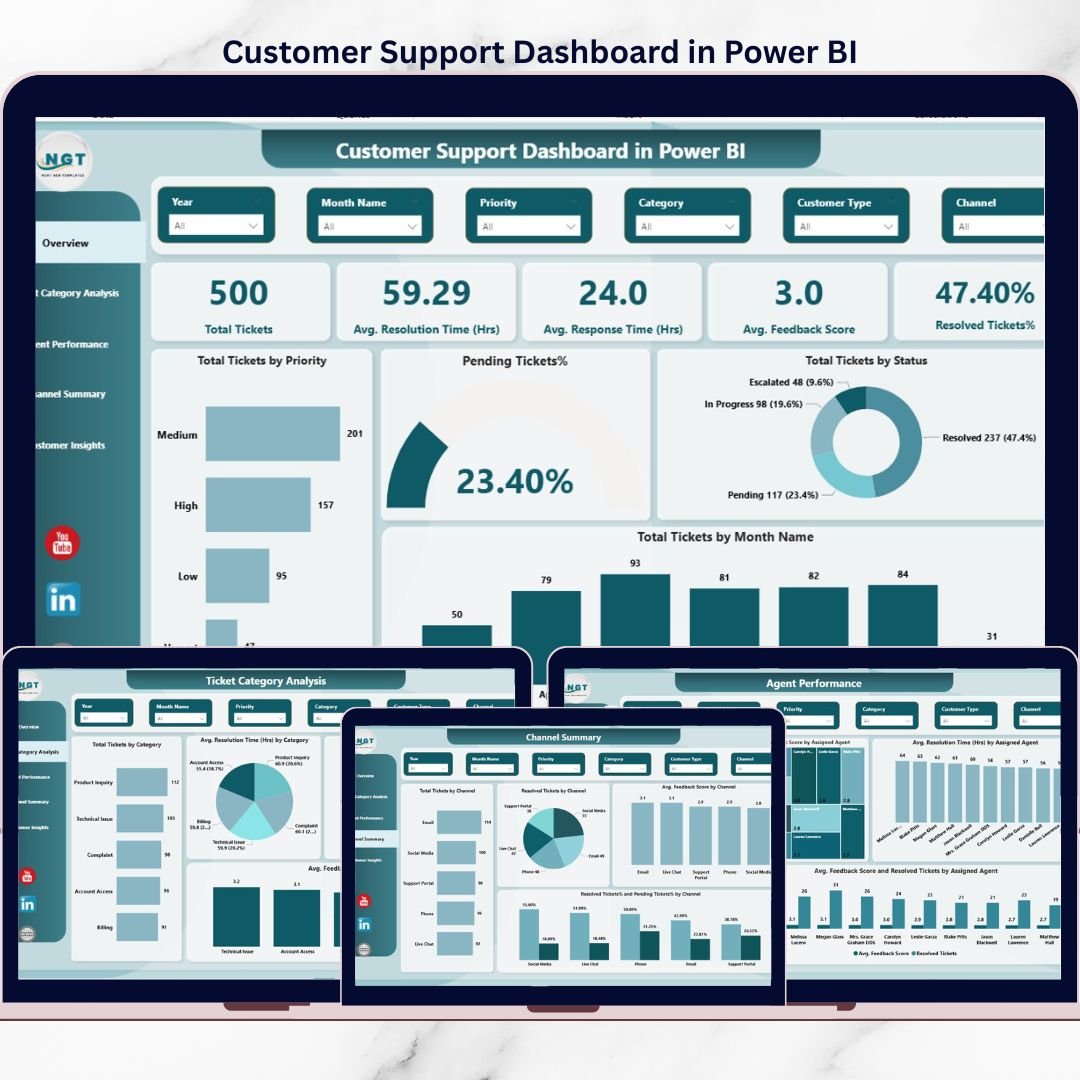
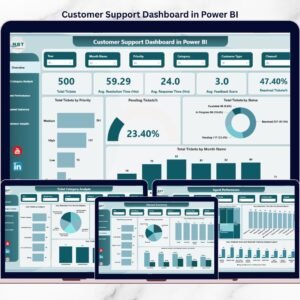
This ready-to-use Customer Support Dashboard in Power BI transforms raw support ticket data into clear, interactive, and actionable insights. It helps support managers, team leaders, and business decision-makers monitor performance in real time, identify issues early, and continuously improve service quality. Instead of guessing what is going wrong, you see the truth instantly—through KPIs, charts, and smart filters.
Built with business users in mind, this dashboard makes complex customer support data easy to understand, easy to analyze, and easy to act on.
## 🚀 Key Features of Customer Support Dashboard in Power BI
✅ Centralized Support Analytics – View all customer support KPIs in one interactive dashboard
⏱️ Response & Resolution Tracking – Monitor average response and resolution times clearly
📊 Multi-Page Analysis – Overview, ticket categories, agent performance, channels, and customers
🎯 Actionable KPI Cards – Total tickets, resolved %, feedback score, and time metrics
🔍 Interactive Slicers – Filter data by date, agent, category, channel, or customer type
📈 Trend & Performance Insights – Identify patterns, bottlenecks, and improvement areas
😊 Customer Satisfaction Monitoring – Track feedback scores and resolution efficiency
## 📦 What’s Inside the Customer Support Dashboard in Power BI
This Power BI dashboard includes five professionally designed pages, each answering critical business questions:
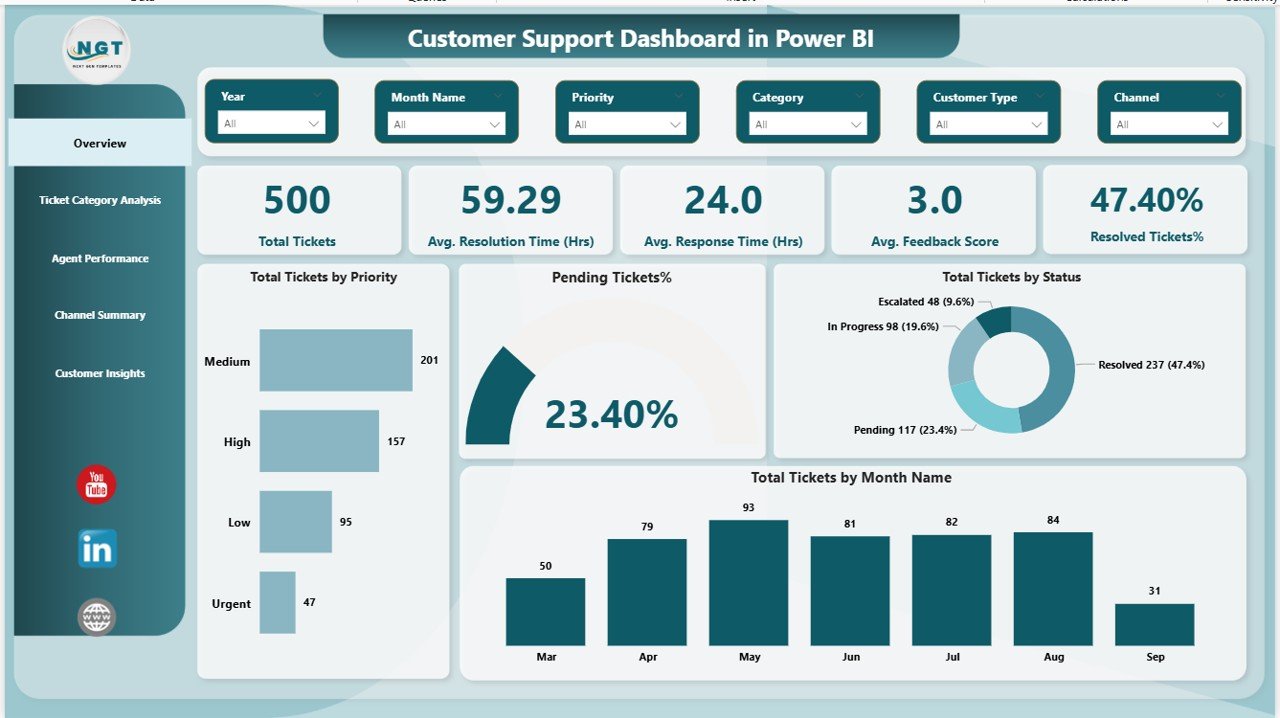
📌 Overview Page
Get a high-level snapshot of total tickets, response time, resolution time, feedback score, and resolution percentage with powerful KPI cards and trend visuals.
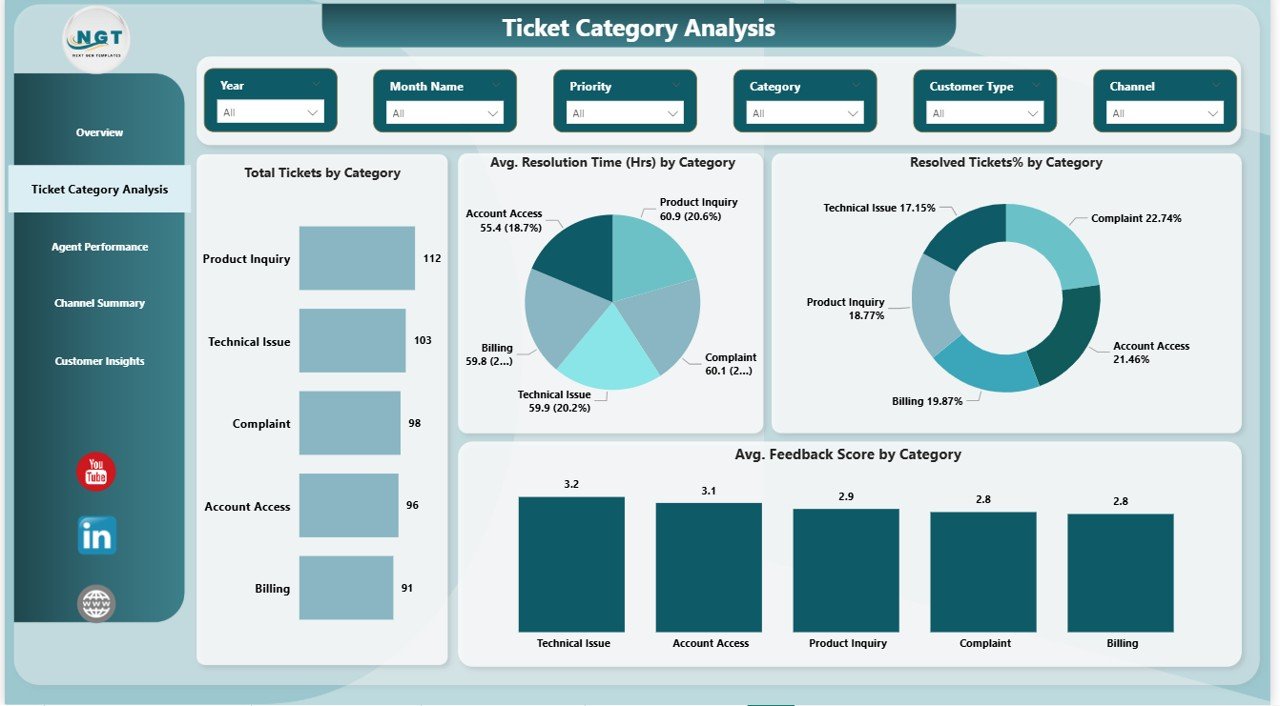
📌 Ticket Category Analysis
Identify which issue categories generate the most tickets, take longer to resolve, or receive low feedback scores.
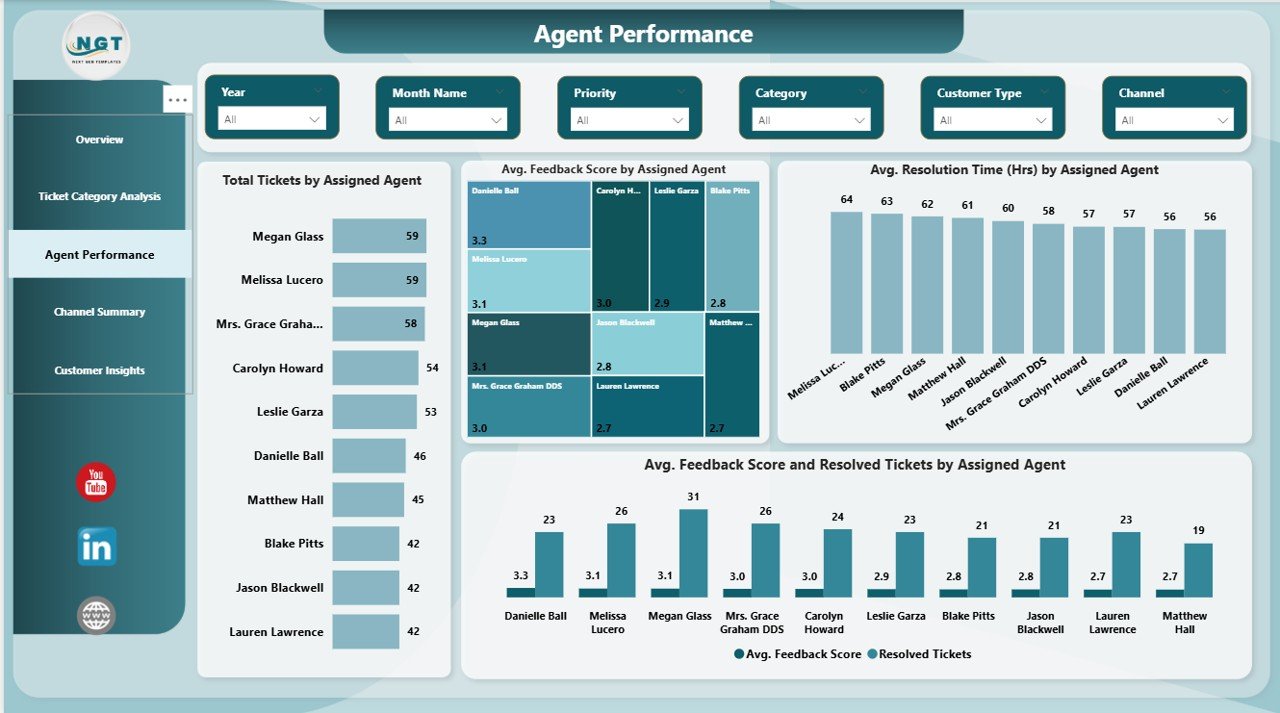
📌 Agent Performance Page
Analyze agent workloads, efficiency, resolution speed, and customer satisfaction to reward top performers and coach others.
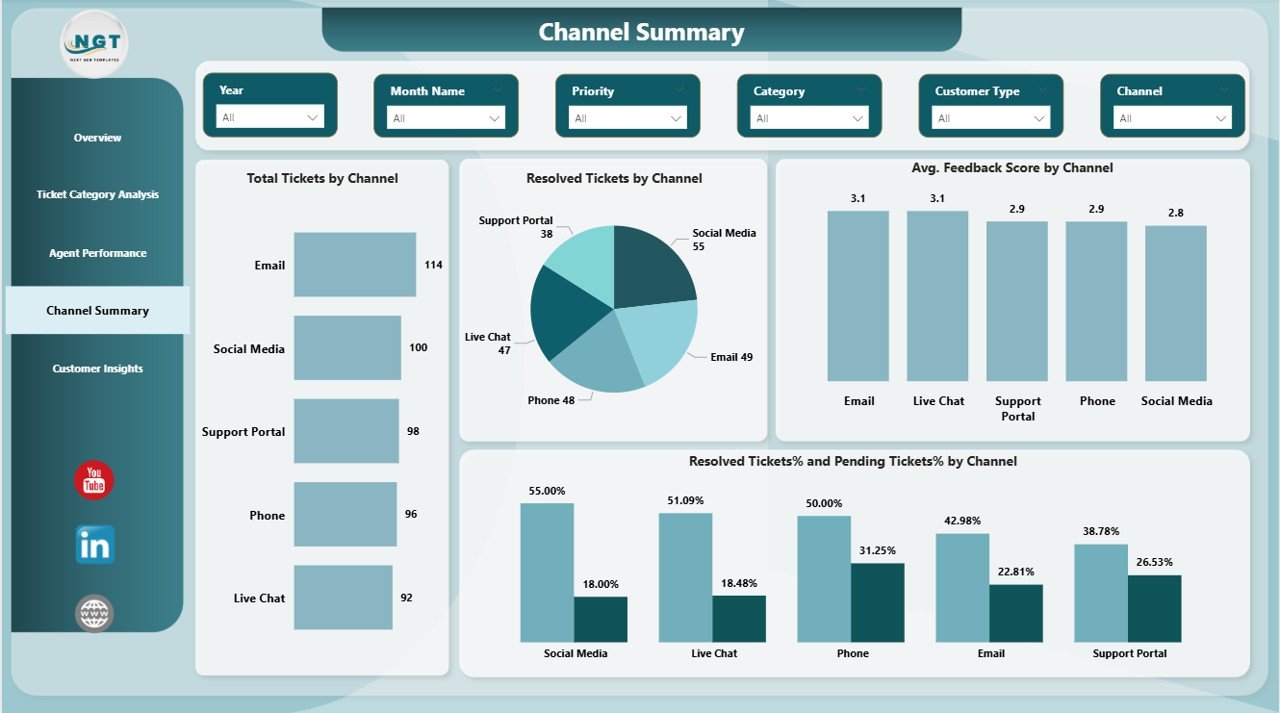
📌 Channel Summary Page
Understand how email, chat, phone, or portals perform and where delays or inefficiencies occur.
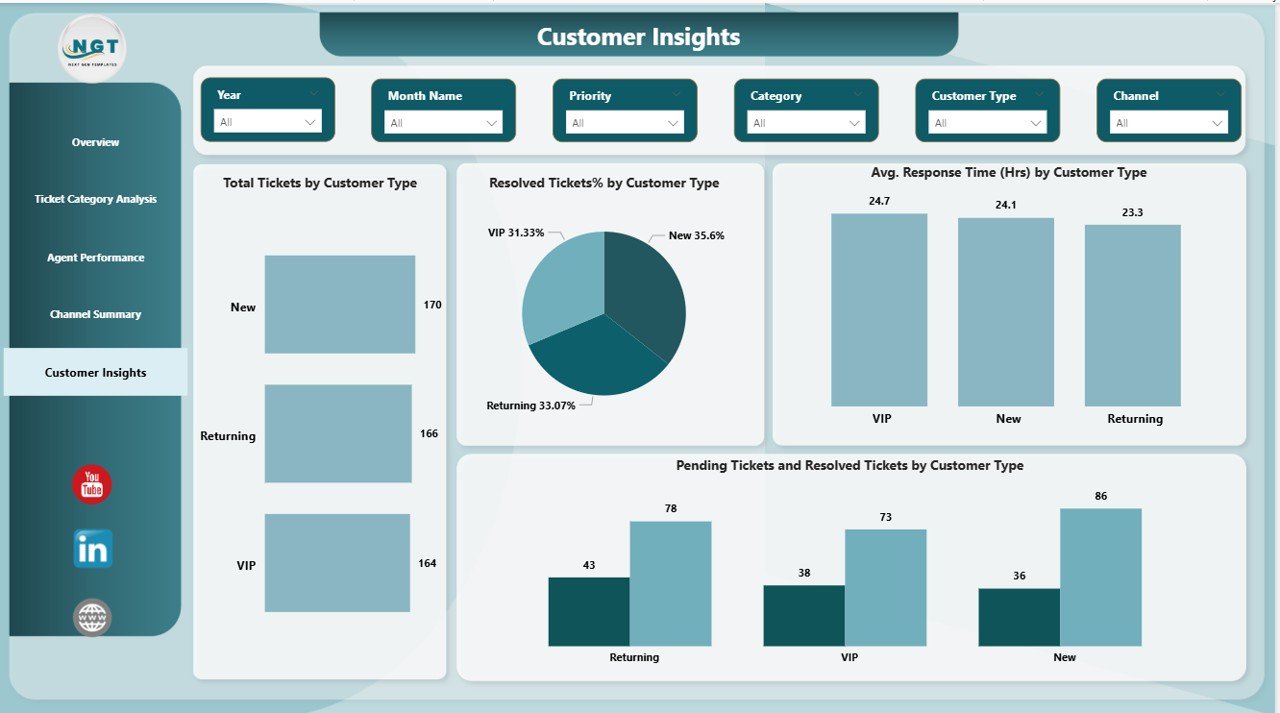
📌 Customer Insights Page
Segment customers by type and analyze response time, resolution rate, and pending issues for smarter prioritization.
## 🛠️ How to Use the Customer Support Dashboard in Power BI
Using this dashboard is simple and business-friendly:
1️⃣ Connect your ticket data from Excel, CRM, or database
2️⃣ Refresh the dataset in Power BI
3️⃣ Apply slicers to filter by time, agent, category, or channel
4️⃣ Monitor KPIs and trends in real time
5️⃣ Take data-driven actions to improve service quality
No advanced technical skills are required. The dashboard is designed for non-technical users as well.
## 👥 Who Can Benefit from This Customer Support Dashboard in Power BI
This dashboard is ideal for:
🎯 Customer Support Managers
🎯 Team Leaders & Supervisors
🎯 Operations Managers
🎯 Quality & Process Improvement Teams
🎯 Business Owners & Leadership
Whether you manage a small support team or a large service operation, this dashboard helps you stay in control, stay proactive, and stay customer-focused.
Click here to read the Detailed blog post
Watch the step-by-step video tutorial:


Reviews
There are no reviews yet.