Arbitration and mediation are designed to resolve disputes efficiently, fairly, and cost-effectively. However, when dispute resolution data is managed through scattered Excel files, emails, or static reports, visibility drops quickly. As a result, leadership struggles to track performance, identify delays, and take timely action.
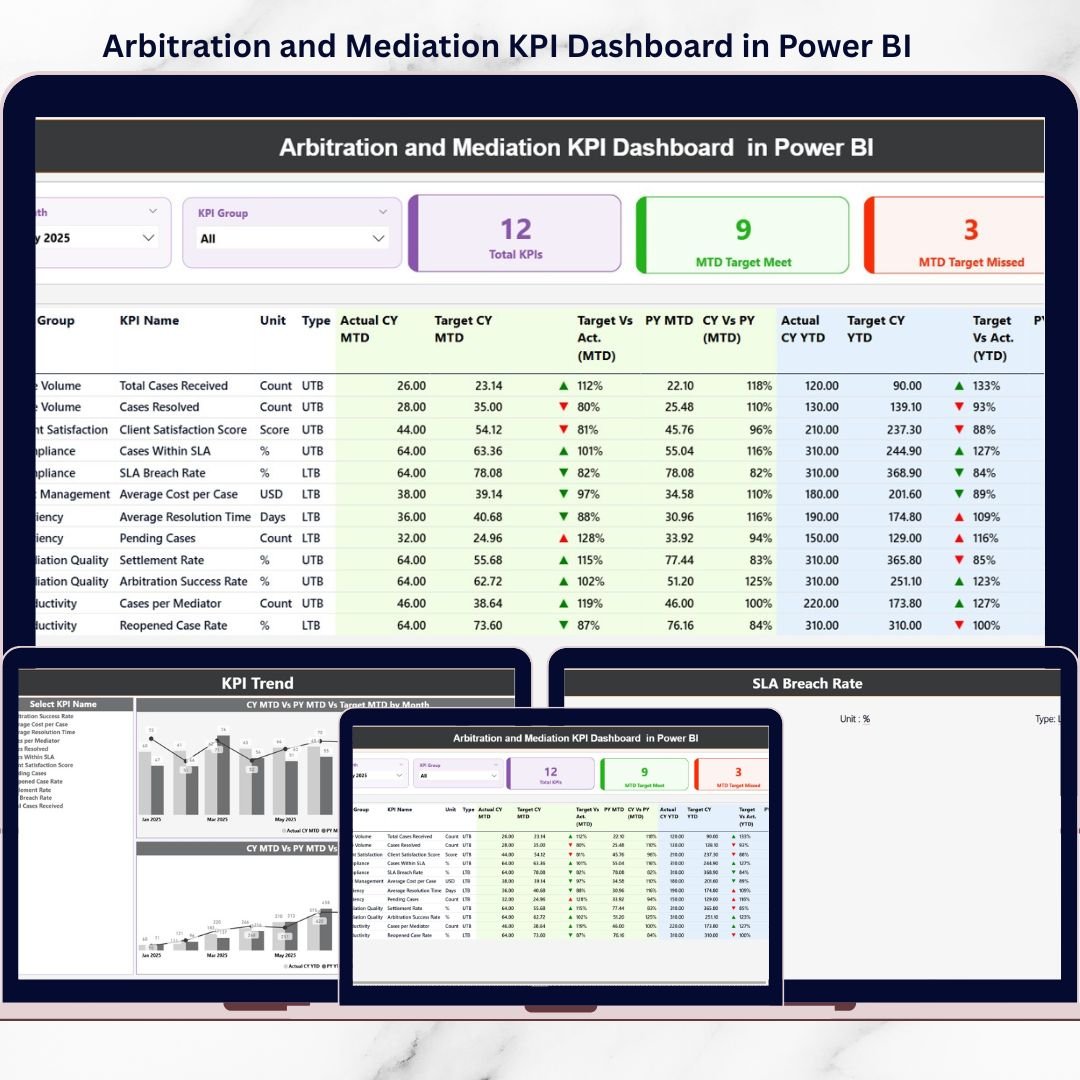
That is exactly where the Arbitration and Mediation KPI Dashboard in Power BI becomes a powerful solution.
This ready-to-use Power BI dashboard transforms raw arbitration and mediation data into clear, interactive, and actionable insights. Instead of manually reviewing case registers, legal teams can instantly monitor KPIs, track trends, compare targets, and identify bottlenecks—all from a single, interactive dashboard.
Designed with simplicity and flexibility in mind, this dashboard connects directly to Excel data sources. You update the Excel input sheets, refresh Power BI, and immediately see updated performance insights—no complex modeling or advanced technical skills required.
🚀 Key Features of Arbitration and Mediation KPI Dashboard in Power BI
📊 Centralized KPI Monitoring
Track all arbitration and mediation KPIs in one interactive Power BI dashboard.
🎯 MTD & YTD Performance Tracking
Monitor Month-to-Date and Year-to-Date performance with dynamic calculations.
📈 Target vs Actual Analysis
Instantly identify KPIs that meet or miss defined targets.
🔄 Previous Year Comparison
Analyze performance improvement or decline using prior-year data.
📉 Interactive Trend Analysis
View MTD and YTD trends for Actual, Target, and Previous Year using combo charts.
🧭 Powerful Slicers & Filters
Filter data by month and KPI group for focused analysis.
🧠 Drill-Through KPI Definitions
Access KPI formula and definition instantly for better clarity.
⚙️ Excel-Based Data Input
Maintain data easily using familiar Excel sheets.
📦 What’s Inside the Arbitration and Mediation KPI Dashboard in Power BI
This digital product includes three professionally designed Power BI pages, supported by structured Excel input sheets.
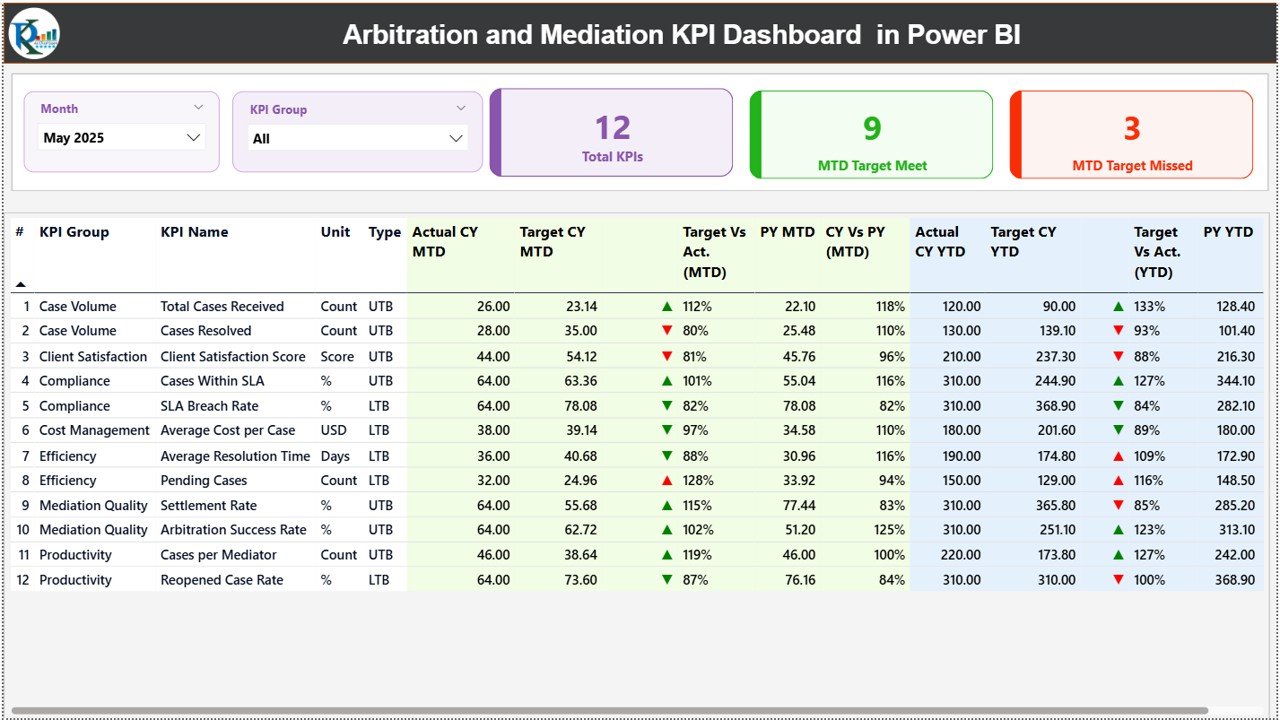
📌 Summary Page
The main dashboard view showing:
-
Month and KPI Group slicers
-
KPI cards (Total KPIs, MTD Target Met, MTD Target Missed)
-
Detailed KPI table with:
-
KPI Name, Group, Unit, Type
-
Actual vs Target (MTD & YTD)
-
Status icons (▲ / ▼)
-
Previous Year comparison
-
CY vs PY percentage variance
-
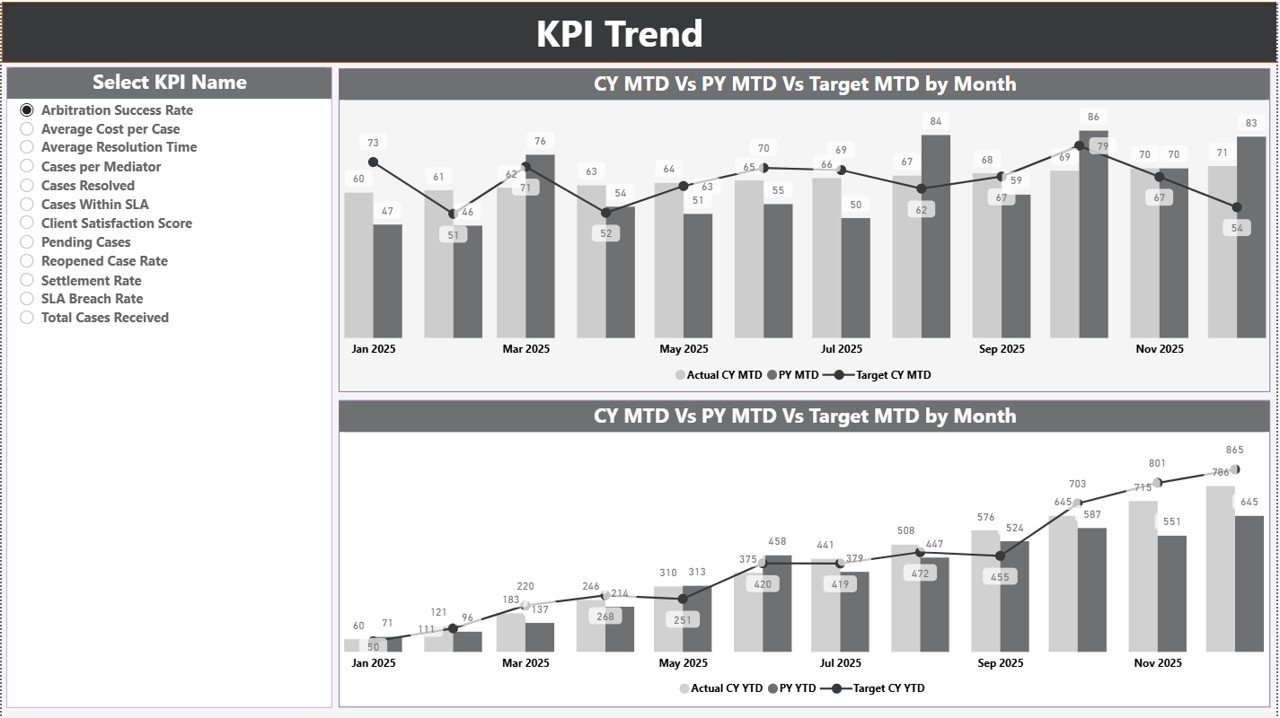
📌 KPI Trend Page
Analyze individual KPI performance over time with:
-
KPI Name slicer
-
MTD Actual vs Target vs Previous Year chart
-
YTD Actual vs Target vs Previous Year chart
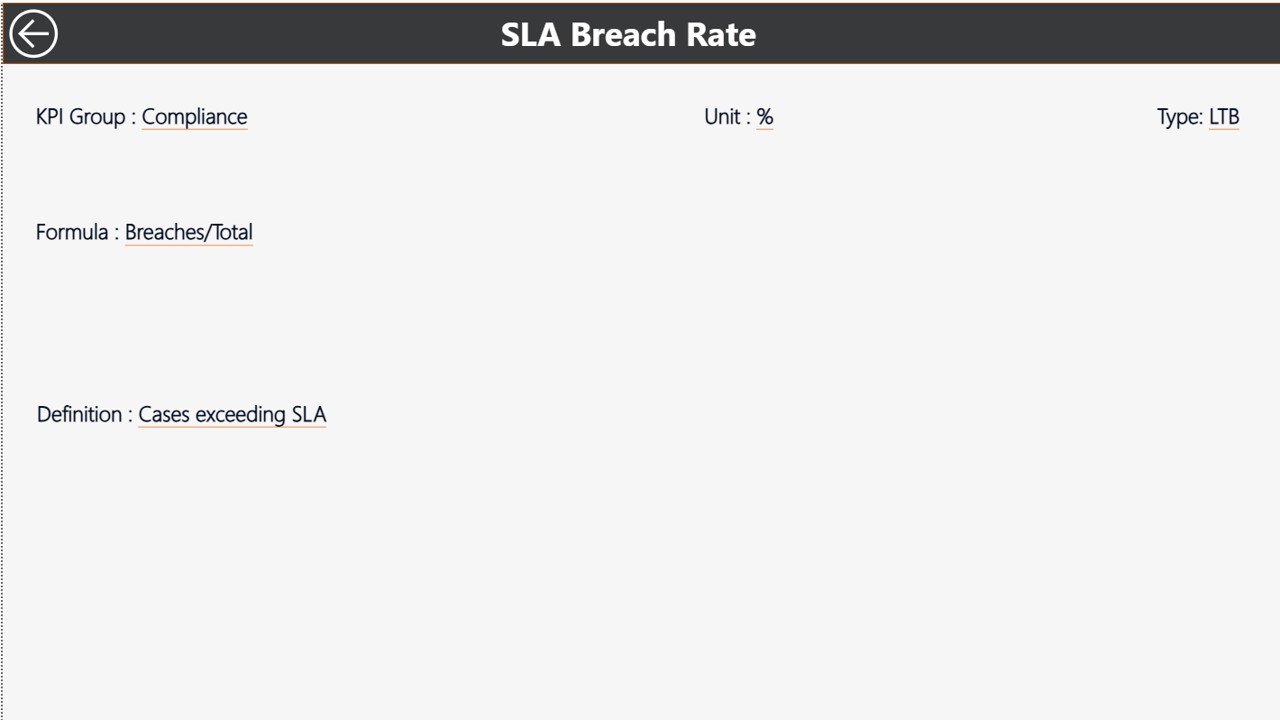
📌 KPI Definition Page (Drill-Through)
A dedicated drill-through page displaying:
-
KPI Formula
-
KPI Definition
This page ensures consistent KPI understanding and accurate analysis.
📌 Excel Data Source Sheets
-
Input Actual – Enter MTD and YTD actual values
-
Input Target – Define MTD and YTD targets
-
KPI Definition – Maintain KPI metadata (Unit, Formula, Type – LTB/UTB)
🛠️ How to Use the Arbitration and Mediation KPI Dashboard in Power BI
Using this dashboard is simple and efficient:
1️⃣ Enter actual KPI values in the Input Actual Excel sheet
2️⃣ Define KPI targets in the Input Target sheet
3️⃣ Maintain KPI details in the KPI Definition sheet
4️⃣ Open Power BI and click Refresh
5️⃣ Use slicers to filter Month and KPI Group
6️⃣ Analyze performance on Summary and Trend pages
No complex setup. No manual calculations. Just refresh and analyze.
👥 Who Can Benefit from This Arbitration and Mediation KPI Dashboard
This dashboard is ideal for:
⚖️ Arbitration Centers – Track case volume, backlog, and resolution efficiency
🤝 Mediation Institutions – Monitor settlement success and timelines
🏢 Corporate Legal Departments – Improve transparency and accountability
📊 Dispute Resolution Professionals – Analyze workload and performance trends
🧠 Legal Consultants & Analysts – Deliver data-driven insights to clients
🏛️ Small & Large Legal Teams – Gain professional analytics without high costs
Because it is built in Power BI with Excel as the data source, it scales easily for organizations of all sizes.
🔗 Click here to read the Detailed blog post
🎥 Visit our YouTube channel to learn step-by-step video tutorials
👉 https://youtube.com/@PKAnExcelExpert


Reviews
There are no reviews yet.